
Key Insights
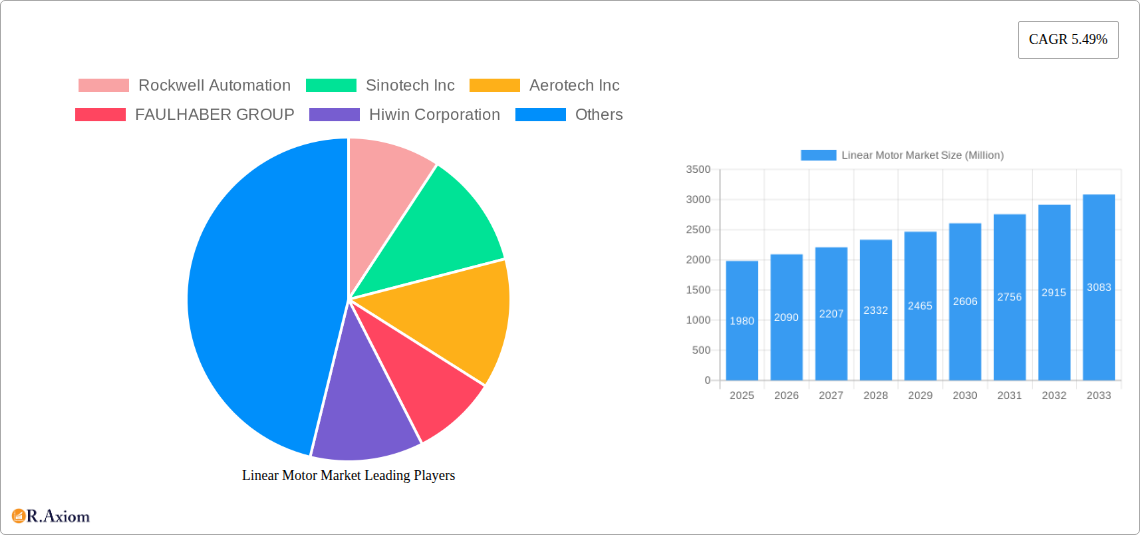
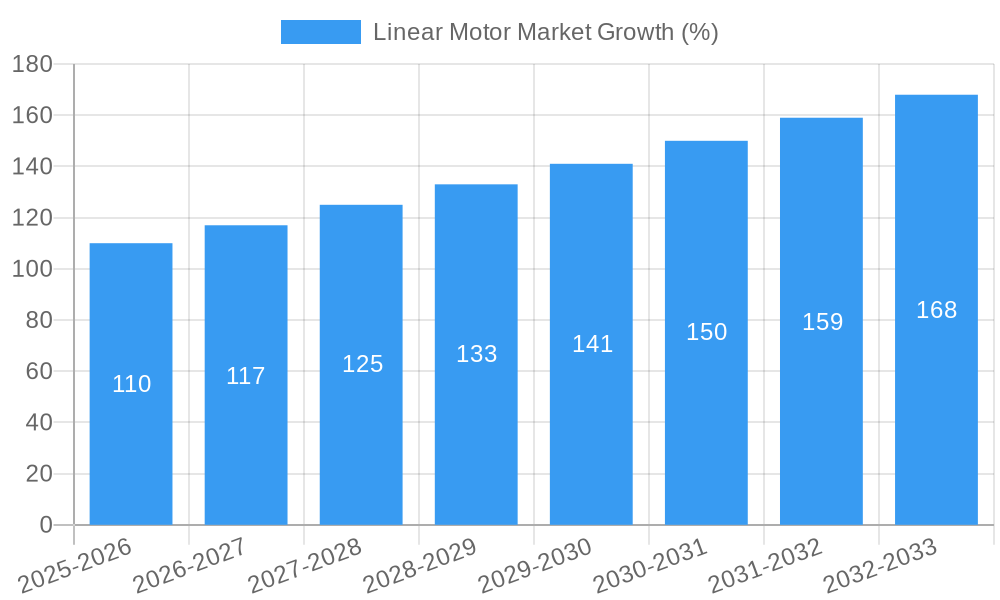
The global linear motor market, valued at $1.98 billion in 2025, is projected to experience robust growth, driven by increasing automation across diverse sectors and the rising demand for high-precision motion control systems. The market's Compound Annual Growth Rate (CAGR) of 5.49% from 2019 to 2024 indicates a consistent upward trajectory, expected to continue throughout the forecast period (2025-2033). Key drivers include the growing adoption of linear motors in automation solutions for manufacturing, particularly in the automotive and electronics industries, where their speed, accuracy, and efficiency are highly valued. Furthermore, advancements in materials science and control technologies are leading to more compact, energy-efficient, and cost-effective linear motor designs, expanding their applicability across various sectors like building and construction (e.g., automated material handling), food and beverage (e.g., high-speed packaging), and textiles (e.g., precise fabric cutting). The market segmentation reveals strong growth across various applications, with building and construction, electrical and electronics, and automotive sectors leading the charge. The presence of established players like Rockwell Automation, FANUC, and Yaskawa Electric, alongside emerging technology providers, fosters innovation and competition, further fueling market expansion. While some restraints may include initial high capital investment costs and the need for specialized expertise in implementation and maintenance, these are likely to be offset by the long-term benefits and cost savings associated with increased productivity and operational efficiency.
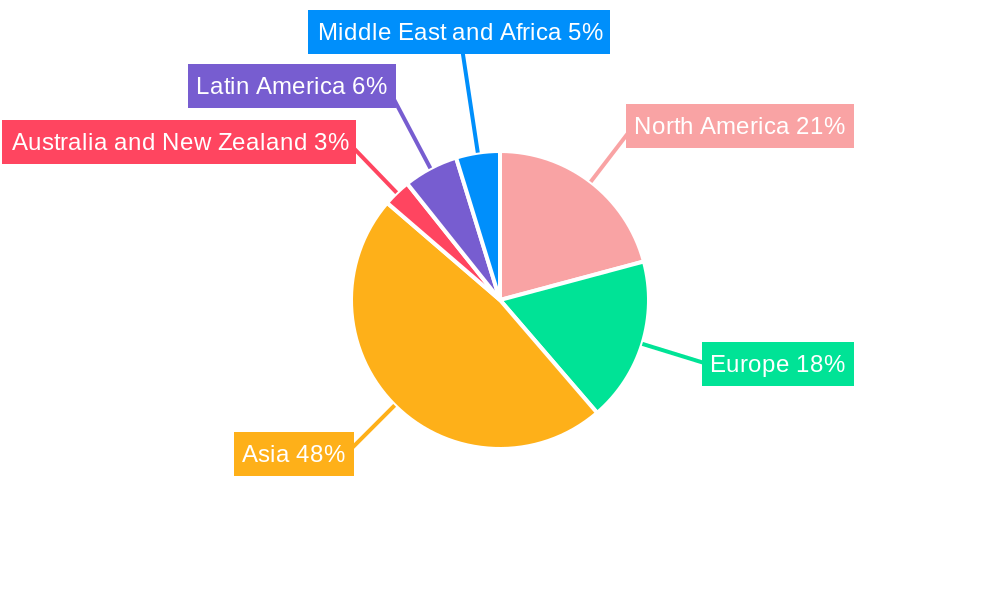
The geographical distribution of the linear motor market is expected to be diverse, with North America and Europe holding significant market share due to established industrial automation infrastructure and technological advancements. However, the Asia-Pacific region is anticipated to witness the fastest growth rate in the coming years, fueled by rapid industrialization and increasing investments in automation across various industries in countries like China, Japan, and South Korea. The competitive landscape is characterized by both established players and specialized niche companies, resulting in a dynamic environment with continuous product innovation and competitive pricing, further stimulating market expansion. The forecast period (2025-2033) promises sustained growth, driven by evolving technological advancements, increasing automation across diverse sectors and the continuous search for enhanced productivity and efficiency in manufacturing and other applications.
Linear Motor Market: A Comprehensive Report (2019-2033)
This comprehensive report provides an in-depth analysis of the global linear motor market, covering market size, segmentation, key players, growth drivers, challenges, and future opportunities. The study period spans from 2019 to 2033, with 2025 serving as the base and estimated year. The report utilizes a robust methodology incorporating extensive primary and secondary research to deliver actionable insights for industry stakeholders. The market is segmented by design (Cylindrical, Flat Plate, U-Channel) and application (Building and Construction, Electrical and Electronics, Food and Beverage, Textile, Agriculture, Automotive, Others). The report projects a xx Million market value by 2033, exhibiting a CAGR of xx% during the forecast period (2025-2033).
Linear Motor Market Market Concentration & Innovation
The linear motor market exhibits a moderately concentrated landscape, with key players holding significant market share. Rockwell Automation, FANUC CORPORATION, and Yaskawa Electric Corporation are prominent examples, collectively accounting for an estimated xx% of the global market in 2024. However, the presence of several smaller, specialized players indicates a competitive environment. Innovation is a key driver, with continuous advancements in motor design, control systems, and materials leading to improved efficiency, precision, and performance. Regulatory frameworks related to energy efficiency and environmental impact are also shaping technological advancements. Product substitutes, such as hydraulic and pneumatic systems, face increasing competition due to linear motors' superior precision and energy efficiency. The market is witnessing a rise in M&A activity, with recent deals focused on expanding product portfolios and geographic reach. The total value of M&A deals in the linear motor sector from 2019-2024 is estimated at xx Million.
- Market Share: Top 5 players hold approximately xx% of the market share (2024).
- M&A Deal Value (2019-2024): Estimated at xx Million.
- Innovation Drivers: Improved motor design, advanced control systems, new materials, regulatory pressures.
- End-User Trends: Increasing demand for automation across diverse industries, particularly in automotive and electronics.
Linear Motor Market Industry Trends & Insights
The linear motor market is experiencing robust growth, driven by the increasing adoption of automation technologies across various sectors. The automotive industry's shift towards electric vehicles and advanced manufacturing techniques significantly fuels demand. Similarly, the electronics industry's pursuit of high-precision assembly and handling necessitates linear motors. The market is witnessing a rise in the adoption of high-speed and high-precision linear motors, which are pivotal in boosting productivity and enhancing product quality. Technological disruptions, such as the integration of advanced control algorithms and the development of more energy-efficient designs, are propelling market growth. The global market is exhibiting a growing preference for customized linear motor solutions to meet specific application requirements. Competitive dynamics are intense, with leading players investing heavily in R&D and strategic partnerships to maintain their market positions and expand their reach. The market is projected to achieve a CAGR of xx% during the forecast period (2025-2033).
Dominant Markets & Segments in Linear Motor Market
The automotive sector represents a dominant application segment, fueled by the expanding use of linear motors in electric vehicle manufacturing and automated assembly lines. The Asia-Pacific region leads geographically, driven by strong economic growth, increased industrialization, and government support for automation. Within design segments, cylindrical linear motors hold the largest market share due to their versatility and adaptability across various applications.
- Key Drivers in Asia-Pacific: Strong economic growth, rising industrialization, favorable government policies supporting automation.
- Automotive Sector Drivers: Electrification of vehicles, increasing demand for automation in manufacturing.
- Cylindrical Linear Motor Dominance: Versatility, adaptability to diverse applications.
Linear Motor Market Product Developments
Recent product innovations focus on enhancing efficiency, precision, and compactness. The introduction of smaller, more powerful linear actuators caters to the needs of emerging applications like medical devices and robotics. Companies are emphasizing modular designs, facilitating customization and integration into various systems. These developments highlight a shift toward more energy-efficient and versatile linear motor solutions to meet the demands of a rapidly evolving technological landscape.
Report Scope & Segmentation Analysis
This report comprehensively analyzes the linear motor market segmented by design (Cylindrical, Flat Plate, U-Channel) and application (Building and Construction, Electrical and Electronics, Food and Beverage, Textile, Agriculture, Automotive, Others). Each segment's growth projections, market size, and competitive dynamics are meticulously evaluated. The cylindrical segment enjoys the largest market share due to its broad applicability, while the automotive segment leads in application-based segmentation. The report provides detailed insights into the growth potential of each segment and the associated competitive landscape.
Key Drivers of Linear Motor Market Growth
The linear motor market's expansion is fueled by several factors, including increasing automation across industries, particularly in manufacturing, advancements in motor design leading to enhanced precision and efficiency, the growing demand for high-speed and high-precision motion control systems, and the rising adoption of electric vehicles. Favorable government policies promoting industrial automation in several regions further contribute to market growth.
Challenges in the Linear Motor Market Sector
Despite its significant growth potential, the linear motor market faces several challenges. High initial investment costs associated with linear motor systems can hinder adoption, particularly among smaller companies. Supply chain disruptions related to critical components can impact production and delivery timelines, resulting in potential revenue losses. Furthermore, intense competition from established players and emerging technologies necessitates continuous innovation and adaptation to stay ahead.
Emerging Opportunities in Linear Motor Market
The linear motor market presents several opportunities. The increasing adoption of automation in emerging economies, especially in Asia and Latin America, offers considerable growth potential. Development of more energy-efficient and sustainable linear motors aligns with global environmental concerns and creates new market niches. Advancements in control systems and integration with artificial intelligence open doors for further optimization and enhanced performance. The integration of linear motors into robotics and medical devices presents promising growth areas.
Leading Players in the Linear Motor Market Market
- Rockwell Automation
- Sinotech Inc
- Aerotech Inc
- FAULHABER GROUP
- Hiwin Corporation
- FANUC CORPORATION
- ETEL SA
- Mitsubishi Electric Corporation
- YASKAWA ELECTRIC CORPORATION
- Tecnotion
Key Developments in Linear Motor Market Industry
- February 2023: Faulhaber launched its compact linear actuator L series, suitable for various applications including medical devices.
- December 2022: ETEL S.A. introduced its MWD+ magnet-track family, enhancing the performance of existing LMG and LMS linear motors.
Strategic Outlook for Linear Motor Market Market
The linear motor market is poised for sustained growth, driven by technological advancements, increasing automation, and expanding applications across diverse industries. The focus on energy efficiency, precision, and customization presents significant opportunities for innovation and market expansion. Strategic partnerships, focused R&D, and aggressive expansion into new markets will be crucial for success in this dynamic sector.
Linear Motor Market Segmentation
-
1. Design
- 1.1. Cylindrical
- 1.2. Flat Plate
- 1.3. U-Channel
-
2. Application
- 2.1. Building and Construction
- 2.2. Electrical and Electronics
- 2.3. Food and Beverage
- 2.4. Textile
- 2.5. Agriculture
- 2.6. Automotive
- 2.7. Others
Linear Motor Market Segmentation By Geography
- 1. North America
- 2. Europe
- 3. Asia
- 4. Australia and New Zealand
- 5. Latin America
- 6. Middle East and Africa
Linear Motor Market REPORT HIGHLIGHTS
| Aspects | Details |
|---|---|
| Study Period | 2019-2033 |
| Base Year | 2024 |
| Estimated Year | 2025 |
| Forecast Period | 2025-2033 |
| Historical Period | 2019-2024 |
| Growth Rate | CAGR of 5.49% from 2019-2033 |
| Segmentation |
|
Table of Contents
- 1. Introduction
- 1.1. Research Scope
- 1.2. Market Segmentation
- 1.3. Research Methodology
- 1.4. Definitions and Assumptions
- 2. Executive Summary
- 2.1. Introduction
- 3. Market Dynamics
- 3.1. Introduction
- 3.2. Market Drivers
- 3.2.1. Rising Industrial Automation is fuelling the demand for linear motors; Growing demand for high performance linear motor in the semiconductor industry
- 3.3. Market Restrains
- 3.3.1. High Initial Investment; Increased power consumption for high load applications
- 3.4. Market Trends
- 3.4.1. Optimum Control Characteristics of Linear Motors to Propel the Growth of the Market Studied
- 4. Market Factor Analysis
- 4.1. Porters Five Forces
- 4.2. Supply/Value Chain
- 4.3. PESTEL analysis
- 4.4. Market Entropy
- 4.5. Patent/Trademark Analysis
- 5. Global Linear Motor Market Analysis, Insights and Forecast, 2019-2031
- 5.1. Market Analysis, Insights and Forecast - by Design
- 5.1.1. Cylindrical
- 5.1.2. Flat Plate
- 5.1.3. U-Channel
- 5.2. Market Analysis, Insights and Forecast - by Application
- 5.2.1. Building and Construction
- 5.2.2. Electrical and Electronics
- 5.2.3. Food and Beverage
- 5.2.4. Textile
- 5.2.5. Agriculture
- 5.2.6. Automotive
- 5.2.7. Others
- 5.3. Market Analysis, Insights and Forecast - by Region
- 5.3.1. North America
- 5.3.2. Europe
- 5.3.3. Asia
- 5.3.4. Australia and New Zealand
- 5.3.5. Latin America
- 5.3.6. Middle East and Africa
- 5.1. Market Analysis, Insights and Forecast - by Design
- 6. North America Linear Motor Market Analysis, Insights and Forecast, 2019-2031
- 6.1. Market Analysis, Insights and Forecast - by Design
- 6.1.1. Cylindrical
- 6.1.2. Flat Plate
- 6.1.3. U-Channel
- 6.2. Market Analysis, Insights and Forecast - by Application
- 6.2.1. Building and Construction
- 6.2.2. Electrical and Electronics
- 6.2.3. Food and Beverage
- 6.2.4. Textile
- 6.2.5. Agriculture
- 6.2.6. Automotive
- 6.2.7. Others
- 6.1. Market Analysis, Insights and Forecast - by Design
- 7. Europe Linear Motor Market Analysis, Insights and Forecast, 2019-2031
- 7.1. Market Analysis, Insights and Forecast - by Design
- 7.1.1. Cylindrical
- 7.1.2. Flat Plate
- 7.1.3. U-Channel
- 7.2. Market Analysis, Insights and Forecast - by Application
- 7.2.1. Building and Construction
- 7.2.2. Electrical and Electronics
- 7.2.3. Food and Beverage
- 7.2.4. Textile
- 7.2.5. Agriculture
- 7.2.6. Automotive
- 7.2.7. Others
- 7.1. Market Analysis, Insights and Forecast - by Design
- 8. Asia Linear Motor Market Analysis, Insights and Forecast, 2019-2031
- 8.1. Market Analysis, Insights and Forecast - by Design
- 8.1.1. Cylindrical
- 8.1.2. Flat Plate
- 8.1.3. U-Channel
- 8.2. Market Analysis, Insights and Forecast - by Application
- 8.2.1. Building and Construction
- 8.2.2. Electrical and Electronics
- 8.2.3. Food and Beverage
- 8.2.4. Textile
- 8.2.5. Agriculture
- 8.2.6. Automotive
- 8.2.7. Others
- 8.1. Market Analysis, Insights and Forecast - by Design
- 9. Australia and New Zealand Linear Motor Market Analysis, Insights and Forecast, 2019-2031
- 9.1. Market Analysis, Insights and Forecast - by Design
- 9.1.1. Cylindrical
- 9.1.2. Flat Plate
- 9.1.3. U-Channel
- 9.2. Market Analysis, Insights and Forecast - by Application
- 9.2.1. Building and Construction
- 9.2.2. Electrical and Electronics
- 9.2.3. Food and Beverage
- 9.2.4. Textile
- 9.2.5. Agriculture
- 9.2.6. Automotive
- 9.2.7. Others
- 9.1. Market Analysis, Insights and Forecast - by Design
- 10. Latin America Linear Motor Market Analysis, Insights and Forecast, 2019-2031
- 10.1. Market Analysis, Insights and Forecast - by Design
- 10.1.1. Cylindrical
- 10.1.2. Flat Plate
- 10.1.3. U-Channel
- 10.2. Market Analysis, Insights and Forecast - by Application
- 10.2.1. Building and Construction
- 10.2.2. Electrical and Electronics
- 10.2.3. Food and Beverage
- 10.2.4. Textile
- 10.2.5. Agriculture
- 10.2.6. Automotive
- 10.2.7. Others
- 10.1. Market Analysis, Insights and Forecast - by Design
- 11. Middle East and Africa Linear Motor Market Analysis, Insights and Forecast, 2019-2031
- 11.1. Market Analysis, Insights and Forecast - by Design
- 11.1.1. Cylindrical
- 11.1.2. Flat Plate
- 11.1.3. U-Channel
- 11.2. Market Analysis, Insights and Forecast - by Application
- 11.2.1. Building and Construction
- 11.2.2. Electrical and Electronics
- 11.2.3. Food and Beverage
- 11.2.4. Textile
- 11.2.5. Agriculture
- 11.2.6. Automotive
- 11.2.7. Others
- 11.1. Market Analysis, Insights and Forecast - by Design
- 12. North America Linear Motor Market Analysis, Insights and Forecast, 2019-2031
- 12.1. Market Analysis, Insights and Forecast - By Country/Sub-region
- 12.1.1.
- 13. Europe Linear Motor Market Analysis, Insights and Forecast, 2019-2031
- 13.1. Market Analysis, Insights and Forecast - By Country/Sub-region
- 13.1.1.
- 14. Asia Linear Motor Market Analysis, Insights and Forecast, 2019-2031
- 14.1. Market Analysis, Insights and Forecast - By Country/Sub-region
- 14.1.1.
- 15. Australia and New Zealand Linear Motor Market Analysis, Insights and Forecast, 2019-2031
- 15.1. Market Analysis, Insights and Forecast - By Country/Sub-region
- 15.1.1.
- 16. Latin America Linear Motor Market Analysis, Insights and Forecast, 2019-2031
- 16.1. Market Analysis, Insights and Forecast - By Country/Sub-region
- 16.1.1.
- 17. Middle East and Africa Linear Motor Market Analysis, Insights and Forecast, 2019-2031
- 17.1. Market Analysis, Insights and Forecast - By Country/Sub-region
- 17.1.1.
- 18. Competitive Analysis
- 18.1. Global Market Share Analysis 2024
- 18.2. Company Profiles
- 18.2.1 Rockwell Automation
- 18.2.1.1. Overview
- 18.2.1.2. Products
- 18.2.1.3. SWOT Analysis
- 18.2.1.4. Recent Developments
- 18.2.1.5. Financials (Based on Availability)
- 18.2.2 Sinotech Inc
- 18.2.2.1. Overview
- 18.2.2.2. Products
- 18.2.2.3. SWOT Analysis
- 18.2.2.4. Recent Developments
- 18.2.2.5. Financials (Based on Availability)
- 18.2.3 Aerotech Inc
- 18.2.3.1. Overview
- 18.2.3.2. Products
- 18.2.3.3. SWOT Analysis
- 18.2.3.4. Recent Developments
- 18.2.3.5. Financials (Based on Availability)
- 18.2.4 FAULHABER GROUP
- 18.2.4.1. Overview
- 18.2.4.2. Products
- 18.2.4.3. SWOT Analysis
- 18.2.4.4. Recent Developments
- 18.2.4.5. Financials (Based on Availability)
- 18.2.5 Hiwin Corporation
- 18.2.5.1. Overview
- 18.2.5.2. Products
- 18.2.5.3. SWOT Analysis
- 18.2.5.4. Recent Developments
- 18.2.5.5. Financials (Based on Availability)
- 18.2.6 FANUC CORPORATION
- 18.2.6.1. Overview
- 18.2.6.2. Products
- 18.2.6.3. SWOT Analysis
- 18.2.6.4. Recent Developments
- 18.2.6.5. Financials (Based on Availability)
- 18.2.7 ETEL SA
- 18.2.7.1. Overview
- 18.2.7.2. Products
- 18.2.7.3. SWOT Analysis
- 18.2.7.4. Recent Developments
- 18.2.7.5. Financials (Based on Availability)
- 18.2.8 Mitsubishi Electric Corporation
- 18.2.8.1. Overview
- 18.2.8.2. Products
- 18.2.8.3. SWOT Analysis
- 18.2.8.4. Recent Developments
- 18.2.8.5. Financials (Based on Availability)
- 18.2.9 YASKAWA ELECTRIC CORPORATION
- 18.2.9.1. Overview
- 18.2.9.2. Products
- 18.2.9.3. SWOT Analysis
- 18.2.9.4. Recent Developments
- 18.2.9.5. Financials (Based on Availability)
- 18.2.10 Tecnotion
- 18.2.10.1. Overview
- 18.2.10.2. Products
- 18.2.10.3. SWOT Analysis
- 18.2.10.4. Recent Developments
- 18.2.10.5. Financials (Based on Availability)
- 18.2.1 Rockwell Automation
List of Figures
- Figure 1: Global Linear Motor Market Revenue Breakdown (Million, %) by Region 2024 & 2032
- Figure 2: Global Linear Motor Market Volume Breakdown (K Unit, %) by Region 2024 & 2032
- Figure 3: North America Linear Motor Market Revenue (Million), by Country 2024 & 2032
- Figure 4: North America Linear Motor Market Volume (K Unit), by Country 2024 & 2032
- Figure 5: North America Linear Motor Market Revenue Share (%), by Country 2024 & 2032
- Figure 6: North America Linear Motor Market Volume Share (%), by Country 2024 & 2032
- Figure 7: Europe Linear Motor Market Revenue (Million), by Country 2024 & 2032
- Figure 8: Europe Linear Motor Market Volume (K Unit), by Country 2024 & 2032
- Figure 9: Europe Linear Motor Market Revenue Share (%), by Country 2024 & 2032
- Figure 10: Europe Linear Motor Market Volume Share (%), by Country 2024 & 2032
- Figure 11: Asia Linear Motor Market Revenue (Million), by Country 2024 & 2032
- Figure 12: Asia Linear Motor Market Volume (K Unit), by Country 2024 & 2032
- Figure 13: Asia Linear Motor Market Revenue Share (%), by Country 2024 & 2032
- Figure 14: Asia Linear Motor Market Volume Share (%), by Country 2024 & 2032
- Figure 15: Australia and New Zealand Linear Motor Market Revenue (Million), by Country 2024 & 2032
- Figure 16: Australia and New Zealand Linear Motor Market Volume (K Unit), by Country 2024 & 2032
- Figure 17: Australia and New Zealand Linear Motor Market Revenue Share (%), by Country 2024 & 2032
- Figure 18: Australia and New Zealand Linear Motor Market Volume Share (%), by Country 2024 & 2032
- Figure 19: Latin America Linear Motor Market Revenue (Million), by Country 2024 & 2032
- Figure 20: Latin America Linear Motor Market Volume (K Unit), by Country 2024 & 2032
- Figure 21: Latin America Linear Motor Market Revenue Share (%), by Country 2024 & 2032
- Figure 22: Latin America Linear Motor Market Volume Share (%), by Country 2024 & 2032
- Figure 23: Middle East and Africa Linear Motor Market Revenue (Million), by Country 2024 & 2032
- Figure 24: Middle East and Africa Linear Motor Market Volume (K Unit), by Country 2024 & 2032
- Figure 25: Middle East and Africa Linear Motor Market Revenue Share (%), by Country 2024 & 2032
- Figure 26: Middle East and Africa Linear Motor Market Volume Share (%), by Country 2024 & 2032
- Figure 27: North America Linear Motor Market Revenue (Million), by Design 2024 & 2032
- Figure 28: North America Linear Motor Market Volume (K Unit), by Design 2024 & 2032
- Figure 29: North America Linear Motor Market Revenue Share (%), by Design 2024 & 2032
- Figure 30: North America Linear Motor Market Volume Share (%), by Design 2024 & 2032
- Figure 31: North America Linear Motor Market Revenue (Million), by Application 2024 & 2032
- Figure 32: North America Linear Motor Market Volume (K Unit), by Application 2024 & 2032
- Figure 33: North America Linear Motor Market Revenue Share (%), by Application 2024 & 2032
- Figure 34: North America Linear Motor Market Volume Share (%), by Application 2024 & 2032
- Figure 35: North America Linear Motor Market Revenue (Million), by Country 2024 & 2032
- Figure 36: North America Linear Motor Market Volume (K Unit), by Country 2024 & 2032
- Figure 37: North America Linear Motor Market Revenue Share (%), by Country 2024 & 2032
- Figure 38: North America Linear Motor Market Volume Share (%), by Country 2024 & 2032
- Figure 39: Europe Linear Motor Market Revenue (Million), by Design 2024 & 2032
- Figure 40: Europe Linear Motor Market Volume (K Unit), by Design 2024 & 2032
- Figure 41: Europe Linear Motor Market Revenue Share (%), by Design 2024 & 2032
- Figure 42: Europe Linear Motor Market Volume Share (%), by Design 2024 & 2032
- Figure 43: Europe Linear Motor Market Revenue (Million), by Application 2024 & 2032
- Figure 44: Europe Linear Motor Market Volume (K Unit), by Application 2024 & 2032
- Figure 45: Europe Linear Motor Market Revenue Share (%), by Application 2024 & 2032
- Figure 46: Europe Linear Motor Market Volume Share (%), by Application 2024 & 2032
- Figure 47: Europe Linear Motor Market Revenue (Million), by Country 2024 & 2032
- Figure 48: Europe Linear Motor Market Volume (K Unit), by Country 2024 & 2032
- Figure 49: Europe Linear Motor Market Revenue Share (%), by Country 2024 & 2032
- Figure 50: Europe Linear Motor Market Volume Share (%), by Country 2024 & 2032
- Figure 51: Asia Linear Motor Market Revenue (Million), by Design 2024 & 2032
- Figure 52: Asia Linear Motor Market Volume (K Unit), by Design 2024 & 2032
- Figure 53: Asia Linear Motor Market Revenue Share (%), by Design 2024 & 2032
- Figure 54: Asia Linear Motor Market Volume Share (%), by Design 2024 & 2032
- Figure 55: Asia Linear Motor Market Revenue (Million), by Application 2024 & 2032
- Figure 56: Asia Linear Motor Market Volume (K Unit), by Application 2024 & 2032
- Figure 57: Asia Linear Motor Market Revenue Share (%), by Application 2024 & 2032
- Figure 58: Asia Linear Motor Market Volume Share (%), by Application 2024 & 2032
- Figure 59: Asia Linear Motor Market Revenue (Million), by Country 2024 & 2032
- Figure 60: Asia Linear Motor Market Volume (K Unit), by Country 2024 & 2032
- Figure 61: Asia Linear Motor Market Revenue Share (%), by Country 2024 & 2032
- Figure 62: Asia Linear Motor Market Volume Share (%), by Country 2024 & 2032
- Figure 63: Australia and New Zealand Linear Motor Market Revenue (Million), by Design 2024 & 2032
- Figure 64: Australia and New Zealand Linear Motor Market Volume (K Unit), by Design 2024 & 2032
- Figure 65: Australia and New Zealand Linear Motor Market Revenue Share (%), by Design 2024 & 2032
- Figure 66: Australia and New Zealand Linear Motor Market Volume Share (%), by Design 2024 & 2032
- Figure 67: Australia and New Zealand Linear Motor Market Revenue (Million), by Application 2024 & 2032
- Figure 68: Australia and New Zealand Linear Motor Market Volume (K Unit), by Application 2024 & 2032
- Figure 69: Australia and New Zealand Linear Motor Market Revenue Share (%), by Application 2024 & 2032
- Figure 70: Australia and New Zealand Linear Motor Market Volume Share (%), by Application 2024 & 2032
- Figure 71: Australia and New Zealand Linear Motor Market Revenue (Million), by Country 2024 & 2032
- Figure 72: Australia and New Zealand Linear Motor Market Volume (K Unit), by Country 2024 & 2032
- Figure 73: Australia and New Zealand Linear Motor Market Revenue Share (%), by Country 2024 & 2032
- Figure 74: Australia and New Zealand Linear Motor Market Volume Share (%), by Country 2024 & 2032
- Figure 75: Latin America Linear Motor Market Revenue (Million), by Design 2024 & 2032
- Figure 76: Latin America Linear Motor Market Volume (K Unit), by Design 2024 & 2032
- Figure 77: Latin America Linear Motor Market Revenue Share (%), by Design 2024 & 2032
- Figure 78: Latin America Linear Motor Market Volume Share (%), by Design 2024 & 2032
- Figure 79: Latin America Linear Motor Market Revenue (Million), by Application 2024 & 2032
- Figure 80: Latin America Linear Motor Market Volume (K Unit), by Application 2024 & 2032
- Figure 81: Latin America Linear Motor Market Revenue Share (%), by Application 2024 & 2032
- Figure 82: Latin America Linear Motor Market Volume Share (%), by Application 2024 & 2032
- Figure 83: Latin America Linear Motor Market Revenue (Million), by Country 2024 & 2032
- Figure 84: Latin America Linear Motor Market Volume (K Unit), by Country 2024 & 2032
- Figure 85: Latin America Linear Motor Market Revenue Share (%), by Country 2024 & 2032
- Figure 86: Latin America Linear Motor Market Volume Share (%), by Country 2024 & 2032
- Figure 87: Middle East and Africa Linear Motor Market Revenue (Million), by Design 2024 & 2032
- Figure 88: Middle East and Africa Linear Motor Market Volume (K Unit), by Design 2024 & 2032
- Figure 89: Middle East and Africa Linear Motor Market Revenue Share (%), by Design 2024 & 2032
- Figure 90: Middle East and Africa Linear Motor Market Volume Share (%), by Design 2024 & 2032
- Figure 91: Middle East and Africa Linear Motor Market Revenue (Million), by Application 2024 & 2032
- Figure 92: Middle East and Africa Linear Motor Market Volume (K Unit), by Application 2024 & 2032
- Figure 93: Middle East and Africa Linear Motor Market Revenue Share (%), by Application 2024 & 2032
- Figure 94: Middle East and Africa Linear Motor Market Volume Share (%), by Application 2024 & 2032
- Figure 95: Middle East and Africa Linear Motor Market Revenue (Million), by Country 2024 & 2032
- Figure 96: Middle East and Africa Linear Motor Market Volume (K Unit), by Country 2024 & 2032
- Figure 97: Middle East and Africa Linear Motor Market Revenue Share (%), by Country 2024 & 2032
- Figure 98: Middle East and Africa Linear Motor Market Volume Share (%), by Country 2024 & 2032
List of Tables
- Table 1: Global Linear Motor Market Revenue Million Forecast, by Region 2019 & 2032
- Table 2: Global Linear Motor Market Volume K Unit Forecast, by Region 2019 & 2032
- Table 3: Global Linear Motor Market Revenue Million Forecast, by Design 2019 & 2032
- Table 4: Global Linear Motor Market Volume K Unit Forecast, by Design 2019 & 2032
- Table 5: Global Linear Motor Market Revenue Million Forecast, by Application 2019 & 2032
- Table 6: Global Linear Motor Market Volume K Unit Forecast, by Application 2019 & 2032
- Table 7: Global Linear Motor Market Revenue Million Forecast, by Region 2019 & 2032
- Table 8: Global Linear Motor Market Volume K Unit Forecast, by Region 2019 & 2032
- Table 9: Global Linear Motor Market Revenue Million Forecast, by Country 2019 & 2032
- Table 10: Global Linear Motor Market Volume K Unit Forecast, by Country 2019 & 2032
- Table 11: Linear Motor Market Revenue (Million) Forecast, by Application 2019 & 2032
- Table 12: Linear Motor Market Volume (K Unit) Forecast, by Application 2019 & 2032
- Table 13: Global Linear Motor Market Revenue Million Forecast, by Country 2019 & 2032
- Table 14: Global Linear Motor Market Volume K Unit Forecast, by Country 2019 & 2032
- Table 15: Linear Motor Market Revenue (Million) Forecast, by Application 2019 & 2032
- Table 16: Linear Motor Market Volume (K Unit) Forecast, by Application 2019 & 2032
- Table 17: Global Linear Motor Market Revenue Million Forecast, by Country 2019 & 2032
- Table 18: Global Linear Motor Market Volume K Unit Forecast, by Country 2019 & 2032
- Table 19: Linear Motor Market Revenue (Million) Forecast, by Application 2019 & 2032
- Table 20: Linear Motor Market Volume (K Unit) Forecast, by Application 2019 & 2032
- Table 21: Global Linear Motor Market Revenue Million Forecast, by Country 2019 & 2032
- Table 22: Global Linear Motor Market Volume K Unit Forecast, by Country 2019 & 2032
- Table 23: Linear Motor Market Revenue (Million) Forecast, by Application 2019 & 2032
- Table 24: Linear Motor Market Volume (K Unit) Forecast, by Application 2019 & 2032
- Table 25: Global Linear Motor Market Revenue Million Forecast, by Country 2019 & 2032
- Table 26: Global Linear Motor Market Volume K Unit Forecast, by Country 2019 & 2032
- Table 27: Linear Motor Market Revenue (Million) Forecast, by Application 2019 & 2032
- Table 28: Linear Motor Market Volume (K Unit) Forecast, by Application 2019 & 2032
- Table 29: Global Linear Motor Market Revenue Million Forecast, by Country 2019 & 2032
- Table 30: Global Linear Motor Market Volume K Unit Forecast, by Country 2019 & 2032
- Table 31: Linear Motor Market Revenue (Million) Forecast, by Application 2019 & 2032
- Table 32: Linear Motor Market Volume (K Unit) Forecast, by Application 2019 & 2032
- Table 33: Global Linear Motor Market Revenue Million Forecast, by Design 2019 & 2032
- Table 34: Global Linear Motor Market Volume K Unit Forecast, by Design 2019 & 2032
- Table 35: Global Linear Motor Market Revenue Million Forecast, by Application 2019 & 2032
- Table 36: Global Linear Motor Market Volume K Unit Forecast, by Application 2019 & 2032
- Table 37: Global Linear Motor Market Revenue Million Forecast, by Country 2019 & 2032
- Table 38: Global Linear Motor Market Volume K Unit Forecast, by Country 2019 & 2032
- Table 39: Global Linear Motor Market Revenue Million Forecast, by Design 2019 & 2032
- Table 40: Global Linear Motor Market Volume K Unit Forecast, by Design 2019 & 2032
- Table 41: Global Linear Motor Market Revenue Million Forecast, by Application 2019 & 2032
- Table 42: Global Linear Motor Market Volume K Unit Forecast, by Application 2019 & 2032
- Table 43: Global Linear Motor Market Revenue Million Forecast, by Country 2019 & 2032
- Table 44: Global Linear Motor Market Volume K Unit Forecast, by Country 2019 & 2032
- Table 45: Global Linear Motor Market Revenue Million Forecast, by Design 2019 & 2032
- Table 46: Global Linear Motor Market Volume K Unit Forecast, by Design 2019 & 2032
- Table 47: Global Linear Motor Market Revenue Million Forecast, by Application 2019 & 2032
- Table 48: Global Linear Motor Market Volume K Unit Forecast, by Application 2019 & 2032
- Table 49: Global Linear Motor Market Revenue Million Forecast, by Country 2019 & 2032
- Table 50: Global Linear Motor Market Volume K Unit Forecast, by Country 2019 & 2032
- Table 51: Global Linear Motor Market Revenue Million Forecast, by Design 2019 & 2032
- Table 52: Global Linear Motor Market Volume K Unit Forecast, by Design 2019 & 2032
- Table 53: Global Linear Motor Market Revenue Million Forecast, by Application 2019 & 2032
- Table 54: Global Linear Motor Market Volume K Unit Forecast, by Application 2019 & 2032
- Table 55: Global Linear Motor Market Revenue Million Forecast, by Country 2019 & 2032
- Table 56: Global Linear Motor Market Volume K Unit Forecast, by Country 2019 & 2032
- Table 57: Global Linear Motor Market Revenue Million Forecast, by Design 2019 & 2032
- Table 58: Global Linear Motor Market Volume K Unit Forecast, by Design 2019 & 2032
- Table 59: Global Linear Motor Market Revenue Million Forecast, by Application 2019 & 2032
- Table 60: Global Linear Motor Market Volume K Unit Forecast, by Application 2019 & 2032
- Table 61: Global Linear Motor Market Revenue Million Forecast, by Country 2019 & 2032
- Table 62: Global Linear Motor Market Volume K Unit Forecast, by Country 2019 & 2032
- Table 63: Global Linear Motor Market Revenue Million Forecast, by Design 2019 & 2032
- Table 64: Global Linear Motor Market Volume K Unit Forecast, by Design 2019 & 2032
- Table 65: Global Linear Motor Market Revenue Million Forecast, by Application 2019 & 2032
- Table 66: Global Linear Motor Market Volume K Unit Forecast, by Application 2019 & 2032
- Table 67: Global Linear Motor Market Revenue Million Forecast, by Country 2019 & 2032
- Table 68: Global Linear Motor Market Volume K Unit Forecast, by Country 2019 & 2032
Frequently Asked Questions
1. What is the projected Compound Annual Growth Rate (CAGR) of the Linear Motor Market?
The projected CAGR is approximately 5.49%.
2. Which companies are prominent players in the Linear Motor Market?
Key companies in the market include Rockwell Automation, Sinotech Inc, Aerotech Inc, FAULHABER GROUP, Hiwin Corporation, FANUC CORPORATION, ETEL SA, Mitsubishi Electric Corporation, YASKAWA ELECTRIC CORPORATION , Tecnotion.
3. What are the main segments of the Linear Motor Market?
The market segments include Design, Application.
4. Can you provide details about the market size?
The market size is estimated to be USD 1.98 Million as of 2022.
5. What are some drivers contributing to market growth?
Rising Industrial Automation is fuelling the demand for linear motors; Growing demand for high performance linear motor in the semiconductor industry.
6. What are the notable trends driving market growth?
Optimum Control Characteristics of Linear Motors to Propel the Growth of the Market Studied.
7. Are there any restraints impacting market growth?
High Initial Investment; Increased power consumption for high load applications.
8. Can you provide examples of recent developments in the market?
February 2023 - Faulhaber, a leading precision miniature and micro drive system supplier, launched its new compact linear actuator for various applications. The linear actuator L series can be combined with a range of DC motors, brushless motors, or stepper motors to leverage the torque and speed range best. The smaller versions, 6 L, 8 L, and 10 L, are ideal for medical applications. The all-new series provides high performances in compact dimensions and supports considerable input speed or high output force.
9. What pricing options are available for accessing the report?
Pricing options include single-user, multi-user, and enterprise licenses priced at USD 4750, USD 5250, and USD 8750 respectively.
10. Is the market size provided in terms of value or volume?
The market size is provided in terms of value, measured in Million and volume, measured in K Unit.
11. Are there any specific market keywords associated with the report?
Yes, the market keyword associated with the report is "Linear Motor Market," which aids in identifying and referencing the specific market segment covered.
12. How do I determine which pricing option suits my needs best?
The pricing options vary based on user requirements and access needs. Individual users may opt for single-user licenses, while businesses requiring broader access may choose multi-user or enterprise licenses for cost-effective access to the report.
13. Are there any additional resources or data provided in the Linear Motor Market report?
While the report offers comprehensive insights, it's advisable to review the specific contents or supplementary materials provided to ascertain if additional resources or data are available.
14. How can I stay updated on further developments or reports in the Linear Motor Market?
To stay informed about further developments, trends, and reports in the Linear Motor Market, consider subscribing to industry newsletters, following relevant companies and organizations, or regularly checking reputable industry news sources and publications.
Methodology
Step 1 - Identification of Relevant Samples Size from Population Database


Step 2 - Approaches for Defining Global Market Size (Value, Volume* & Price*)

Note*: In applicable scenarios
Step 3 - Data Sources
Primary Research
- Web Analytics
- Survey Reports
- Research Institute
- Latest Research Reports
- Opinion Leaders
Secondary Research
- Annual Reports
- White Paper
- Latest Press Release
- Industry Association
- Paid Database
- Investor Presentations

Step 4 - Data Triangulation
Involves using different sources of information in order to increase the validity of a study
These sources are likely to be stakeholders in a program - participants, other researchers, program staff, other community members, and so on.
Then we put all data in single framework & apply various statistical tools to find out the dynamic on the market.
During the analysis stage, feedback from the stakeholder groups would be compared to determine areas of agreement as well as areas of divergence


