
Key Insights
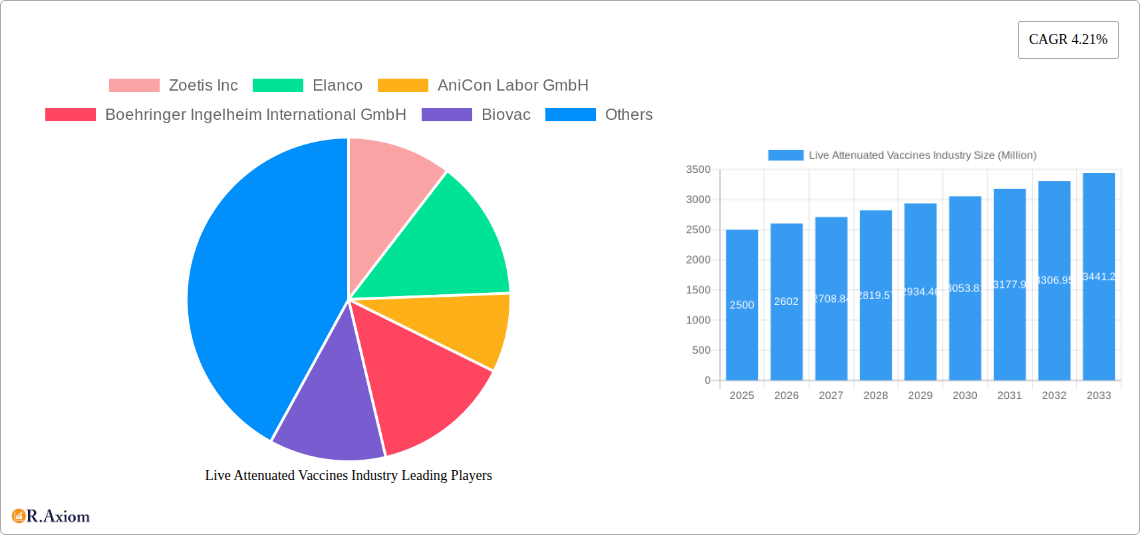
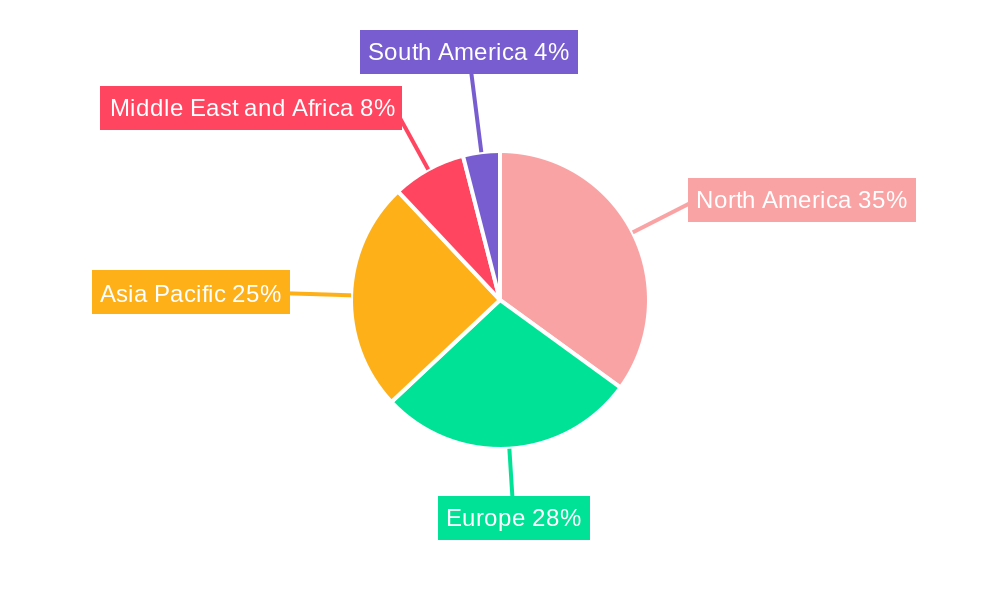
The global live attenuated vaccines market, a significant segment within the broader animal vaccine industry, is poised for robust growth. Driven by increasing demand for animal protein globally, rising awareness of animal health, and the proactive prevention of zoonotic diseases, the market is projected to expand significantly over the forecast period (2025-2033). While precise figures for individual product types within live attenuated vaccines are unavailable, the overall market size of $5.88 billion in 2025 (as indicated) suggests a substantial contribution from live attenuated vaccines, considering their prevalence and effectiveness. Factors such as increasing investments in R&D for advanced vaccine formulations, coupled with the growing adoption of preventative healthcare strategies in livestock farming, further fuel market expansion. Technological advancements leading to improved efficacy, safety, and ease of administration are also contributing factors. Competition among key players like Zoetis, Elanco, and Boehringer Ingelheim, characterized by ongoing innovation and strategic partnerships, shapes the competitive landscape. The market's growth, however, may face challenges from regulatory hurdles related to vaccine approvals and potential fluctuations in raw material prices. Regional variations in market growth are anticipated, with North America and Europe possibly exhibiting relatively higher growth compared to other regions, due to established infrastructure and higher per-capita animal healthcare expenditure.
The market segmentation by product type (bovine, poultry, porcine, etc.) and technology (live attenuated, inactivated, etc.) reveals a diverse market structure. Poultry and bovine vaccines likely hold the largest market shares due to the scale of poultry and cattle farming globally. The segment of live attenuated vaccines will benefit from advancements in vaccine technology resulting in enhanced safety profiles and efficacy, making them increasingly preferred among farmers. Geographic expansion, especially in developing economies with burgeoning livestock industries, presents lucrative opportunities for market players. While challenges exist, the market's overall trajectory indicates substantial growth prospects for stakeholders invested in the development, manufacturing, and distribution of live attenuated animal vaccines. Continuous monitoring of disease outbreaks, evolving consumer preferences, and regulatory shifts will be crucial for navigating the dynamics of this expanding market.
Live Attenuated Vaccines Industry: A Comprehensive Market Report (2019-2033)
This detailed report provides a comprehensive analysis of the Live Attenuated Vaccines industry, covering market size, segmentation, growth drivers, challenges, and future outlook. The report utilizes data from the historical period (2019-2024), the base year (2025), and projects the market's trajectory through the forecast period (2025-2033). The study period encompasses 2019-2033. All financial values are expressed in Millions.
Live Attenuated Vaccines Industry Market Concentration & Innovation
The Live Attenuated Vaccines market exhibits a moderately concentrated landscape, with key players such as Zoetis Inc, Elanco, and Merck & Co holding significant market share. Precise market share figures for each company are unavailable for this report (xx%), but their substantial investments in R&D and global presence indicate dominance. The industry's innovation is driven by the continuous need for improved vaccine efficacy, safety, and cost-effectiveness. Regulatory frameworks, varying across different geographies, significantly influence product development and market entry.
- Innovation Drivers: Emerging infectious diseases, increasing demand for animal health products, and technological advancements in vaccine development fuel innovation.
- Regulatory Frameworks: Stringent regulatory approvals increase development costs and time-to-market but ensure safety and efficacy.
- Product Substitutes: Inactivated vaccines and recombinant vaccines pose competitive pressure, influencing market share dynamics.
- End-User Trends: Growing awareness of animal health and disease prevention among livestock farmers drives demand for effective vaccines.
- M&A Activities: The industry witnesses sporadic M&A activities, primarily focused on expanding product portfolios and geographical reach. The overall value of M&A deals in the last five years is estimated at xx Million.
Live Attenuated Vaccines Industry Industry Trends & Insights
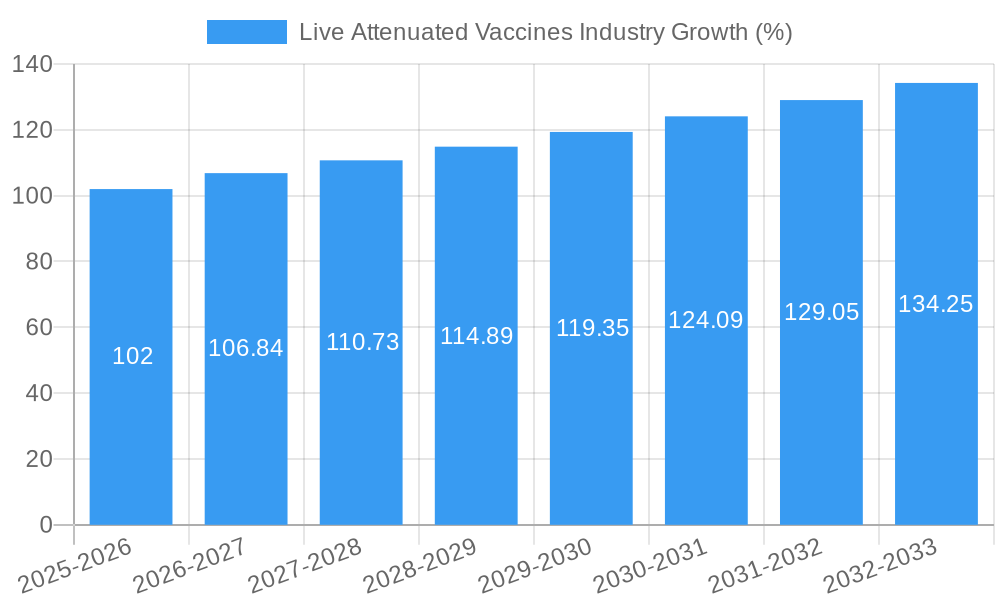
The Live Attenuated Vaccines industry is experiencing robust growth, with a projected Compound Annual Growth Rate (CAGR) of xx% during the forecast period (2025-2033). This growth is attributed to several factors: rising livestock populations globally, increasing prevalence of animal diseases, and government initiatives promoting animal health. Technological advancements, such as improved vaccine formulations and delivery systems, further enhance market penetration. Consumer preferences are shifting towards safer and more effective vaccines, leading to greater demand for innovative products. Competitive dynamics are intense, with companies focusing on product differentiation, brand building, and strategic partnerships. Market penetration of live attenuated vaccines within the total animal vaccine market is approximately xx%.
Dominant Markets & Segments in Live Attenuated Vaccines Industry
The global Live Attenuated Vaccines market is geographically diverse, but certain regions show stronger dominance. Asia-Pacific, driven by burgeoning livestock populations and increasing government investment in animal health, holds the largest market share, followed by North America and Europe.
Dominant Segments:
- Product Type: Poultry Vaccines command the largest market share, driven by the high density of poultry farming and susceptibility of birds to various infections. Bovine vaccines follow closely, with consistent demand from the beef and dairy industry.
- Technology: Live attenuated vaccines constitute a majority segment, favored for their strong immunogenicity and cost-effectiveness, although inactivated vaccines are gaining ground due to concerns about reversion to virulence.
Key Drivers for Dominant Segments:
- Poultry Vaccine: High poultry density, frequent outbreaks of avian diseases, and stringent biosecurity measures drive demand.
- Bovine Vaccine: Large-scale cattle farming, frequent occurrences of bovine-specific diseases (e.g., lumpy skin disease), and high economic value of cattle necessitate robust vaccination programs.
- Economic Policies: Government subsidies and support for animal health initiatives fuel market growth in several regions.
- Infrastructure: Improved cold chain infrastructure supporting vaccine storage and distribution is crucial for market penetration, particularly in developing economies.
Live Attenuated Vaccines Industry Product Developments
Recent product innovations focus on improved vaccine efficacy, stability, and ease of administration. Novel delivery systems, such as thermostable vaccines, address challenges in remote areas with limited cold chain infrastructure. The development of multivalent vaccines providing protection against multiple pathogens in a single dose is gaining traction, improving cost-effectiveness and simplifying vaccination programs. These advancements enhance market fit by addressing critical needs of end-users, particularly in developing countries.
Report Scope & Segmentation Analysis
This report comprehensively analyzes the Live Attenuated Vaccines industry across various segments:
- Product Type: Bovine Vaccine, Poultry Vaccine, Porcine Vaccine, Other Livestock Vaccines (xx Million Market Size in 2025, xx% CAGR).
- Technology: Live Attenuated Vaccine, Inactivated Vaccine, Toxoid Vaccine, Recombinant Vaccine, Other Technologies (xx Million Market Size in 2025, xx% CAGR).
Each segment is analyzed based on market size, growth projections, and competitive dynamics. The report provides detailed insights into the factors influencing the growth and market share of each segment. Competitive dynamics vary across segments, with some being more consolidated than others.
Key Drivers of Live Attenuated Vaccines Industry Growth
Several factors contribute to the growth of the Live Attenuated Vaccines industry. Firstly, the increasing prevalence of animal diseases necessitates robust vaccination programs. Secondly, growing livestock populations globally increase demand for vaccines. Thirdly, government initiatives promoting animal health and providing incentives for vaccination drive market expansion. Technological advancements, such as the development of thermostable vaccines and improved delivery systems, further fuel market growth.
Challenges in the Live Attenuated Vaccines Industry Sector
The Live Attenuated Vaccines industry faces challenges, including stringent regulatory approvals which increase development costs and time-to-market. Supply chain disruptions can significantly impact vaccine availability and affordability. Furthermore, competition among established players and the emergence of new entrants increase pressure on pricing and market share. These factors can collectively affect market expansion and growth.
Emerging Opportunities in Live Attenuated Vaccines Industry
Emerging opportunities include expansion into new markets, particularly in developing countries with growing livestock populations. The development of next-generation vaccines using advanced technologies like mRNA and CRISPR-Cas9 systems offers significant potential. Growing demand for sustainable and environmentally friendly vaccines presents further opportunities for innovation. Furthermore, personalized vaccines catering to specific pathogens and animal breeds are expected to drive future market growth.
Leading Players in the Live Attenuated Vaccines Industry Market
- Zoetis Inc
- Elanco
- AniCon Labor GmbH
- Boehringer Ingelheim International GmbH
- Biovac
- Animal Science Products Inc
- ADL BIONATUR SOLUTIONS S A
- Phibro Animal Health Corporation
- Ceva Sante Animale
- Merck & Co
Key Developments in Live Attenuated Vaccines Industry Industry
- August 2022: The SRTF's agriculture project in Northern Aleppo received a third batch of livestock vaccines, benefiting an estimated 57,500 families.
- August 2022: Haryana, India, implemented a mass vaccination campaign for cattle to combat lumpy skin disease, restricting cattle movement and fairs. These events highlight the importance of vaccination programs in controlling disease outbreaks and protecting livestock populations.
Strategic Outlook for Live Attenuated Vaccines Industry Market
The Live Attenuated Vaccines industry presents significant growth potential, driven by technological advancements, expanding livestock populations, and increasing awareness of animal health. Focus on innovation, particularly in developing thermostable and multivalent vaccines, will be key to market success. Strategic partnerships and collaborations will be crucial for expanding market reach and improving access to vaccines in underserved areas. The market is poised for continued growth, fueled by these factors and the ongoing efforts to control animal diseases globally.
Live Attenuated Vaccines Industry Segmentation
-
1. Product Type
- 1.1. Bovine Vaccine
- 1.2. Poultry Vaccine
- 1.3. Porcine Vaccine
- 1.4. Other Livestock Vaccines
-
2. Technology
- 2.1. Live Attenuated Vaccine
- 2.2. Inactivated Vaccine
- 2.3. Toxoid Vaccine
- 2.4. Recombinant Vaccine
- 2.5. Other Technologies
Live Attenuated Vaccines Industry Segmentation By Geography
-
1. North America
- 1.1. United States
- 1.2. Canada
- 1.3. Mexico
-
2. Europe
- 2.1. Germany
- 2.2. United Kingdom
- 2.3. France
- 2.4. Italy
- 2.5. Spain
- 2.6. Rest of Europe
-
3. Asia Pacific
- 3.1. China
- 3.2. Japan
- 3.3. India
- 3.4. Australia
- 3.5. South Korea
- 3.6. Rest of Asia Pacific
-
4. Middle East and Africa
- 4.1. GCC
- 4.2. South Africa
- 4.3. Rest of Middle East and Africa
-
5. South America
- 5.1. Brazil
- 5.2. Argentina
- 5.3. Rest of South America
Live Attenuated Vaccines Industry REPORT HIGHLIGHTS
| Aspects | Details |
|---|---|
| Study Period | 2019-2033 |
| Base Year | 2024 |
| Estimated Year | 2025 |
| Forecast Period | 2025-2033 |
| Historical Period | 2019-2024 |
| Growth Rate | CAGR of 4.21% from 2019-2033 |
| Segmentation |
|
Table of Contents
- 1. Introduction
- 1.1. Research Scope
- 1.2. Market Segmentation
- 1.3. Research Methodology
- 1.4. Definitions and Assumptions
- 2. Executive Summary
- 2.1. Introduction
- 3. Market Dynamics
- 3.1. Introduction
- 3.2. Market Drivers
- 3.2.1 Increasing Incidences of Zoonotic Diseases; Initiatives Taken by Various Government Agencies
- 3.2.2 Animal Associations
- 3.2.3 and Leading Players; Widened Focus on Food Safety
- 3.3. Market Restrains
- 3.3.1. Lack of Veterinarians and Shortage of Skilled Farm Workers; High Storage Costs for Vaccines
- 3.4. Market Trends
- 3.4.1. Poultry Vaccine is Expected to Cover a Large Share of the Livestock Vaccines Market
- 4. Market Factor Analysis
- 4.1. Porters Five Forces
- 4.2. Supply/Value Chain
- 4.3. PESTEL analysis
- 4.4. Market Entropy
- 4.5. Patent/Trademark Analysis
- 5. Global Live Attenuated Vaccines Industry Analysis, Insights and Forecast, 2019-2031
- 5.1. Market Analysis, Insights and Forecast - by Product Type
- 5.1.1. Bovine Vaccine
- 5.1.2. Poultry Vaccine
- 5.1.3. Porcine Vaccine
- 5.1.4. Other Livestock Vaccines
- 5.2. Market Analysis, Insights and Forecast - by Technology
- 5.2.1. Live Attenuated Vaccine
- 5.2.2. Inactivated Vaccine
- 5.2.3. Toxoid Vaccine
- 5.2.4. Recombinant Vaccine
- 5.2.5. Other Technologies
- 5.3. Market Analysis, Insights and Forecast - by Region
- 5.3.1. North America
- 5.3.2. Europe
- 5.3.3. Asia Pacific
- 5.3.4. Middle East and Africa
- 5.3.5. South America
- 5.1. Market Analysis, Insights and Forecast - by Product Type
- 6. North America Live Attenuated Vaccines Industry Analysis, Insights and Forecast, 2019-2031
- 6.1. Market Analysis, Insights and Forecast - by Product Type
- 6.1.1. Bovine Vaccine
- 6.1.2. Poultry Vaccine
- 6.1.3. Porcine Vaccine
- 6.1.4. Other Livestock Vaccines
- 6.2. Market Analysis, Insights and Forecast - by Technology
- 6.2.1. Live Attenuated Vaccine
- 6.2.2. Inactivated Vaccine
- 6.2.3. Toxoid Vaccine
- 6.2.4. Recombinant Vaccine
- 6.2.5. Other Technologies
- 6.1. Market Analysis, Insights and Forecast - by Product Type
- 7. Europe Live Attenuated Vaccines Industry Analysis, Insights and Forecast, 2019-2031
- 7.1. Market Analysis, Insights and Forecast - by Product Type
- 7.1.1. Bovine Vaccine
- 7.1.2. Poultry Vaccine
- 7.1.3. Porcine Vaccine
- 7.1.4. Other Livestock Vaccines
- 7.2. Market Analysis, Insights and Forecast - by Technology
- 7.2.1. Live Attenuated Vaccine
- 7.2.2. Inactivated Vaccine
- 7.2.3. Toxoid Vaccine
- 7.2.4. Recombinant Vaccine
- 7.2.5. Other Technologies
- 7.1. Market Analysis, Insights and Forecast - by Product Type
- 8. Asia Pacific Live Attenuated Vaccines Industry Analysis, Insights and Forecast, 2019-2031
- 8.1. Market Analysis, Insights and Forecast - by Product Type
- 8.1.1. Bovine Vaccine
- 8.1.2. Poultry Vaccine
- 8.1.3. Porcine Vaccine
- 8.1.4. Other Livestock Vaccines
- 8.2. Market Analysis, Insights and Forecast - by Technology
- 8.2.1. Live Attenuated Vaccine
- 8.2.2. Inactivated Vaccine
- 8.2.3. Toxoid Vaccine
- 8.2.4. Recombinant Vaccine
- 8.2.5. Other Technologies
- 8.1. Market Analysis, Insights and Forecast - by Product Type
- 9. Middle East and Africa Live Attenuated Vaccines Industry Analysis, Insights and Forecast, 2019-2031
- 9.1. Market Analysis, Insights and Forecast - by Product Type
- 9.1.1. Bovine Vaccine
- 9.1.2. Poultry Vaccine
- 9.1.3. Porcine Vaccine
- 9.1.4. Other Livestock Vaccines
- 9.2. Market Analysis, Insights and Forecast - by Technology
- 9.2.1. Live Attenuated Vaccine
- 9.2.2. Inactivated Vaccine
- 9.2.3. Toxoid Vaccine
- 9.2.4. Recombinant Vaccine
- 9.2.5. Other Technologies
- 9.1. Market Analysis, Insights and Forecast - by Product Type
- 10. South America Live Attenuated Vaccines Industry Analysis, Insights and Forecast, 2019-2031
- 10.1. Market Analysis, Insights and Forecast - by Product Type
- 10.1.1. Bovine Vaccine
- 10.1.2. Poultry Vaccine
- 10.1.3. Porcine Vaccine
- 10.1.4. Other Livestock Vaccines
- 10.2. Market Analysis, Insights and Forecast - by Technology
- 10.2.1. Live Attenuated Vaccine
- 10.2.2. Inactivated Vaccine
- 10.2.3. Toxoid Vaccine
- 10.2.4. Recombinant Vaccine
- 10.2.5. Other Technologies
- 10.1. Market Analysis, Insights and Forecast - by Product Type
- 11. North America Live Attenuated Vaccines Industry Analysis, Insights and Forecast, 2019-2031
- 11.1. Market Analysis, Insights and Forecast - By Country/Sub-region
- 11.1.1. undefined
- 12. Europe Live Attenuated Vaccines Industry Analysis, Insights and Forecast, 2019-2031
- 12.1. Market Analysis, Insights and Forecast - By Country/Sub-region
- 12.1.1. undefined
- 13. Asia Pacific Live Attenuated Vaccines Industry Analysis, Insights and Forecast, 2019-2031
- 13.1. Market Analysis, Insights and Forecast - By Country/Sub-region
- 13.1.1. undefined
- 14. Middle East and Africa Live Attenuated Vaccines Industry Analysis, Insights and Forecast, 2019-2031
- 14.1. Market Analysis, Insights and Forecast - By Country/Sub-region
- 14.1.1. undefined
- 15. South America Live Attenuated Vaccines Industry Analysis, Insights and Forecast, 2019-2031
- 15.1. Market Analysis, Insights and Forecast - By Country/Sub-region
- 15.1.1. undefined
- 16. Competitive Analysis
- 16.1. Global Market Share Analysis 2024
- 16.2. Company Profiles
- 16.2.1 Zoetis Inc
- 16.2.1.1. Overview
- 16.2.1.2. Products
- 16.2.1.3. SWOT Analysis
- 16.2.1.4. Recent Developments
- 16.2.1.5. Financials (Based on Availability)
- 16.2.2 Elanco
- 16.2.2.1. Overview
- 16.2.2.2. Products
- 16.2.2.3. SWOT Analysis
- 16.2.2.4. Recent Developments
- 16.2.2.5. Financials (Based on Availability)
- 16.2.3 AniCon Labor GmbH
- 16.2.3.1. Overview
- 16.2.3.2. Products
- 16.2.3.3. SWOT Analysis
- 16.2.3.4. Recent Developments
- 16.2.3.5. Financials (Based on Availability)
- 16.2.4 Boehringer Ingelheim International GmbH
- 16.2.4.1. Overview
- 16.2.4.2. Products
- 16.2.4.3. SWOT Analysis
- 16.2.4.4. Recent Developments
- 16.2.4.5. Financials (Based on Availability)
- 16.2.5 Biovac
- 16.2.5.1. Overview
- 16.2.5.2. Products
- 16.2.5.3. SWOT Analysis
- 16.2.5.4. Recent Developments
- 16.2.5.5. Financials (Based on Availability)
- 16.2.6 Animal Science Products Inc
- 16.2.6.1. Overview
- 16.2.6.2. Products
- 16.2.6.3. SWOT Analysis
- 16.2.6.4. Recent Developments
- 16.2.6.5. Financials (Based on Availability)
- 16.2.7 ADL BIONATUR SOLUTIONS S A
- 16.2.7.1. Overview
- 16.2.7.2. Products
- 16.2.7.3. SWOT Analysis
- 16.2.7.4. Recent Developments
- 16.2.7.5. Financials (Based on Availability)
- 16.2.8 Phibro Animal Health Corporation
- 16.2.8.1. Overview
- 16.2.8.2. Products
- 16.2.8.3. SWOT Analysis
- 16.2.8.4. Recent Developments
- 16.2.8.5. Financials (Based on Availability)
- 16.2.9 Ceva Sante Animale
- 16.2.9.1. Overview
- 16.2.9.2. Products
- 16.2.9.3. SWOT Analysis
- 16.2.9.4. Recent Developments
- 16.2.9.5. Financials (Based on Availability)
- 16.2.10 Merck & Co
- 16.2.10.1. Overview
- 16.2.10.2. Products
- 16.2.10.3. SWOT Analysis
- 16.2.10.4. Recent Developments
- 16.2.10.5. Financials (Based on Availability)
- 16.2.1 Zoetis Inc
List of Figures
- Figure 1: Global Live Attenuated Vaccines Industry Revenue Breakdown (Million, %) by Region 2024 & 2032
- Figure 2: Global Live Attenuated Vaccines Industry Volume Breakdown (K Unit, %) by Region 2024 & 2032
- Figure 3: North America Live Attenuated Vaccines Industry Revenue (Million), by Country 2024 & 2032
- Figure 4: North America Live Attenuated Vaccines Industry Volume (K Unit), by Country 2024 & 2032
- Figure 5: North America Live Attenuated Vaccines Industry Revenue Share (%), by Country 2024 & 2032
- Figure 6: North America Live Attenuated Vaccines Industry Volume Share (%), by Country 2024 & 2032
- Figure 7: Europe Live Attenuated Vaccines Industry Revenue (Million), by Country 2024 & 2032
- Figure 8: Europe Live Attenuated Vaccines Industry Volume (K Unit), by Country 2024 & 2032
- Figure 9: Europe Live Attenuated Vaccines Industry Revenue Share (%), by Country 2024 & 2032
- Figure 10: Europe Live Attenuated Vaccines Industry Volume Share (%), by Country 2024 & 2032
- Figure 11: Asia Pacific Live Attenuated Vaccines Industry Revenue (Million), by Country 2024 & 2032
- Figure 12: Asia Pacific Live Attenuated Vaccines Industry Volume (K Unit), by Country 2024 & 2032
- Figure 13: Asia Pacific Live Attenuated Vaccines Industry Revenue Share (%), by Country 2024 & 2032
- Figure 14: Asia Pacific Live Attenuated Vaccines Industry Volume Share (%), by Country 2024 & 2032
- Figure 15: Middle East and Africa Live Attenuated Vaccines Industry Revenue (Million), by Country 2024 & 2032
- Figure 16: Middle East and Africa Live Attenuated Vaccines Industry Volume (K Unit), by Country 2024 & 2032
- Figure 17: Middle East and Africa Live Attenuated Vaccines Industry Revenue Share (%), by Country 2024 & 2032
- Figure 18: Middle East and Africa Live Attenuated Vaccines Industry Volume Share (%), by Country 2024 & 2032
- Figure 19: South America Live Attenuated Vaccines Industry Revenue (Million), by Country 2024 & 2032
- Figure 20: South America Live Attenuated Vaccines Industry Volume (K Unit), by Country 2024 & 2032
- Figure 21: South America Live Attenuated Vaccines Industry Revenue Share (%), by Country 2024 & 2032
- Figure 22: South America Live Attenuated Vaccines Industry Volume Share (%), by Country 2024 & 2032
- Figure 23: North America Live Attenuated Vaccines Industry Revenue (Million), by Product Type 2024 & 2032
- Figure 24: North America Live Attenuated Vaccines Industry Volume (K Unit), by Product Type 2024 & 2032
- Figure 25: North America Live Attenuated Vaccines Industry Revenue Share (%), by Product Type 2024 & 2032
- Figure 26: North America Live Attenuated Vaccines Industry Volume Share (%), by Product Type 2024 & 2032
- Figure 27: North America Live Attenuated Vaccines Industry Revenue (Million), by Technology 2024 & 2032
- Figure 28: North America Live Attenuated Vaccines Industry Volume (K Unit), by Technology 2024 & 2032
- Figure 29: North America Live Attenuated Vaccines Industry Revenue Share (%), by Technology 2024 & 2032
- Figure 30: North America Live Attenuated Vaccines Industry Volume Share (%), by Technology 2024 & 2032
- Figure 31: North America Live Attenuated Vaccines Industry Revenue (Million), by Country 2024 & 2032
- Figure 32: North America Live Attenuated Vaccines Industry Volume (K Unit), by Country 2024 & 2032
- Figure 33: North America Live Attenuated Vaccines Industry Revenue Share (%), by Country 2024 & 2032
- Figure 34: North America Live Attenuated Vaccines Industry Volume Share (%), by Country 2024 & 2032
- Figure 35: Europe Live Attenuated Vaccines Industry Revenue (Million), by Product Type 2024 & 2032
- Figure 36: Europe Live Attenuated Vaccines Industry Volume (K Unit), by Product Type 2024 & 2032
- Figure 37: Europe Live Attenuated Vaccines Industry Revenue Share (%), by Product Type 2024 & 2032
- Figure 38: Europe Live Attenuated Vaccines Industry Volume Share (%), by Product Type 2024 & 2032
- Figure 39: Europe Live Attenuated Vaccines Industry Revenue (Million), by Technology 2024 & 2032
- Figure 40: Europe Live Attenuated Vaccines Industry Volume (K Unit), by Technology 2024 & 2032
- Figure 41: Europe Live Attenuated Vaccines Industry Revenue Share (%), by Technology 2024 & 2032
- Figure 42: Europe Live Attenuated Vaccines Industry Volume Share (%), by Technology 2024 & 2032
- Figure 43: Europe Live Attenuated Vaccines Industry Revenue (Million), by Country 2024 & 2032
- Figure 44: Europe Live Attenuated Vaccines Industry Volume (K Unit), by Country 2024 & 2032
- Figure 45: Europe Live Attenuated Vaccines Industry Revenue Share (%), by Country 2024 & 2032
- Figure 46: Europe Live Attenuated Vaccines Industry Volume Share (%), by Country 2024 & 2032
- Figure 47: Asia Pacific Live Attenuated Vaccines Industry Revenue (Million), by Product Type 2024 & 2032
- Figure 48: Asia Pacific Live Attenuated Vaccines Industry Volume (K Unit), by Product Type 2024 & 2032
- Figure 49: Asia Pacific Live Attenuated Vaccines Industry Revenue Share (%), by Product Type 2024 & 2032
- Figure 50: Asia Pacific Live Attenuated Vaccines Industry Volume Share (%), by Product Type 2024 & 2032
- Figure 51: Asia Pacific Live Attenuated Vaccines Industry Revenue (Million), by Technology 2024 & 2032
- Figure 52: Asia Pacific Live Attenuated Vaccines Industry Volume (K Unit), by Technology 2024 & 2032
- Figure 53: Asia Pacific Live Attenuated Vaccines Industry Revenue Share (%), by Technology 2024 & 2032
- Figure 54: Asia Pacific Live Attenuated Vaccines Industry Volume Share (%), by Technology 2024 & 2032
- Figure 55: Asia Pacific Live Attenuated Vaccines Industry Revenue (Million), by Country 2024 & 2032
- Figure 56: Asia Pacific Live Attenuated Vaccines Industry Volume (K Unit), by Country 2024 & 2032
- Figure 57: Asia Pacific Live Attenuated Vaccines Industry Revenue Share (%), by Country 2024 & 2032
- Figure 58: Asia Pacific Live Attenuated Vaccines Industry Volume Share (%), by Country 2024 & 2032
- Figure 59: Middle East and Africa Live Attenuated Vaccines Industry Revenue (Million), by Product Type 2024 & 2032
- Figure 60: Middle East and Africa Live Attenuated Vaccines Industry Volume (K Unit), by Product Type 2024 & 2032
- Figure 61: Middle East and Africa Live Attenuated Vaccines Industry Revenue Share (%), by Product Type 2024 & 2032
- Figure 62: Middle East and Africa Live Attenuated Vaccines Industry Volume Share (%), by Product Type 2024 & 2032
- Figure 63: Middle East and Africa Live Attenuated Vaccines Industry Revenue (Million), by Technology 2024 & 2032
- Figure 64: Middle East and Africa Live Attenuated Vaccines Industry Volume (K Unit), by Technology 2024 & 2032
- Figure 65: Middle East and Africa Live Attenuated Vaccines Industry Revenue Share (%), by Technology 2024 & 2032
- Figure 66: Middle East and Africa Live Attenuated Vaccines Industry Volume Share (%), by Technology 2024 & 2032
- Figure 67: Middle East and Africa Live Attenuated Vaccines Industry Revenue (Million), by Country 2024 & 2032
- Figure 68: Middle East and Africa Live Attenuated Vaccines Industry Volume (K Unit), by Country 2024 & 2032
- Figure 69: Middle East and Africa Live Attenuated Vaccines Industry Revenue Share (%), by Country 2024 & 2032
- Figure 70: Middle East and Africa Live Attenuated Vaccines Industry Volume Share (%), by Country 2024 & 2032
- Figure 71: South America Live Attenuated Vaccines Industry Revenue (Million), by Product Type 2024 & 2032
- Figure 72: South America Live Attenuated Vaccines Industry Volume (K Unit), by Product Type 2024 & 2032
- Figure 73: South America Live Attenuated Vaccines Industry Revenue Share (%), by Product Type 2024 & 2032
- Figure 74: South America Live Attenuated Vaccines Industry Volume Share (%), by Product Type 2024 & 2032
- Figure 75: South America Live Attenuated Vaccines Industry Revenue (Million), by Technology 2024 & 2032
- Figure 76: South America Live Attenuated Vaccines Industry Volume (K Unit), by Technology 2024 & 2032
- Figure 77: South America Live Attenuated Vaccines Industry Revenue Share (%), by Technology 2024 & 2032
- Figure 78: South America Live Attenuated Vaccines Industry Volume Share (%), by Technology 2024 & 2032
- Figure 79: South America Live Attenuated Vaccines Industry Revenue (Million), by Country 2024 & 2032
- Figure 80: South America Live Attenuated Vaccines Industry Volume (K Unit), by Country 2024 & 2032
- Figure 81: South America Live Attenuated Vaccines Industry Revenue Share (%), by Country 2024 & 2032
- Figure 82: South America Live Attenuated Vaccines Industry Volume Share (%), by Country 2024 & 2032
List of Tables
- Table 1: Global Live Attenuated Vaccines Industry Revenue Million Forecast, by Region 2019 & 2032
- Table 2: Global Live Attenuated Vaccines Industry Volume K Unit Forecast, by Region 2019 & 2032
- Table 3: Global Live Attenuated Vaccines Industry Revenue Million Forecast, by Product Type 2019 & 2032
- Table 4: Global Live Attenuated Vaccines Industry Volume K Unit Forecast, by Product Type 2019 & 2032
- Table 5: Global Live Attenuated Vaccines Industry Revenue Million Forecast, by Technology 2019 & 2032
- Table 6: Global Live Attenuated Vaccines Industry Volume K Unit Forecast, by Technology 2019 & 2032
- Table 7: Global Live Attenuated Vaccines Industry Revenue Million Forecast, by Region 2019 & 2032
- Table 8: Global Live Attenuated Vaccines Industry Volume K Unit Forecast, by Region 2019 & 2032
- Table 9: Global Live Attenuated Vaccines Industry Revenue Million Forecast, by Country 2019 & 2032
- Table 10: Global Live Attenuated Vaccines Industry Volume K Unit Forecast, by Country 2019 & 2032
- Table 11: Global Live Attenuated Vaccines Industry Revenue Million Forecast, by Country 2019 & 2032
- Table 12: Global Live Attenuated Vaccines Industry Volume K Unit Forecast, by Country 2019 & 2032
- Table 13: Global Live Attenuated Vaccines Industry Revenue Million Forecast, by Country 2019 & 2032
- Table 14: Global Live Attenuated Vaccines Industry Volume K Unit Forecast, by Country 2019 & 2032
- Table 15: Global Live Attenuated Vaccines Industry Revenue Million Forecast, by Country 2019 & 2032
- Table 16: Global Live Attenuated Vaccines Industry Volume K Unit Forecast, by Country 2019 & 2032
- Table 17: Global Live Attenuated Vaccines Industry Revenue Million Forecast, by Country 2019 & 2032
- Table 18: Global Live Attenuated Vaccines Industry Volume K Unit Forecast, by Country 2019 & 2032
- Table 19: Global Live Attenuated Vaccines Industry Revenue Million Forecast, by Product Type 2019 & 2032
- Table 20: Global Live Attenuated Vaccines Industry Volume K Unit Forecast, by Product Type 2019 & 2032
- Table 21: Global Live Attenuated Vaccines Industry Revenue Million Forecast, by Technology 2019 & 2032
- Table 22: Global Live Attenuated Vaccines Industry Volume K Unit Forecast, by Technology 2019 & 2032
- Table 23: Global Live Attenuated Vaccines Industry Revenue Million Forecast, by Country 2019 & 2032
- Table 24: Global Live Attenuated Vaccines Industry Volume K Unit Forecast, by Country 2019 & 2032
- Table 25: United States Live Attenuated Vaccines Industry Revenue (Million) Forecast, by Application 2019 & 2032
- Table 26: United States Live Attenuated Vaccines Industry Volume (K Unit) Forecast, by Application 2019 & 2032
- Table 27: Canada Live Attenuated Vaccines Industry Revenue (Million) Forecast, by Application 2019 & 2032
- Table 28: Canada Live Attenuated Vaccines Industry Volume (K Unit) Forecast, by Application 2019 & 2032
- Table 29: Mexico Live Attenuated Vaccines Industry Revenue (Million) Forecast, by Application 2019 & 2032
- Table 30: Mexico Live Attenuated Vaccines Industry Volume (K Unit) Forecast, by Application 2019 & 2032
- Table 31: Global Live Attenuated Vaccines Industry Revenue Million Forecast, by Product Type 2019 & 2032
- Table 32: Global Live Attenuated Vaccines Industry Volume K Unit Forecast, by Product Type 2019 & 2032
- Table 33: Global Live Attenuated Vaccines Industry Revenue Million Forecast, by Technology 2019 & 2032
- Table 34: Global Live Attenuated Vaccines Industry Volume K Unit Forecast, by Technology 2019 & 2032
- Table 35: Global Live Attenuated Vaccines Industry Revenue Million Forecast, by Country 2019 & 2032
- Table 36: Global Live Attenuated Vaccines Industry Volume K Unit Forecast, by Country 2019 & 2032
- Table 37: Germany Live Attenuated Vaccines Industry Revenue (Million) Forecast, by Application 2019 & 2032
- Table 38: Germany Live Attenuated Vaccines Industry Volume (K Unit) Forecast, by Application 2019 & 2032
- Table 39: United Kingdom Live Attenuated Vaccines Industry Revenue (Million) Forecast, by Application 2019 & 2032
- Table 40: United Kingdom Live Attenuated Vaccines Industry Volume (K Unit) Forecast, by Application 2019 & 2032
- Table 41: France Live Attenuated Vaccines Industry Revenue (Million) Forecast, by Application 2019 & 2032
- Table 42: France Live Attenuated Vaccines Industry Volume (K Unit) Forecast, by Application 2019 & 2032
- Table 43: Italy Live Attenuated Vaccines Industry Revenue (Million) Forecast, by Application 2019 & 2032
- Table 44: Italy Live Attenuated Vaccines Industry Volume (K Unit) Forecast, by Application 2019 & 2032
- Table 45: Spain Live Attenuated Vaccines Industry Revenue (Million) Forecast, by Application 2019 & 2032
- Table 46: Spain Live Attenuated Vaccines Industry Volume (K Unit) Forecast, by Application 2019 & 2032
- Table 47: Rest of Europe Live Attenuated Vaccines Industry Revenue (Million) Forecast, by Application 2019 & 2032
- Table 48: Rest of Europe Live Attenuated Vaccines Industry Volume (K Unit) Forecast, by Application 2019 & 2032
- Table 49: Global Live Attenuated Vaccines Industry Revenue Million Forecast, by Product Type 2019 & 2032
- Table 50: Global Live Attenuated Vaccines Industry Volume K Unit Forecast, by Product Type 2019 & 2032
- Table 51: Global Live Attenuated Vaccines Industry Revenue Million Forecast, by Technology 2019 & 2032
- Table 52: Global Live Attenuated Vaccines Industry Volume K Unit Forecast, by Technology 2019 & 2032
- Table 53: Global Live Attenuated Vaccines Industry Revenue Million Forecast, by Country 2019 & 2032
- Table 54: Global Live Attenuated Vaccines Industry Volume K Unit Forecast, by Country 2019 & 2032
- Table 55: China Live Attenuated Vaccines Industry Revenue (Million) Forecast, by Application 2019 & 2032
- Table 56: China Live Attenuated Vaccines Industry Volume (K Unit) Forecast, by Application 2019 & 2032
- Table 57: Japan Live Attenuated Vaccines Industry Revenue (Million) Forecast, by Application 2019 & 2032
- Table 58: Japan Live Attenuated Vaccines Industry Volume (K Unit) Forecast, by Application 2019 & 2032
- Table 59: India Live Attenuated Vaccines Industry Revenue (Million) Forecast, by Application 2019 & 2032
- Table 60: India Live Attenuated Vaccines Industry Volume (K Unit) Forecast, by Application 2019 & 2032
- Table 61: Australia Live Attenuated Vaccines Industry Revenue (Million) Forecast, by Application 2019 & 2032
- Table 62: Australia Live Attenuated Vaccines Industry Volume (K Unit) Forecast, by Application 2019 & 2032
- Table 63: South Korea Live Attenuated Vaccines Industry Revenue (Million) Forecast, by Application 2019 & 2032
- Table 64: South Korea Live Attenuated Vaccines Industry Volume (K Unit) Forecast, by Application 2019 & 2032
- Table 65: Rest of Asia Pacific Live Attenuated Vaccines Industry Revenue (Million) Forecast, by Application 2019 & 2032
- Table 66: Rest of Asia Pacific Live Attenuated Vaccines Industry Volume (K Unit) Forecast, by Application 2019 & 2032
- Table 67: Global Live Attenuated Vaccines Industry Revenue Million Forecast, by Product Type 2019 & 2032
- Table 68: Global Live Attenuated Vaccines Industry Volume K Unit Forecast, by Product Type 2019 & 2032
- Table 69: Global Live Attenuated Vaccines Industry Revenue Million Forecast, by Technology 2019 & 2032
- Table 70: Global Live Attenuated Vaccines Industry Volume K Unit Forecast, by Technology 2019 & 2032
- Table 71: Global Live Attenuated Vaccines Industry Revenue Million Forecast, by Country 2019 & 2032
- Table 72: Global Live Attenuated Vaccines Industry Volume K Unit Forecast, by Country 2019 & 2032
- Table 73: GCC Live Attenuated Vaccines Industry Revenue (Million) Forecast, by Application 2019 & 2032
- Table 74: GCC Live Attenuated Vaccines Industry Volume (K Unit) Forecast, by Application 2019 & 2032
- Table 75: South Africa Live Attenuated Vaccines Industry Revenue (Million) Forecast, by Application 2019 & 2032
- Table 76: South Africa Live Attenuated Vaccines Industry Volume (K Unit) Forecast, by Application 2019 & 2032
- Table 77: Rest of Middle East and Africa Live Attenuated Vaccines Industry Revenue (Million) Forecast, by Application 2019 & 2032
- Table 78: Rest of Middle East and Africa Live Attenuated Vaccines Industry Volume (K Unit) Forecast, by Application 2019 & 2032
- Table 79: Global Live Attenuated Vaccines Industry Revenue Million Forecast, by Product Type 2019 & 2032
- Table 80: Global Live Attenuated Vaccines Industry Volume K Unit Forecast, by Product Type 2019 & 2032
- Table 81: Global Live Attenuated Vaccines Industry Revenue Million Forecast, by Technology 2019 & 2032
- Table 82: Global Live Attenuated Vaccines Industry Volume K Unit Forecast, by Technology 2019 & 2032
- Table 83: Global Live Attenuated Vaccines Industry Revenue Million Forecast, by Country 2019 & 2032
- Table 84: Global Live Attenuated Vaccines Industry Volume K Unit Forecast, by Country 2019 & 2032
- Table 85: Brazil Live Attenuated Vaccines Industry Revenue (Million) Forecast, by Application 2019 & 2032
- Table 86: Brazil Live Attenuated Vaccines Industry Volume (K Unit) Forecast, by Application 2019 & 2032
- Table 87: Argentina Live Attenuated Vaccines Industry Revenue (Million) Forecast, by Application 2019 & 2032
- Table 88: Argentina Live Attenuated Vaccines Industry Volume (K Unit) Forecast, by Application 2019 & 2032
- Table 89: Rest of South America Live Attenuated Vaccines Industry Revenue (Million) Forecast, by Application 2019 & 2032
- Table 90: Rest of South America Live Attenuated Vaccines Industry Volume (K Unit) Forecast, by Application 2019 & 2032
Frequently Asked Questions
1. What is the projected Compound Annual Growth Rate (CAGR) of the Live Attenuated Vaccines Industry?
The projected CAGR is approximately 4.21%.
2. Which companies are prominent players in the Live Attenuated Vaccines Industry?
Key companies in the market include Zoetis Inc, Elanco, AniCon Labor GmbH, Boehringer Ingelheim International GmbH, Biovac, Animal Science Products Inc, ADL BIONATUR SOLUTIONS S A, Phibro Animal Health Corporation, Ceva Sante Animale, Merck & Co.
3. What are the main segments of the Live Attenuated Vaccines Industry?
The market segments include Product Type, Technology.
4. Can you provide details about the market size?
The market size is estimated to be USD 5.88 Million as of 2022.
5. What are some drivers contributing to market growth?
Increasing Incidences of Zoonotic Diseases; Initiatives Taken by Various Government Agencies. Animal Associations. and Leading Players; Widened Focus on Food Safety.
6. What are the notable trends driving market growth?
Poultry Vaccine is Expected to Cover a Large Share of the Livestock Vaccines Market.
7. Are there any restraints impacting market growth?
Lack of Veterinarians and Shortage of Skilled Farm Workers; High Storage Costs for Vaccines.
8. Can you provide examples of recent developments in the market?
In August 2022, The SRTF's agriculture project 'Support for the Recovery of Livestock Production Within Northern Aleppo- Phase II' announced receiving the third batch of livestock vaccines. Indirectly, the project will benefit 57,500 estimated family members of livestock breeders in the project area populated by an estimated 250,000 people.
9. What pricing options are available for accessing the report?
Pricing options include single-user, multi-user, and enterprise licenses priced at USD 4750, USD 5250, and USD 8750 respectively.
10. Is the market size provided in terms of value or volume?
The market size is provided in terms of value, measured in Million and volume, measured in K Unit.
11. Are there any specific market keywords associated with the report?
Yes, the market keyword associated with the report is "Live Attenuated Vaccines Industry," which aids in identifying and referencing the specific market segment covered.
12. How do I determine which pricing option suits my needs best?
The pricing options vary based on user requirements and access needs. Individual users may opt for single-user licenses, while businesses requiring broader access may choose multi-user or enterprise licenses for cost-effective access to the report.
13. Are there any additional resources or data provided in the Live Attenuated Vaccines Industry report?
While the report offers comprehensive insights, it's advisable to review the specific contents or supplementary materials provided to ascertain if additional resources or data are available.
14. How can I stay updated on further developments or reports in the Live Attenuated Vaccines Industry?
To stay informed about further developments, trends, and reports in the Live Attenuated Vaccines Industry, consider subscribing to industry newsletters, following relevant companies and organizations, or regularly checking reputable industry news sources and publications.
Methodology
Step 1 - Identification of Relevant Samples Size from Population Database


Step 2 - Approaches for Defining Global Market Size (Value, Volume* & Price*)

Note*: In applicable scenarios
Step 3 - Data Sources
Primary Research
- Web Analytics
- Survey Reports
- Research Institute
- Latest Research Reports
- Opinion Leaders
Secondary Research
- Annual Reports
- White Paper
- Latest Press Release
- Industry Association
- Paid Database
- Investor Presentations

Step 4 - Data Triangulation
Involves using different sources of information in order to increase the validity of a study
These sources are likely to be stakeholders in a program - participants, other researchers, program staff, other community members, and so on.
Then we put all data in single framework & apply various statistical tools to find out the dynamic on the market.
During the analysis stage, feedback from the stakeholder groups would be compared to determine areas of agreement as well as areas of divergence


