
Key Insights
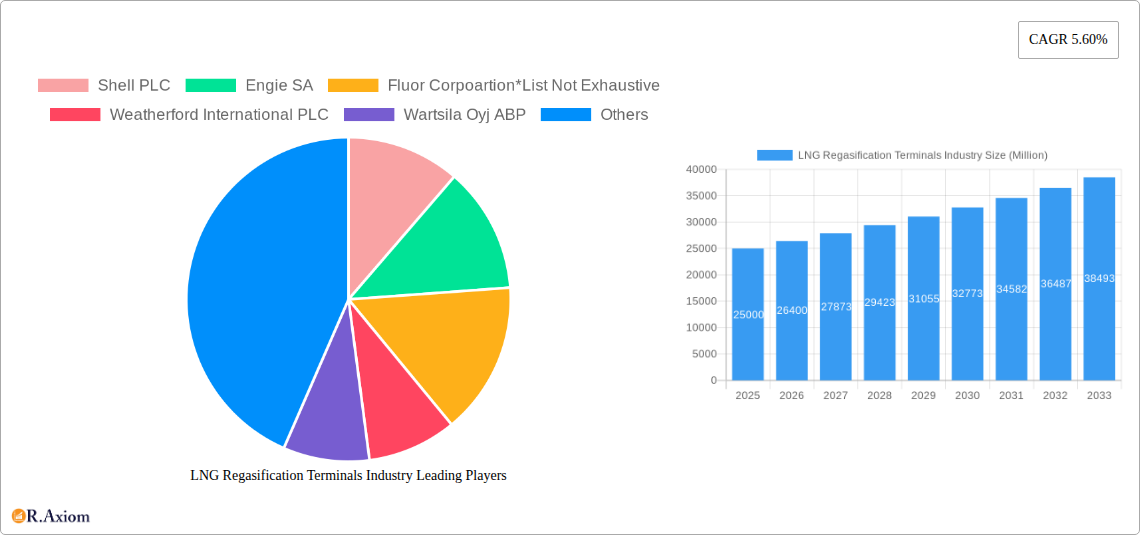
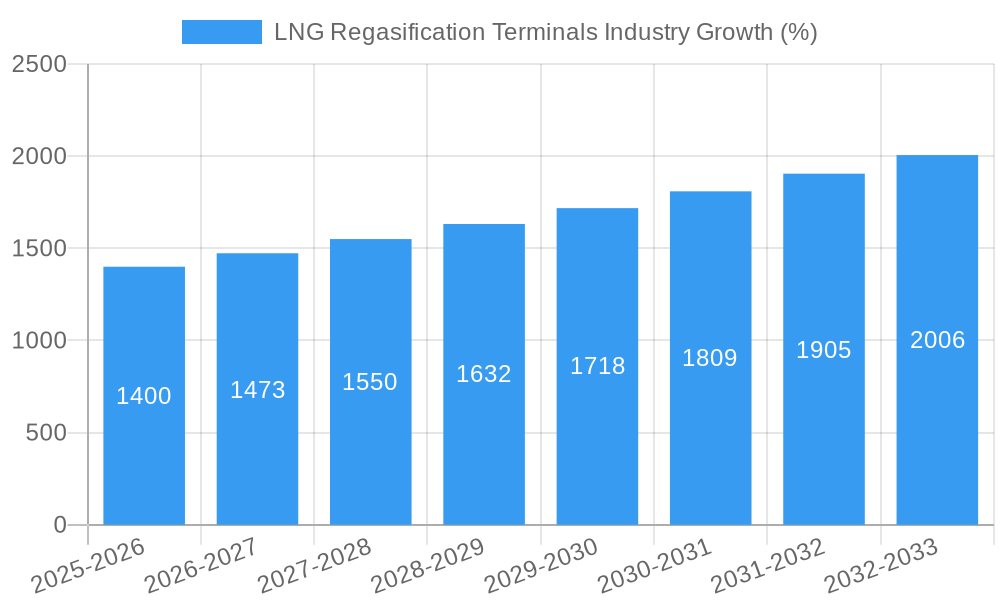
The LNG regasification terminals market is experiencing robust growth, driven by increasing global demand for natural gas as a cleaner alternative to coal and oil. The market's compound annual growth rate (CAGR) of 5.60% from 2019-2033 indicates a significant expansion, projected to reach a substantial market size. Key drivers include the rising energy needs of developing economies, particularly in Asia-Pacific, coupled with stricter environmental regulations promoting cleaner energy sources. The shift towards LNG as a transitional fuel in the energy transition further boosts market growth. Technological advancements in terminal design, including the development of floating storage and regasification units (FSRUs), are improving efficiency and reducing capital expenditure, making smaller-scale projects more viable. This allows for greater flexibility in deployment, particularly in regions with limited infrastructure. Market segmentation reveals strong growth in both onshore and floating deployments, with the latter offering advantages in terms of speed of deployment and adaptability to various locations. Larger-scale terminals remain crucial for meeting significant energy demand, but medium and small-scale terminals are gaining traction due to their cost-effectiveness and flexible scalability.
Despite these positive trends, the market faces certain restraints. Geopolitical instability and volatile natural gas prices create uncertainty in the market. Furthermore, the development of renewable energy sources and potential disruptions due to climate policy changes could influence the long-term growth trajectory. The competition among major players, including Shell PLC, Engie SA, and others, will remain intense, shaping technological innovation and pricing strategies. However, the overall outlook for the LNG regasification terminals market remains optimistic, fueled by consistent global demand and technological advancements that are facilitating greater market accessibility. The diverse regional landscape, with significant growth anticipated in Asia-Pacific and North America, reflects the global nature of the energy transition and the corresponding need for LNG infrastructure development.
LNG Regasification Terminals Industry: A Comprehensive Market Report (2019-2033)
This detailed report provides a comprehensive analysis of the LNG Regasification Terminals industry, covering market size, growth drivers, key players, and future trends. The study period spans from 2019 to 2033, with 2025 serving as both the base and estimated year. This report is essential for industry stakeholders, investors, and anyone seeking to understand the dynamics of this crucial energy infrastructure sector.
LNG Regasification Terminals Industry Market Concentration & Innovation
This section analyzes the competitive landscape of the LNG Regasification Terminals industry, examining market concentration, innovation drivers, regulatory frameworks, and market dynamics. The report explores the roles of major players like Shell PLC, Engie SA, and Fluor Corporation, alongside other significant contributors such as Weatherford International PLC, Wartsila Oyj ABP, Linde plc, Baker Hughes Company, and Schlumberger Limited. The analysis considers mergers and acquisitions (M&A) activity, evaluating deal values and their impact on market share. The report also examines the influence of regulatory frameworks on innovation and market entry. Substitute products and end-user trends are assessed to provide a comprehensive view of market forces shaping the industry. The report quantifies market concentration using metrics such as the Herfindahl-Hirschman Index (HHI) and identifies key innovation drivers such as technological advancements in FSRU design and automation. The total M&A deal value for the period 2019-2024 is estimated at $xx Million, with an average deal size of $xx Million.
LNG Regasification Terminals Industry Industry Trends & Insights
This section delves into the key trends and insights shaping the LNG Regasification Terminals market. The report projects a Compound Annual Growth Rate (CAGR) of xx% for the forecast period (2025-2033), driven by factors such as increasing global demand for natural gas, the growing adoption of LNG as a cleaner fuel source, and supportive government policies promoting energy diversification. Technological advancements, such as the development of more efficient and cost-effective regasification technologies, are also contributing significantly to market growth. The report analyzes the market penetration of different terminal types (large-scale, small-scale, and medium-scale) and deployment methods (onshore and floating). Competitive dynamics are explored, focusing on pricing strategies, market share, and the impact of technological disruptions on established players. Consumer preferences for reliable and sustainable energy solutions are considered.
Dominant Markets & Segments in LNG Regasification Terminals Industry
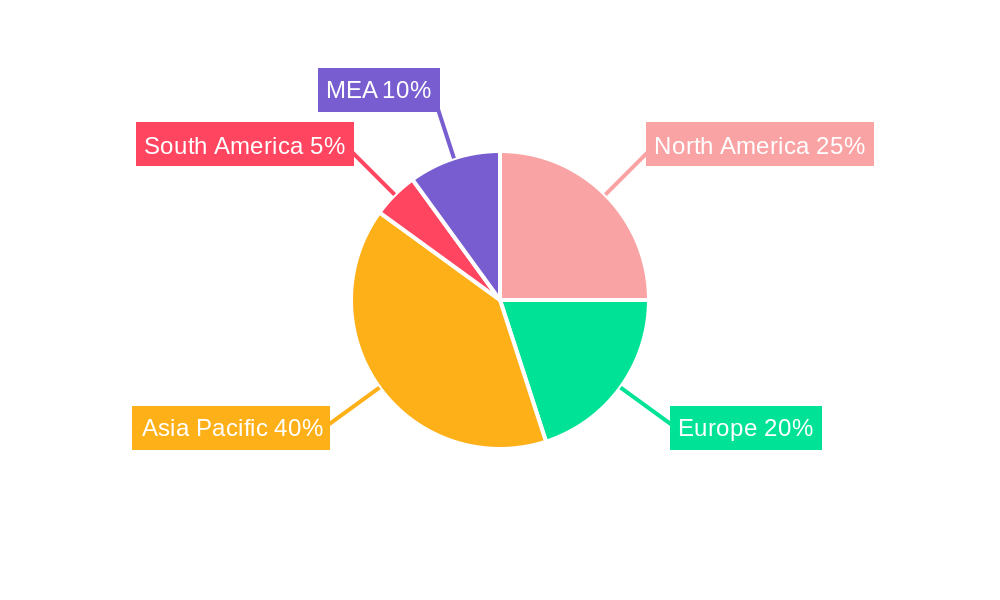
This section identifies the dominant markets and segments within the LNG Regasification Terminals industry. The report pinpoints leading regions and countries based on factors such as natural gas consumption patterns, economic growth, and infrastructure development. Analysis of the market shares of large-scale, small-scale, and medium-scale terminals, as well as onshore and floating deployments, is provided.
- Leading Regions: Asia-Pacific is predicted to dominate, driven by rapid industrialization and rising energy demand. Europe and North America also maintain significant market share.
- Terminal Type: Large-scale terminals currently hold the largest market share due to economies of scale, but small-scale and medium-scale terminals are experiencing growth due to their suitability for smaller markets.
- Deployment: Onshore terminals continue to dominate, but floating storage and regasification units (FSRUs) are gaining traction due to their flexibility and reduced upfront investment costs.
Detailed dominance analysis is provided, focusing on specific economic policies, infrastructure availability, and regulatory environments influencing market leadership in key regions.
LNG Regasification Terminals Industry Product Developments
Recent innovations in LNG regasification technology focus on improving efficiency, reducing emissions, and enhancing safety. The development of smaller, modular regasification units is enabling the expansion of the market into smaller and remote locations. Furthermore, advancements in automation and remote monitoring are reducing operational costs and improving reliability. These advancements are enhancing the market fit for LNG regasification terminals, broadening their application in various sectors and offering significant competitive advantages.
Report Scope & Segmentation Analysis
This report segments the LNG Regasification Terminals market by Terminal Type (Large Scale, Small Scale & Medium) and By Deployment (Onshore, Floating).
- Terminal Type: Large-scale terminals are projected to maintain the largest market share, driven by economies of scale. Small and medium-scale terminals are experiencing accelerated growth, driven by demand from smaller markets and flexibility. The market size for large-scale terminals is projected at $xx Million by 2033.
- Deployment: Onshore terminals account for a larger market share currently, but floating terminals (FSRUs) are expected to experience significant growth over the forecast period due to reduced installation costs and flexibility. The projected market size for floating terminals is $xx Million in 2033.
Key Drivers of LNG Regasification Terminals Industry Growth
Several factors contribute to the growth of the LNG Regasification Terminals industry. The increasing global demand for natural gas, driven by rising energy consumption and the shift towards cleaner energy sources, is a significant driver. Government initiatives promoting LNG infrastructure development and favorable regulatory frameworks further stimulate market growth. Technological advancements resulting in more efficient and cost-effective regasification technologies, coupled with the emergence of innovative solutions like FSRUs, contribute to the market's expansion.
Challenges in the LNG Regasification Terminals Industry Sector
The LNG Regasification Terminals industry faces several challenges, including stringent environmental regulations, potentially leading to increased capital expenditures for emission control measures. Supply chain disruptions, especially concerning specialized equipment and skilled labor, can impact project timelines and costs. Intense competition among existing and new market entrants creates pricing pressures, impacting profitability. These factors, estimated to collectively impact market growth by approximately xx% during the forecast period, necessitate strategic adaptation by industry players.
Emerging Opportunities in LNG Regasification Terminals Industry
The LNG Regasification Terminals industry presents several promising opportunities. Emerging markets in developing economies are increasing demand for LNG infrastructure, driving expansion. The development of smaller, more efficient regasification units expands access to remote and underserved markets. Technological innovations focused on digitalization and automation are improving efficiency and reducing operational costs. These opportunities are expected to drive significant market expansion.
Leading Players in the LNG Regasification Terminals Industry Market
- Shell PLC
- Engie SA
- Fluor Corporation
- Weatherford International PLC
- Wartsila Oyj ABP
- Linde plc
- Baker Hughes Company
- Schlumberger Limited
Key Developments in LNG Regasification Terminals Industry Industry
- September 2021: South Africa announces plans for its first LNG import and distribution terminal at Ngqura port, opting for an FSRU configuration. This signifies the growing interest in FSRUs as a flexible solution for LNG infrastructure development.
- January 2021: ExxonMobil and Royal Vopak sign an MOU to conduct a feasibility study for an LNG regasification terminal in South Africa. This highlights the increasing strategic focus on exploring new LNG import and regasification capabilities in developing regions.
These developments showcase the dynamic nature of the industry and its continuous expansion into new geographical markets.
Strategic Outlook for LNG Regasification Terminals Industry Market
The LNG Regasification Terminals industry exhibits robust growth potential, driven by the global energy transition and rising demand for natural gas. The strategic focus on technological advancements, coupled with supportive government policies and the increasing adoption of FSRUs, signifies a promising outlook for market expansion. The industry's ability to adapt to evolving regulatory environments and overcome supply chain challenges will be critical to realizing this potential and ensuring sustainable growth in the coming years.
LNG Regasification Terminals Industry Segmentation
-
1. Terminal Type
- 1.1. large Scale
- 1.2. Small Scale & Medium
-
2. Deployment
- 2.1. Onshore
- 2.2. Floating
LNG Regasification Terminals Industry Segmentation By Geography
- 1. North America
- 2. South America
- 3. Asia Pacific
- 4. Europe
- 5. Middle East and Africa
LNG Regasification Terminals Industry REPORT HIGHLIGHTS
| Aspects | Details |
|---|---|
| Study Period | 2019-2033 |
| Base Year | 2024 |
| Estimated Year | 2025 |
| Forecast Period | 2025-2033 |
| Historical Period | 2019-2024 |
| Growth Rate | CAGR of 5.60% from 2019-2033 |
| Segmentation |
|
Table of Contents
- 1. Introduction
- 1.1. Research Scope
- 1.2. Market Segmentation
- 1.3. Research Methodology
- 1.4. Definitions and Assumptions
- 2. Executive Summary
- 2.1. Introduction
- 3. Market Dynamics
- 3.1. Introduction
- 3.2. Market Drivers
- 3.2.1. 4.; The Rise in Oil and Gas Drilling Activities4.; Increased Shale Gas Exploration
- 3.3. Market Restrains
- 3.3.1. 4.; Increasing Share of Renewable Energy
- 3.4. Market Trends
- 3.4.1. The Floating Regasification Terminals Segment is Expected to Dominate the Market
- 4. Market Factor Analysis
- 4.1. Porters Five Forces
- 4.2. Supply/Value Chain
- 4.3. PESTEL analysis
- 4.4. Market Entropy
- 4.5. Patent/Trademark Analysis
- 5. Global LNG Regasification Terminals Industry Analysis, Insights and Forecast, 2019-2031
- 5.1. Market Analysis, Insights and Forecast - by Terminal Type
- 5.1.1. large Scale
- 5.1.2. Small Scale & Medium
- 5.2. Market Analysis, Insights and Forecast - by Deployment
- 5.2.1. Onshore
- 5.2.2. Floating
- 5.3. Market Analysis, Insights and Forecast - by Region
- 5.3.1. North America
- 5.3.2. South America
- 5.3.3. Asia Pacific
- 5.3.4. Europe
- 5.3.5. Middle East and Africa
- 5.1. Market Analysis, Insights and Forecast - by Terminal Type
- 6. North America LNG Regasification Terminals Industry Analysis, Insights and Forecast, 2019-2031
- 6.1. Market Analysis, Insights and Forecast - by Terminal Type
- 6.1.1. large Scale
- 6.1.2. Small Scale & Medium
- 6.2. Market Analysis, Insights and Forecast - by Deployment
- 6.2.1. Onshore
- 6.2.2. Floating
- 6.1. Market Analysis, Insights and Forecast - by Terminal Type
- 7. South America LNG Regasification Terminals Industry Analysis, Insights and Forecast, 2019-2031
- 7.1. Market Analysis, Insights and Forecast - by Terminal Type
- 7.1.1. large Scale
- 7.1.2. Small Scale & Medium
- 7.2. Market Analysis, Insights and Forecast - by Deployment
- 7.2.1. Onshore
- 7.2.2. Floating
- 7.1. Market Analysis, Insights and Forecast - by Terminal Type
- 8. Asia Pacific LNG Regasification Terminals Industry Analysis, Insights and Forecast, 2019-2031
- 8.1. Market Analysis, Insights and Forecast - by Terminal Type
- 8.1.1. large Scale
- 8.1.2. Small Scale & Medium
- 8.2. Market Analysis, Insights and Forecast - by Deployment
- 8.2.1. Onshore
- 8.2.2. Floating
- 8.1. Market Analysis, Insights and Forecast - by Terminal Type
- 9. Europe LNG Regasification Terminals Industry Analysis, Insights and Forecast, 2019-2031
- 9.1. Market Analysis, Insights and Forecast - by Terminal Type
- 9.1.1. large Scale
- 9.1.2. Small Scale & Medium
- 9.2. Market Analysis, Insights and Forecast - by Deployment
- 9.2.1. Onshore
- 9.2.2. Floating
- 9.1. Market Analysis, Insights and Forecast - by Terminal Type
- 10. Middle East and Africa LNG Regasification Terminals Industry Analysis, Insights and Forecast, 2019-2031
- 10.1. Market Analysis, Insights and Forecast - by Terminal Type
- 10.1.1. large Scale
- 10.1.2. Small Scale & Medium
- 10.2. Market Analysis, Insights and Forecast - by Deployment
- 10.2.1. Onshore
- 10.2.2. Floating
- 10.1. Market Analysis, Insights and Forecast - by Terminal Type
- 11. North America LNG Regasification Terminals Industry Analysis, Insights and Forecast, 2019-2031
- 11.1. Market Analysis, Insights and Forecast - By Country/Sub-region
- 11.1.1 United States
- 11.1.2 Canada
- 11.1.3 Mexico
- 12. Europe LNG Regasification Terminals Industry Analysis, Insights and Forecast, 2019-2031
- 12.1. Market Analysis, Insights and Forecast - By Country/Sub-region
- 12.1.1 Germany
- 12.1.2 United Kingdom
- 12.1.3 France
- 12.1.4 Spain
- 12.1.5 Italy
- 12.1.6 Spain
- 12.1.7 Belgium
- 12.1.8 Netherland
- 12.1.9 Nordics
- 12.1.10 Rest of Europe
- 13. Asia Pacific LNG Regasification Terminals Industry Analysis, Insights and Forecast, 2019-2031
- 13.1. Market Analysis, Insights and Forecast - By Country/Sub-region
- 13.1.1 China
- 13.1.2 Japan
- 13.1.3 India
- 13.1.4 South Korea
- 13.1.5 Southeast Asia
- 13.1.6 Australia
- 13.1.7 Indonesia
- 13.1.8 Phillipes
- 13.1.9 Singapore
- 13.1.10 Thailandc
- 13.1.11 Rest of Asia Pacific
- 14. South America LNG Regasification Terminals Industry Analysis, Insights and Forecast, 2019-2031
- 14.1. Market Analysis, Insights and Forecast - By Country/Sub-region
- 14.1.1 Brazil
- 14.1.2 Argentina
- 14.1.3 Peru
- 14.1.4 Chile
- 14.1.5 Colombia
- 14.1.6 Ecuador
- 14.1.7 Venezuela
- 14.1.8 Rest of South America
- 15. North America LNG Regasification Terminals Industry Analysis, Insights and Forecast, 2019-2031
- 15.1. Market Analysis, Insights and Forecast - By Country/Sub-region
- 15.1.1 United States
- 15.1.2 Canada
- 15.1.3 Mexico
- 16. MEA LNG Regasification Terminals Industry Analysis, Insights and Forecast, 2019-2031
- 16.1. Market Analysis, Insights and Forecast - By Country/Sub-region
- 16.1.1 United Arab Emirates
- 16.1.2 Saudi Arabia
- 16.1.3 South Africa
- 16.1.4 Rest of Middle East and Africa
- 17. Competitive Analysis
- 17.1. Global Market Share Analysis 2024
- 17.2. Company Profiles
- 17.2.1 Shell PLC
- 17.2.1.1. Overview
- 17.2.1.2. Products
- 17.2.1.3. SWOT Analysis
- 17.2.1.4. Recent Developments
- 17.2.1.5. Financials (Based on Availability)
- 17.2.2 Engie SA
- 17.2.2.1. Overview
- 17.2.2.2. Products
- 17.2.2.3. SWOT Analysis
- 17.2.2.4. Recent Developments
- 17.2.2.5. Financials (Based on Availability)
- 17.2.3 Fluor Corpoartion*List Not Exhaustive
- 17.2.3.1. Overview
- 17.2.3.2. Products
- 17.2.3.3. SWOT Analysis
- 17.2.3.4. Recent Developments
- 17.2.3.5. Financials (Based on Availability)
- 17.2.4 Weatherford International PLC
- 17.2.4.1. Overview
- 17.2.4.2. Products
- 17.2.4.3. SWOT Analysis
- 17.2.4.4. Recent Developments
- 17.2.4.5. Financials (Based on Availability)
- 17.2.5 Wartsila Oyj ABP
- 17.2.5.1. Overview
- 17.2.5.2. Products
- 17.2.5.3. SWOT Analysis
- 17.2.5.4. Recent Developments
- 17.2.5.5. Financials (Based on Availability)
- 17.2.6 Linde plc
- 17.2.6.1. Overview
- 17.2.6.2. Products
- 17.2.6.3. SWOT Analysis
- 17.2.6.4. Recent Developments
- 17.2.6.5. Financials (Based on Availability)
- 17.2.7 Baker Hughes Company
- 17.2.7.1. Overview
- 17.2.7.2. Products
- 17.2.7.3. SWOT Analysis
- 17.2.7.4. Recent Developments
- 17.2.7.5. Financials (Based on Availability)
- 17.2.8 Schlumberger Limited
- 17.2.8.1. Overview
- 17.2.8.2. Products
- 17.2.8.3. SWOT Analysis
- 17.2.8.4. Recent Developments
- 17.2.8.5. Financials (Based on Availability)
- 17.2.1 Shell PLC
List of Figures
- Figure 1: Global LNG Regasification Terminals Industry Revenue Breakdown (Million, %) by Region 2024 & 2032
- Figure 2: North America LNG Regasification Terminals Industry Revenue (Million), by Country 2024 & 2032
- Figure 3: North America LNG Regasification Terminals Industry Revenue Share (%), by Country 2024 & 2032
- Figure 4: Europe LNG Regasification Terminals Industry Revenue (Million), by Country 2024 & 2032
- Figure 5: Europe LNG Regasification Terminals Industry Revenue Share (%), by Country 2024 & 2032
- Figure 6: Asia Pacific LNG Regasification Terminals Industry Revenue (Million), by Country 2024 & 2032
- Figure 7: Asia Pacific LNG Regasification Terminals Industry Revenue Share (%), by Country 2024 & 2032
- Figure 8: South America LNG Regasification Terminals Industry Revenue (Million), by Country 2024 & 2032
- Figure 9: South America LNG Regasification Terminals Industry Revenue Share (%), by Country 2024 & 2032
- Figure 10: North America LNG Regasification Terminals Industry Revenue (Million), by Country 2024 & 2032
- Figure 11: North America LNG Regasification Terminals Industry Revenue Share (%), by Country 2024 & 2032
- Figure 12: MEA LNG Regasification Terminals Industry Revenue (Million), by Country 2024 & 2032
- Figure 13: MEA LNG Regasification Terminals Industry Revenue Share (%), by Country 2024 & 2032
- Figure 14: North America LNG Regasification Terminals Industry Revenue (Million), by Terminal Type 2024 & 2032
- Figure 15: North America LNG Regasification Terminals Industry Revenue Share (%), by Terminal Type 2024 & 2032
- Figure 16: North America LNG Regasification Terminals Industry Revenue (Million), by Deployment 2024 & 2032
- Figure 17: North America LNG Regasification Terminals Industry Revenue Share (%), by Deployment 2024 & 2032
- Figure 18: North America LNG Regasification Terminals Industry Revenue (Million), by Country 2024 & 2032
- Figure 19: North America LNG Regasification Terminals Industry Revenue Share (%), by Country 2024 & 2032
- Figure 20: South America LNG Regasification Terminals Industry Revenue (Million), by Terminal Type 2024 & 2032
- Figure 21: South America LNG Regasification Terminals Industry Revenue Share (%), by Terminal Type 2024 & 2032
- Figure 22: South America LNG Regasification Terminals Industry Revenue (Million), by Deployment 2024 & 2032
- Figure 23: South America LNG Regasification Terminals Industry Revenue Share (%), by Deployment 2024 & 2032
- Figure 24: South America LNG Regasification Terminals Industry Revenue (Million), by Country 2024 & 2032
- Figure 25: South America LNG Regasification Terminals Industry Revenue Share (%), by Country 2024 & 2032
- Figure 26: Asia Pacific LNG Regasification Terminals Industry Revenue (Million), by Terminal Type 2024 & 2032
- Figure 27: Asia Pacific LNG Regasification Terminals Industry Revenue Share (%), by Terminal Type 2024 & 2032
- Figure 28: Asia Pacific LNG Regasification Terminals Industry Revenue (Million), by Deployment 2024 & 2032
- Figure 29: Asia Pacific LNG Regasification Terminals Industry Revenue Share (%), by Deployment 2024 & 2032
- Figure 30: Asia Pacific LNG Regasification Terminals Industry Revenue (Million), by Country 2024 & 2032
- Figure 31: Asia Pacific LNG Regasification Terminals Industry Revenue Share (%), by Country 2024 & 2032
- Figure 32: Europe LNG Regasification Terminals Industry Revenue (Million), by Terminal Type 2024 & 2032
- Figure 33: Europe LNG Regasification Terminals Industry Revenue Share (%), by Terminal Type 2024 & 2032
- Figure 34: Europe LNG Regasification Terminals Industry Revenue (Million), by Deployment 2024 & 2032
- Figure 35: Europe LNG Regasification Terminals Industry Revenue Share (%), by Deployment 2024 & 2032
- Figure 36: Europe LNG Regasification Terminals Industry Revenue (Million), by Country 2024 & 2032
- Figure 37: Europe LNG Regasification Terminals Industry Revenue Share (%), by Country 2024 & 2032
- Figure 38: Middle East and Africa LNG Regasification Terminals Industry Revenue (Million), by Terminal Type 2024 & 2032
- Figure 39: Middle East and Africa LNG Regasification Terminals Industry Revenue Share (%), by Terminal Type 2024 & 2032
- Figure 40: Middle East and Africa LNG Regasification Terminals Industry Revenue (Million), by Deployment 2024 & 2032
- Figure 41: Middle East and Africa LNG Regasification Terminals Industry Revenue Share (%), by Deployment 2024 & 2032
- Figure 42: Middle East and Africa LNG Regasification Terminals Industry Revenue (Million), by Country 2024 & 2032
- Figure 43: Middle East and Africa LNG Regasification Terminals Industry Revenue Share (%), by Country 2024 & 2032
List of Tables
- Table 1: Global LNG Regasification Terminals Industry Revenue Million Forecast, by Region 2019 & 2032
- Table 2: Global LNG Regasification Terminals Industry Revenue Million Forecast, by Terminal Type 2019 & 2032
- Table 3: Global LNG Regasification Terminals Industry Revenue Million Forecast, by Deployment 2019 & 2032
- Table 4: Global LNG Regasification Terminals Industry Revenue Million Forecast, by Region 2019 & 2032
- Table 5: Global LNG Regasification Terminals Industry Revenue Million Forecast, by Country 2019 & 2032
- Table 6: United States LNG Regasification Terminals Industry Revenue (Million) Forecast, by Application 2019 & 2032
- Table 7: Canada LNG Regasification Terminals Industry Revenue (Million) Forecast, by Application 2019 & 2032
- Table 8: Mexico LNG Regasification Terminals Industry Revenue (Million) Forecast, by Application 2019 & 2032
- Table 9: Global LNG Regasification Terminals Industry Revenue Million Forecast, by Country 2019 & 2032
- Table 10: Germany LNG Regasification Terminals Industry Revenue (Million) Forecast, by Application 2019 & 2032
- Table 11: United Kingdom LNG Regasification Terminals Industry Revenue (Million) Forecast, by Application 2019 & 2032
- Table 12: France LNG Regasification Terminals Industry Revenue (Million) Forecast, by Application 2019 & 2032
- Table 13: Spain LNG Regasification Terminals Industry Revenue (Million) Forecast, by Application 2019 & 2032
- Table 14: Italy LNG Regasification Terminals Industry Revenue (Million) Forecast, by Application 2019 & 2032
- Table 15: Spain LNG Regasification Terminals Industry Revenue (Million) Forecast, by Application 2019 & 2032
- Table 16: Belgium LNG Regasification Terminals Industry Revenue (Million) Forecast, by Application 2019 & 2032
- Table 17: Netherland LNG Regasification Terminals Industry Revenue (Million) Forecast, by Application 2019 & 2032
- Table 18: Nordics LNG Regasification Terminals Industry Revenue (Million) Forecast, by Application 2019 & 2032
- Table 19: Rest of Europe LNG Regasification Terminals Industry Revenue (Million) Forecast, by Application 2019 & 2032
- Table 20: Global LNG Regasification Terminals Industry Revenue Million Forecast, by Country 2019 & 2032
- Table 21: China LNG Regasification Terminals Industry Revenue (Million) Forecast, by Application 2019 & 2032
- Table 22: Japan LNG Regasification Terminals Industry Revenue (Million) Forecast, by Application 2019 & 2032
- Table 23: India LNG Regasification Terminals Industry Revenue (Million) Forecast, by Application 2019 & 2032
- Table 24: South Korea LNG Regasification Terminals Industry Revenue (Million) Forecast, by Application 2019 & 2032
- Table 25: Southeast Asia LNG Regasification Terminals Industry Revenue (Million) Forecast, by Application 2019 & 2032
- Table 26: Australia LNG Regasification Terminals Industry Revenue (Million) Forecast, by Application 2019 & 2032
- Table 27: Indonesia LNG Regasification Terminals Industry Revenue (Million) Forecast, by Application 2019 & 2032
- Table 28: Phillipes LNG Regasification Terminals Industry Revenue (Million) Forecast, by Application 2019 & 2032
- Table 29: Singapore LNG Regasification Terminals Industry Revenue (Million) Forecast, by Application 2019 & 2032
- Table 30: Thailandc LNG Regasification Terminals Industry Revenue (Million) Forecast, by Application 2019 & 2032
- Table 31: Rest of Asia Pacific LNG Regasification Terminals Industry Revenue (Million) Forecast, by Application 2019 & 2032
- Table 32: Global LNG Regasification Terminals Industry Revenue Million Forecast, by Country 2019 & 2032
- Table 33: Brazil LNG Regasification Terminals Industry Revenue (Million) Forecast, by Application 2019 & 2032
- Table 34: Argentina LNG Regasification Terminals Industry Revenue (Million) Forecast, by Application 2019 & 2032
- Table 35: Peru LNG Regasification Terminals Industry Revenue (Million) Forecast, by Application 2019 & 2032
- Table 36: Chile LNG Regasification Terminals Industry Revenue (Million) Forecast, by Application 2019 & 2032
- Table 37: Colombia LNG Regasification Terminals Industry Revenue (Million) Forecast, by Application 2019 & 2032
- Table 38: Ecuador LNG Regasification Terminals Industry Revenue (Million) Forecast, by Application 2019 & 2032
- Table 39: Venezuela LNG Regasification Terminals Industry Revenue (Million) Forecast, by Application 2019 & 2032
- Table 40: Rest of South America LNG Regasification Terminals Industry Revenue (Million) Forecast, by Application 2019 & 2032
- Table 41: Global LNG Regasification Terminals Industry Revenue Million Forecast, by Country 2019 & 2032
- Table 42: United States LNG Regasification Terminals Industry Revenue (Million) Forecast, by Application 2019 & 2032
- Table 43: Canada LNG Regasification Terminals Industry Revenue (Million) Forecast, by Application 2019 & 2032
- Table 44: Mexico LNG Regasification Terminals Industry Revenue (Million) Forecast, by Application 2019 & 2032
- Table 45: Global LNG Regasification Terminals Industry Revenue Million Forecast, by Country 2019 & 2032
- Table 46: United Arab Emirates LNG Regasification Terminals Industry Revenue (Million) Forecast, by Application 2019 & 2032
- Table 47: Saudi Arabia LNG Regasification Terminals Industry Revenue (Million) Forecast, by Application 2019 & 2032
- Table 48: South Africa LNG Regasification Terminals Industry Revenue (Million) Forecast, by Application 2019 & 2032
- Table 49: Rest of Middle East and Africa LNG Regasification Terminals Industry Revenue (Million) Forecast, by Application 2019 & 2032
- Table 50: Global LNG Regasification Terminals Industry Revenue Million Forecast, by Terminal Type 2019 & 2032
- Table 51: Global LNG Regasification Terminals Industry Revenue Million Forecast, by Deployment 2019 & 2032
- Table 52: Global LNG Regasification Terminals Industry Revenue Million Forecast, by Country 2019 & 2032
- Table 53: Global LNG Regasification Terminals Industry Revenue Million Forecast, by Terminal Type 2019 & 2032
- Table 54: Global LNG Regasification Terminals Industry Revenue Million Forecast, by Deployment 2019 & 2032
- Table 55: Global LNG Regasification Terminals Industry Revenue Million Forecast, by Country 2019 & 2032
- Table 56: Global LNG Regasification Terminals Industry Revenue Million Forecast, by Terminal Type 2019 & 2032
- Table 57: Global LNG Regasification Terminals Industry Revenue Million Forecast, by Deployment 2019 & 2032
- Table 58: Global LNG Regasification Terminals Industry Revenue Million Forecast, by Country 2019 & 2032
- Table 59: Global LNG Regasification Terminals Industry Revenue Million Forecast, by Terminal Type 2019 & 2032
- Table 60: Global LNG Regasification Terminals Industry Revenue Million Forecast, by Deployment 2019 & 2032
- Table 61: Global LNG Regasification Terminals Industry Revenue Million Forecast, by Country 2019 & 2032
- Table 62: Global LNG Regasification Terminals Industry Revenue Million Forecast, by Terminal Type 2019 & 2032
- Table 63: Global LNG Regasification Terminals Industry Revenue Million Forecast, by Deployment 2019 & 2032
- Table 64: Global LNG Regasification Terminals Industry Revenue Million Forecast, by Country 2019 & 2032
Frequently Asked Questions
1. What is the projected Compound Annual Growth Rate (CAGR) of the LNG Regasification Terminals Industry?
The projected CAGR is approximately 5.60%.
2. Which companies are prominent players in the LNG Regasification Terminals Industry?
Key companies in the market include Shell PLC, Engie SA, Fluor Corpoartion*List Not Exhaustive, Weatherford International PLC, Wartsila Oyj ABP, Linde plc, Baker Hughes Company, Schlumberger Limited.
3. What are the main segments of the LNG Regasification Terminals Industry?
The market segments include Terminal Type, Deployment.
4. Can you provide details about the market size?
The market size is estimated to be USD XX Million as of 2022.
5. What are some drivers contributing to market growth?
4.; The Rise in Oil and Gas Drilling Activities4.; Increased Shale Gas Exploration.
6. What are the notable trends driving market growth?
The Floating Regasification Terminals Segment is Expected to Dominate the Market.
7. Are there any restraints impacting market growth?
4.; Increasing Share of Renewable Energy.
8. Can you provide examples of recent developments in the market?
In September 2021, South Africa's state-owned Central Energy Fund (CEF) and its partners, state-owned logistics firm Transnet and the Coega Development Corporation (CDC) joined together for establishing the country's first LNG import and distribution terminal at the Ngqura (Coega) deepwater port in the Eastern Cape. According to the joint committee, A floating storage and regasification unit (FSRU) has been identified as the preferred terminal configuration for LNG import and distribution
9. What pricing options are available for accessing the report?
Pricing options include single-user, multi-user, and enterprise licenses priced at USD 4750, USD 5250, and USD 8750 respectively.
10. Is the market size provided in terms of value or volume?
The market size is provided in terms of value, measured in Million.
11. Are there any specific market keywords associated with the report?
Yes, the market keyword associated with the report is "LNG Regasification Terminals Industry," which aids in identifying and referencing the specific market segment covered.
12. How do I determine which pricing option suits my needs best?
The pricing options vary based on user requirements and access needs. Individual users may opt for single-user licenses, while businesses requiring broader access may choose multi-user or enterprise licenses for cost-effective access to the report.
13. Are there any additional resources or data provided in the LNG Regasification Terminals Industry report?
While the report offers comprehensive insights, it's advisable to review the specific contents or supplementary materials provided to ascertain if additional resources or data are available.
14. How can I stay updated on further developments or reports in the LNG Regasification Terminals Industry?
To stay informed about further developments, trends, and reports in the LNG Regasification Terminals Industry, consider subscribing to industry newsletters, following relevant companies and organizations, or regularly checking reputable industry news sources and publications.
Methodology
Step 1 - Identification of Relevant Samples Size from Population Database


Step 2 - Approaches for Defining Global Market Size (Value, Volume* & Price*)

Note*: In applicable scenarios
Step 3 - Data Sources
Primary Research
- Web Analytics
- Survey Reports
- Research Institute
- Latest Research Reports
- Opinion Leaders
Secondary Research
- Annual Reports
- White Paper
- Latest Press Release
- Industry Association
- Paid Database
- Investor Presentations

Step 4 - Data Triangulation
Involves using different sources of information in order to increase the validity of a study
These sources are likely to be stakeholders in a program - participants, other researchers, program staff, other community members, and so on.
Then we put all data in single framework & apply various statistical tools to find out the dynamic on the market.
During the analysis stage, feedback from the stakeholder groups would be compared to determine areas of agreement as well as areas of divergence


