
Key Insights
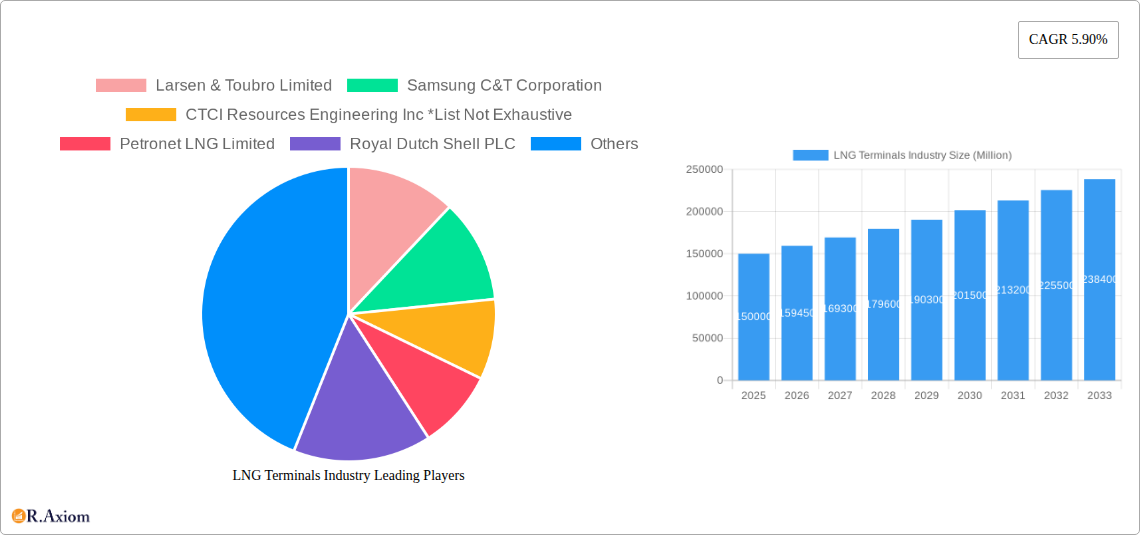
The global LNG (Liquefied Natural Gas) Terminals market is experiencing robust growth, projected to reach a substantial market size, driven by increasing global energy demand and the transition towards cleaner energy sources. The market's 5.90% CAGR signifies a consistent upward trajectory, fueled primarily by the rising adoption of LNG as a cleaner alternative to traditional fossil fuels in power generation, industrial processes, and transportation sectors. Onshore terminals currently dominate the market share by terminal type, benefiting from established infrastructure and lower initial investment costs. However, floating LNG (FLNG) terminals are gaining traction, particularly in regions with limited onshore infrastructure or complex geological conditions, offering flexibility and reduced environmental impact. Key market players, including Larsen & Toubro Limited, Samsung C&T Corporation, and others, are strategically expanding their operations to capitalize on this growth, focusing on innovative technologies and optimized terminal designs. Geographic expansion, particularly in the Asia-Pacific region with its burgeoning energy needs and expanding industrial base, further contributes to the market's dynamism. While regulatory hurdles and fluctuating LNG prices pose certain restraints, the long-term outlook remains positive, driven by sustained global energy demand and the increasing emphasis on environmentally sustainable energy solutions.
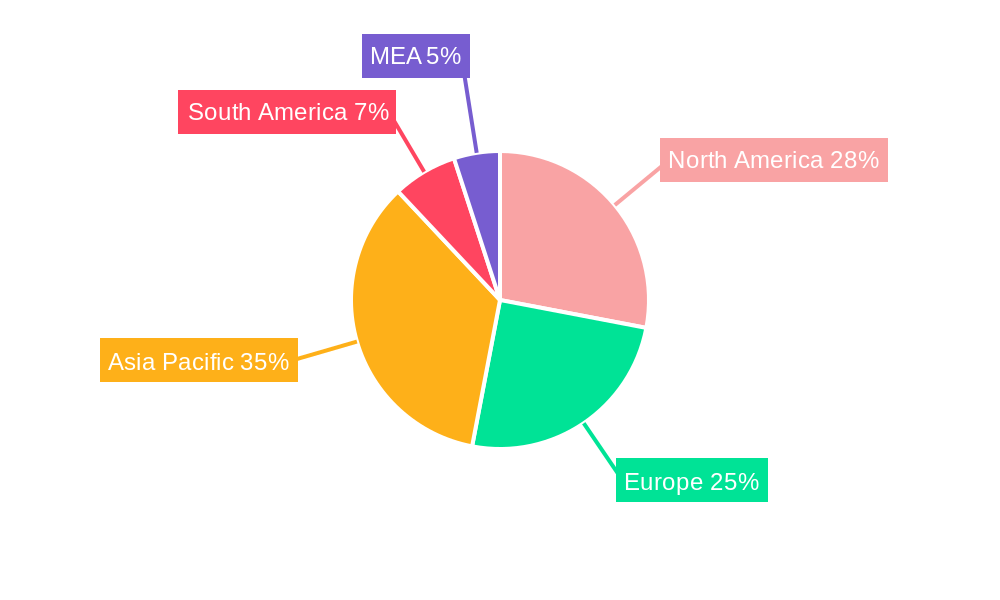
The market segmentation reveals distinct opportunities within the LNG Terminals landscape. The power generation sector is a major consumer of LNG, reflecting the shift toward cleaner energy sources. Industrial applications also contribute significantly, with increasing demand across various manufacturing processes. Transportation, albeit a smaller segment currently, exhibits strong growth potential as LNG-powered vehicles and shipping gain momentum. Regional variations exist, with North America and Asia-Pacific showing the strongest growth due to favorable regulatory environments, extensive infrastructure development, and high energy consumption. Europe is also a significant market, but growth might be slightly moderated due to existing regulations and diversification of energy sources. The competitive landscape is characterized by a mix of established multinational corporations and regional players. The success of key players hinges on their ability to innovate, secure long-term contracts, and strategically navigate regulatory frameworks, which will shape the future landscape of this dynamic industry.
LNG Terminals Industry: A Comprehensive Market Analysis (2019-2033)
This comprehensive report provides an in-depth analysis of the global LNG Terminals industry, offering valuable insights for stakeholders, investors, and industry professionals. Covering the period 2019-2033, with a base year of 2025 and a forecast period of 2025-2033, this report meticulously examines market trends, competitive dynamics, and growth opportunities. The report uses Million (M) as the unit for all values.
LNG Terminals Industry Market Concentration & Innovation
This section analyzes the level of market concentration within the LNG Terminals industry, identifying key players and their respective market shares. The report explores innovation drivers, including technological advancements and regulatory changes, impacting the sector. We examine the influence of substitute products, evolving end-user trends, and the impact of mergers and acquisitions (M&A) activities. The analysis includes an assessment of M&A deal values (estimated at xx M) and market share data for leading companies such as Larsen & Toubro Limited, Samsung C&T Corporation, and CTCI Resources Engineering Inc., among others. The report details the regulatory frameworks governing the industry and their influence on market dynamics. For example, the implementation of stricter environmental regulations has spurred innovation in cleaner technologies within LNG terminal operations. The evolving energy landscape and the increasing demand for cleaner energy sources are also analyzed, highlighting their influence on industry growth.
- Market Concentration: The report assesses the Herfindahl-Hirschman Index (HHI) and other concentration metrics to quantify the level of competition.
- Innovation Drivers: Technological advancements in LNG terminal design, construction, and operation are examined, along with the impact of regulatory frameworks and government incentives.
- M&A Activity: A detailed analysis of significant M&A deals in the industry, including deal values and strategic implications, is presented. The analysis considers the impact of these deals on market consolidation and competitive landscape.
- End-User Trends: Shifting demand patterns across various end-use sectors (power generation, industrial, and transportation) are analyzed, reflecting changes in energy consumption patterns and government policies.
LNG Terminals Industry Industry Trends & Insights
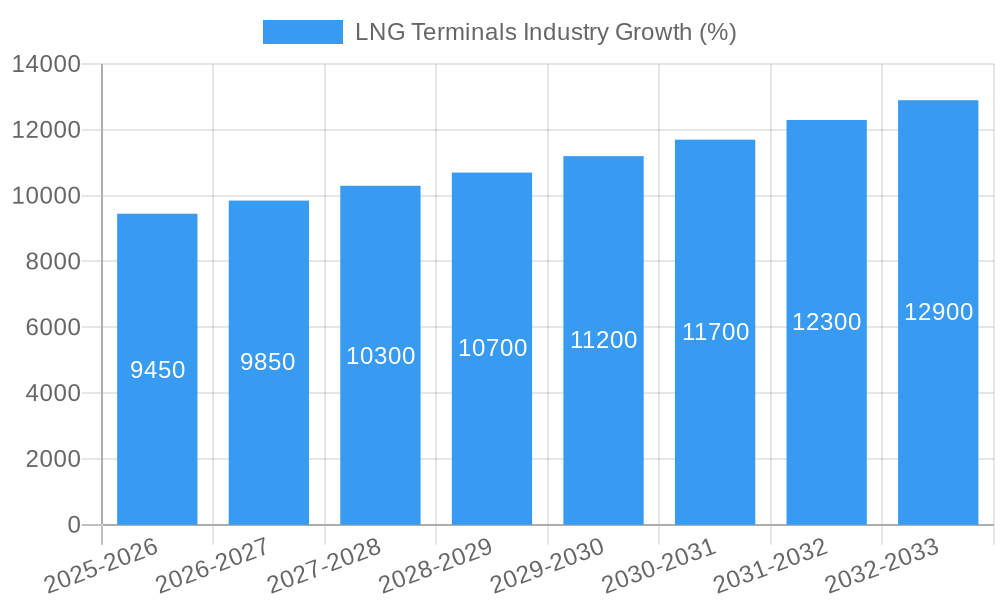
This section delves into the key trends shaping the LNG Terminals industry. It analyzes market growth drivers, including rising global energy demand and the increasing adoption of LNG as a cleaner fuel source. Technological disruptions, such as automation and digitization of terminal operations, are examined in detail. The report also covers consumer preferences and their impact on market demand, exploring factors such as environmental concerns and the shift towards sustainable energy solutions. Finally, we analyze the competitive dynamics within the LNG terminals industry, focusing on pricing strategies, market share battles, and the overall competitive intensity. The compound annual growth rate (CAGR) and market penetration rates are calculated for the forecast period.
Dominant Markets & Segments in LNG Terminals Industry
This section identifies the leading regions, countries, and segments within the LNG Terminals market. It analyzes the dominance of onshore and floating LNG terminals, focusing on key growth drivers for each type. For the product type (LNG), it analyzes the market share and growth potential. The application segments (Power Generation, Industrial, Transportation) are thoroughly examined, highlighting their relative contribution to overall market growth.
- Leading Regions/Countries: The report pinpoints the geographically dominant markets, explaining the factors contributing to their success. Specific examples include factors such as robust economic growth, supportive government policies, and access to natural gas resources.
- Terminal Type: Onshore terminals and Floating Storage Regasification Units (FSRUs) are compared, considering their advantages, disadvantages, and market share.
- Application Segments: A detailed analysis of each application segment (Power Generation, Industrial, Transportation) identifies the leading segment and its growth drivers.
- Key Drivers: Specific policies (e.g., tax incentives for LNG infrastructure), economic factors (e.g., rising energy demand), and infrastructure availability (e.g., pipelines and transportation networks) are analyzed as key drivers of segment dominance.
LNG Terminals Industry Product Developments
This section summarizes recent product innovations within the LNG Terminals industry. Technological advancements, such as the use of advanced materials and automation technologies, are highlighted. The report emphasizes the competitive advantages offered by these innovations and their alignment with the evolving market needs. The focus is on how these developments enhance efficiency, reduce operational costs, and improve environmental performance.
Report Scope & Segmentation Analysis
This report provides a comprehensive segmentation analysis of the LNG Terminals market. It covers the following segments:
- Terminal Type: Onshore and Floating. Growth projections and competitive dynamics are provided for each segment. Market size estimates (in M) for each segment in the base year and forecast year are included.
- Product Type: LNG. This section focuses on the market size and growth prospects for LNG as the primary product handled by terminals.
- Application: Power Generation, Industrial, and Transportation. Growth projections, market sizes, and competitive analysis are presented for each application segment.
Key Drivers of LNG Terminals Industry Growth
The LNG Terminals industry is driven by several key factors. Rising global energy demand, particularly in developing economies, is a significant driver. The growing preference for cleaner fuels and government policies promoting the adoption of natural gas as a transition fuel also contribute substantially. Technological advancements, enabling greater efficiency and lower costs in LNG terminal operations, provide further impetus to growth. Finally, increasing investments in LNG infrastructure, including pipelines and terminals, are propelling market expansion.
Challenges in the LNG Terminals Industry Sector
The LNG Terminals industry faces several challenges. Regulatory hurdles, such as environmental permits and approvals, can significantly impact project timelines and costs. Supply chain disruptions, particularly in the procurement of materials and equipment, can affect construction and operational efficiency. Finally, intense competition among existing and emerging players can put pressure on profit margins and hinder market entry. The report quantifies the impact of these challenges on the industry’s overall growth potential.
Emerging Opportunities in LNG Terminals Industry
Several emerging opportunities exist for the LNG Terminals industry. The expansion into new geographic markets, particularly in regions with growing energy demand and limited existing infrastructure, presents significant potential. Technological innovations, such as the development of smaller, more flexible terminals, offer advantages in terms of cost-effectiveness and adaptability. Finally, the increasing adoption of renewable energy sources, combined with advancements in carbon capture and storage (CCS) technologies, offers avenues for the industry to contribute to decarbonization efforts.
Leading Players in the LNG Terminals Industry Market
- Larsen & Toubro Limited
- Samsung C&T Corporation
- CTCI Resources Engineering Inc
- Petronet LNG Limited
- Royal Dutch Shell PLC
- Tokyo Gas Co Ltd
- McDermott International Inc
- Egyptian Natural Gas Holding Company
- Toho Gas Co Ltd
Key Developments in LNG Terminals Industry Industry
- January 2023: Petronet LNG Limited announces expansion plans for its LNG terminal capacity.
- June 2022: Samsung C&T Corporation secures a major contract for the construction of a new LNG terminal.
- October 2021: A significant merger between two smaller LNG terminal operators reshapes the competitive landscape. (Further details on specific mergers and acquisitions are presented within the full report.)
Strategic Outlook for LNG Terminals Industry Market
The future of the LNG Terminals industry appears promising, driven by persistent global demand for natural gas and ongoing investments in LNG infrastructure. The industry is expected to see further consolidation through mergers and acquisitions, along with increased adoption of innovative technologies aimed at enhancing efficiency and sustainability. The report concludes with a strategic outlook, outlining potential market growth trajectories and key opportunities for companies to capitalize on the evolving energy landscape.
LNG Terminals Industry Segmentation
-
1. Terminal Type
- 1.1. Onshore
- 1.2. Floating
LNG Terminals Industry Segmentation By Geography
- 1. North America
- 2. Asia Pacific
- 3. Europe
- 4. South America
- 5. Middle East and Africa
LNG Terminals Industry REPORT HIGHLIGHTS
| Aspects | Details |
|---|---|
| Study Period | 2019-2033 |
| Base Year | 2024 |
| Estimated Year | 2025 |
| Forecast Period | 2025-2033 |
| Historical Period | 2019-2024 |
| Growth Rate | CAGR of 5.90% from 2019-2033 |
| Segmentation |
|
Table of Contents
- 1. Introduction
- 1.1. Research Scope
- 1.2. Market Segmentation
- 1.3. Research Methodology
- 1.4. Definitions and Assumptions
- 2. Executive Summary
- 2.1. Introduction
- 3. Market Dynamics
- 3.1. Introduction
- 3.2. Market Drivers
- 3.2.1. 4.; Declining Solar Panel Costs4.; Supportive Government Policies
- 3.3. Market Restrains
- 3.3.1. 4.; High Upfront Cost
- 3.4. Market Trends
- 3.4.1. Floating Storage Regasification Unit to Witness Huge Growth
- 4. Market Factor Analysis
- 4.1. Porters Five Forces
- 4.2. Supply/Value Chain
- 4.3. PESTEL analysis
- 4.4. Market Entropy
- 4.5. Patent/Trademark Analysis
- 5. Global LNG Terminals Industry Analysis, Insights and Forecast, 2019-2031
- 5.1. Market Analysis, Insights and Forecast - by Terminal Type
- 5.1.1. Onshore
- 5.1.2. Floating
- 5.2. Market Analysis, Insights and Forecast - by Region
- 5.2.1. North America
- 5.2.2. Asia Pacific
- 5.2.3. Europe
- 5.2.4. South America
- 5.2.5. Middle East and Africa
- 5.1. Market Analysis, Insights and Forecast - by Terminal Type
- 6. North America LNG Terminals Industry Analysis, Insights and Forecast, 2019-2031
- 6.1. Market Analysis, Insights and Forecast - by Terminal Type
- 6.1.1. Onshore
- 6.1.2. Floating
- 6.1. Market Analysis, Insights and Forecast - by Terminal Type
- 7. Asia Pacific LNG Terminals Industry Analysis, Insights and Forecast, 2019-2031
- 7.1. Market Analysis, Insights and Forecast - by Terminal Type
- 7.1.1. Onshore
- 7.1.2. Floating
- 7.1. Market Analysis, Insights and Forecast - by Terminal Type
- 8. Europe LNG Terminals Industry Analysis, Insights and Forecast, 2019-2031
- 8.1. Market Analysis, Insights and Forecast - by Terminal Type
- 8.1.1. Onshore
- 8.1.2. Floating
- 8.1. Market Analysis, Insights and Forecast - by Terminal Type
- 9. South America LNG Terminals Industry Analysis, Insights and Forecast, 2019-2031
- 9.1. Market Analysis, Insights and Forecast - by Terminal Type
- 9.1.1. Onshore
- 9.1.2. Floating
- 9.1. Market Analysis, Insights and Forecast - by Terminal Type
- 10. Middle East and Africa LNG Terminals Industry Analysis, Insights and Forecast, 2019-2031
- 10.1. Market Analysis, Insights and Forecast - by Terminal Type
- 10.1.1. Onshore
- 10.1.2. Floating
- 10.1. Market Analysis, Insights and Forecast - by Terminal Type
- 11. North America LNG Terminals Industry Analysis, Insights and Forecast, 2019-2031
- 11.1. Market Analysis, Insights and Forecast - By Country/Sub-region
- 11.1.1 United States
- 11.1.2 Canada
- 11.1.3 Mexico
- 12. Europe LNG Terminals Industry Analysis, Insights and Forecast, 2019-2031
- 12.1. Market Analysis, Insights and Forecast - By Country/Sub-region
- 12.1.1 Germany
- 12.1.2 United Kingdom
- 12.1.3 France
- 12.1.4 Spain
- 12.1.5 Italy
- 12.1.6 Spain
- 12.1.7 Belgium
- 12.1.8 Netherland
- 12.1.9 Nordics
- 12.1.10 Rest of Europe
- 13. Asia Pacific LNG Terminals Industry Analysis, Insights and Forecast, 2019-2031
- 13.1. Market Analysis, Insights and Forecast - By Country/Sub-region
- 13.1.1 China
- 13.1.2 Japan
- 13.1.3 India
- 13.1.4 South Korea
- 13.1.5 Southeast Asia
- 13.1.6 Australia
- 13.1.7 Indonesia
- 13.1.8 Phillipes
- 13.1.9 Singapore
- 13.1.10 Thailandc
- 13.1.11 Rest of Asia Pacific
- 14. South America LNG Terminals Industry Analysis, Insights and Forecast, 2019-2031
- 14.1. Market Analysis, Insights and Forecast - By Country/Sub-region
- 14.1.1 Brazil
- 14.1.2 Argentina
- 14.1.3 Peru
- 14.1.4 Chile
- 14.1.5 Colombia
- 14.1.6 Ecuador
- 14.1.7 Venezuela
- 14.1.8 Rest of South America
- 15. North America LNG Terminals Industry Analysis, Insights and Forecast, 2019-2031
- 15.1. Market Analysis, Insights and Forecast - By Country/Sub-region
- 15.1.1 United States
- 15.1.2 Canada
- 15.1.3 Mexico
- 16. MEA LNG Terminals Industry Analysis, Insights and Forecast, 2019-2031
- 16.1. Market Analysis, Insights and Forecast - By Country/Sub-region
- 16.1.1 United Arab Emirates
- 16.1.2 Saudi Arabia
- 16.1.3 South Africa
- 16.1.4 Rest of Middle East and Africa
- 17. Competitive Analysis
- 17.1. Global Market Share Analysis 2024
- 17.2. Company Profiles
- 17.2.1 Larsen & Toubro Limited
- 17.2.1.1. Overview
- 17.2.1.2. Products
- 17.2.1.3. SWOT Analysis
- 17.2.1.4. Recent Developments
- 17.2.1.5. Financials (Based on Availability)
- 17.2.2 Samsung C&T Corporation
- 17.2.2.1. Overview
- 17.2.2.2. Products
- 17.2.2.3. SWOT Analysis
- 17.2.2.4. Recent Developments
- 17.2.2.5. Financials (Based on Availability)
- 17.2.3 CTCI Resources Engineering Inc *List Not Exhaustive
- 17.2.3.1. Overview
- 17.2.3.2. Products
- 17.2.3.3. SWOT Analysis
- 17.2.3.4. Recent Developments
- 17.2.3.5. Financials (Based on Availability)
- 17.2.4 Petronet LNG Limited
- 17.2.4.1. Overview
- 17.2.4.2. Products
- 17.2.4.3. SWOT Analysis
- 17.2.4.4. Recent Developments
- 17.2.4.5. Financials (Based on Availability)
- 17.2.5 Royal Dutch Shell PLC
- 17.2.5.1. Overview
- 17.2.5.2. Products
- 17.2.5.3. SWOT Analysis
- 17.2.5.4. Recent Developments
- 17.2.5.5. Financials (Based on Availability)
- 17.2.6 Tokyo Gas Co Ltd
- 17.2.6.1. Overview
- 17.2.6.2. Products
- 17.2.6.3. SWOT Analysis
- 17.2.6.4. Recent Developments
- 17.2.6.5. Financials (Based on Availability)
- 17.2.7 McDermott International Inc
- 17.2.7.1. Overview
- 17.2.7.2. Products
- 17.2.7.3. SWOT Analysis
- 17.2.7.4. Recent Developments
- 17.2.7.5. Financials (Based on Availability)
- 17.2.8 Egyptian Natural Gas Holding Company
- 17.2.8.1. Overview
- 17.2.8.2. Products
- 17.2.8.3. SWOT Analysis
- 17.2.8.4. Recent Developments
- 17.2.8.5. Financials (Based on Availability)
- 17.2.9 Toho Gas Co Ltd
- 17.2.9.1. Overview
- 17.2.9.2. Products
- 17.2.9.3. SWOT Analysis
- 17.2.9.4. Recent Developments
- 17.2.9.5. Financials (Based on Availability)
- 17.2.1 Larsen & Toubro Limited
List of Figures
- Figure 1: Global LNG Terminals Industry Revenue Breakdown (Million, %) by Region 2024 & 2032
- Figure 2: North America LNG Terminals Industry Revenue (Million), by Country 2024 & 2032
- Figure 3: North America LNG Terminals Industry Revenue Share (%), by Country 2024 & 2032
- Figure 4: Europe LNG Terminals Industry Revenue (Million), by Country 2024 & 2032
- Figure 5: Europe LNG Terminals Industry Revenue Share (%), by Country 2024 & 2032
- Figure 6: Asia Pacific LNG Terminals Industry Revenue (Million), by Country 2024 & 2032
- Figure 7: Asia Pacific LNG Terminals Industry Revenue Share (%), by Country 2024 & 2032
- Figure 8: South America LNG Terminals Industry Revenue (Million), by Country 2024 & 2032
- Figure 9: South America LNG Terminals Industry Revenue Share (%), by Country 2024 & 2032
- Figure 10: North America LNG Terminals Industry Revenue (Million), by Country 2024 & 2032
- Figure 11: North America LNG Terminals Industry Revenue Share (%), by Country 2024 & 2032
- Figure 12: MEA LNG Terminals Industry Revenue (Million), by Country 2024 & 2032
- Figure 13: MEA LNG Terminals Industry Revenue Share (%), by Country 2024 & 2032
- Figure 14: North America LNG Terminals Industry Revenue (Million), by Terminal Type 2024 & 2032
- Figure 15: North America LNG Terminals Industry Revenue Share (%), by Terminal Type 2024 & 2032
- Figure 16: North America LNG Terminals Industry Revenue (Million), by Country 2024 & 2032
- Figure 17: North America LNG Terminals Industry Revenue Share (%), by Country 2024 & 2032
- Figure 18: Asia Pacific LNG Terminals Industry Revenue (Million), by Terminal Type 2024 & 2032
- Figure 19: Asia Pacific LNG Terminals Industry Revenue Share (%), by Terminal Type 2024 & 2032
- Figure 20: Asia Pacific LNG Terminals Industry Revenue (Million), by Country 2024 & 2032
- Figure 21: Asia Pacific LNG Terminals Industry Revenue Share (%), by Country 2024 & 2032
- Figure 22: Europe LNG Terminals Industry Revenue (Million), by Terminal Type 2024 & 2032
- Figure 23: Europe LNG Terminals Industry Revenue Share (%), by Terminal Type 2024 & 2032
- Figure 24: Europe LNG Terminals Industry Revenue (Million), by Country 2024 & 2032
- Figure 25: Europe LNG Terminals Industry Revenue Share (%), by Country 2024 & 2032
- Figure 26: South America LNG Terminals Industry Revenue (Million), by Terminal Type 2024 & 2032
- Figure 27: South America LNG Terminals Industry Revenue Share (%), by Terminal Type 2024 & 2032
- Figure 28: South America LNG Terminals Industry Revenue (Million), by Country 2024 & 2032
- Figure 29: South America LNG Terminals Industry Revenue Share (%), by Country 2024 & 2032
- Figure 30: Middle East and Africa LNG Terminals Industry Revenue (Million), by Terminal Type 2024 & 2032
- Figure 31: Middle East and Africa LNG Terminals Industry Revenue Share (%), by Terminal Type 2024 & 2032
- Figure 32: Middle East and Africa LNG Terminals Industry Revenue (Million), by Country 2024 & 2032
- Figure 33: Middle East and Africa LNG Terminals Industry Revenue Share (%), by Country 2024 & 2032
List of Tables
- Table 1: Global LNG Terminals Industry Revenue Million Forecast, by Region 2019 & 2032
- Table 2: Global LNG Terminals Industry Revenue Million Forecast, by Terminal Type 2019 & 2032
- Table 3: Global LNG Terminals Industry Revenue Million Forecast, by Region 2019 & 2032
- Table 4: Global LNG Terminals Industry Revenue Million Forecast, by Country 2019 & 2032
- Table 5: United States LNG Terminals Industry Revenue (Million) Forecast, by Application 2019 & 2032
- Table 6: Canada LNG Terminals Industry Revenue (Million) Forecast, by Application 2019 & 2032
- Table 7: Mexico LNG Terminals Industry Revenue (Million) Forecast, by Application 2019 & 2032
- Table 8: Global LNG Terminals Industry Revenue Million Forecast, by Country 2019 & 2032
- Table 9: Germany LNG Terminals Industry Revenue (Million) Forecast, by Application 2019 & 2032
- Table 10: United Kingdom LNG Terminals Industry Revenue (Million) Forecast, by Application 2019 & 2032
- Table 11: France LNG Terminals Industry Revenue (Million) Forecast, by Application 2019 & 2032
- Table 12: Spain LNG Terminals Industry Revenue (Million) Forecast, by Application 2019 & 2032
- Table 13: Italy LNG Terminals Industry Revenue (Million) Forecast, by Application 2019 & 2032
- Table 14: Spain LNG Terminals Industry Revenue (Million) Forecast, by Application 2019 & 2032
- Table 15: Belgium LNG Terminals Industry Revenue (Million) Forecast, by Application 2019 & 2032
- Table 16: Netherland LNG Terminals Industry Revenue (Million) Forecast, by Application 2019 & 2032
- Table 17: Nordics LNG Terminals Industry Revenue (Million) Forecast, by Application 2019 & 2032
- Table 18: Rest of Europe LNG Terminals Industry Revenue (Million) Forecast, by Application 2019 & 2032
- Table 19: Global LNG Terminals Industry Revenue Million Forecast, by Country 2019 & 2032
- Table 20: China LNG Terminals Industry Revenue (Million) Forecast, by Application 2019 & 2032
- Table 21: Japan LNG Terminals Industry Revenue (Million) Forecast, by Application 2019 & 2032
- Table 22: India LNG Terminals Industry Revenue (Million) Forecast, by Application 2019 & 2032
- Table 23: South Korea LNG Terminals Industry Revenue (Million) Forecast, by Application 2019 & 2032
- Table 24: Southeast Asia LNG Terminals Industry Revenue (Million) Forecast, by Application 2019 & 2032
- Table 25: Australia LNG Terminals Industry Revenue (Million) Forecast, by Application 2019 & 2032
- Table 26: Indonesia LNG Terminals Industry Revenue (Million) Forecast, by Application 2019 & 2032
- Table 27: Phillipes LNG Terminals Industry Revenue (Million) Forecast, by Application 2019 & 2032
- Table 28: Singapore LNG Terminals Industry Revenue (Million) Forecast, by Application 2019 & 2032
- Table 29: Thailandc LNG Terminals Industry Revenue (Million) Forecast, by Application 2019 & 2032
- Table 30: Rest of Asia Pacific LNG Terminals Industry Revenue (Million) Forecast, by Application 2019 & 2032
- Table 31: Global LNG Terminals Industry Revenue Million Forecast, by Country 2019 & 2032
- Table 32: Brazil LNG Terminals Industry Revenue (Million) Forecast, by Application 2019 & 2032
- Table 33: Argentina LNG Terminals Industry Revenue (Million) Forecast, by Application 2019 & 2032
- Table 34: Peru LNG Terminals Industry Revenue (Million) Forecast, by Application 2019 & 2032
- Table 35: Chile LNG Terminals Industry Revenue (Million) Forecast, by Application 2019 & 2032
- Table 36: Colombia LNG Terminals Industry Revenue (Million) Forecast, by Application 2019 & 2032
- Table 37: Ecuador LNG Terminals Industry Revenue (Million) Forecast, by Application 2019 & 2032
- Table 38: Venezuela LNG Terminals Industry Revenue (Million) Forecast, by Application 2019 & 2032
- Table 39: Rest of South America LNG Terminals Industry Revenue (Million) Forecast, by Application 2019 & 2032
- Table 40: Global LNG Terminals Industry Revenue Million Forecast, by Country 2019 & 2032
- Table 41: United States LNG Terminals Industry Revenue (Million) Forecast, by Application 2019 & 2032
- Table 42: Canada LNG Terminals Industry Revenue (Million) Forecast, by Application 2019 & 2032
- Table 43: Mexico LNG Terminals Industry Revenue (Million) Forecast, by Application 2019 & 2032
- Table 44: Global LNG Terminals Industry Revenue Million Forecast, by Country 2019 & 2032
- Table 45: United Arab Emirates LNG Terminals Industry Revenue (Million) Forecast, by Application 2019 & 2032
- Table 46: Saudi Arabia LNG Terminals Industry Revenue (Million) Forecast, by Application 2019 & 2032
- Table 47: South Africa LNG Terminals Industry Revenue (Million) Forecast, by Application 2019 & 2032
- Table 48: Rest of Middle East and Africa LNG Terminals Industry Revenue (Million) Forecast, by Application 2019 & 2032
- Table 49: Global LNG Terminals Industry Revenue Million Forecast, by Terminal Type 2019 & 2032
- Table 50: Global LNG Terminals Industry Revenue Million Forecast, by Country 2019 & 2032
- Table 51: Global LNG Terminals Industry Revenue Million Forecast, by Terminal Type 2019 & 2032
- Table 52: Global LNG Terminals Industry Revenue Million Forecast, by Country 2019 & 2032
- Table 53: Global LNG Terminals Industry Revenue Million Forecast, by Terminal Type 2019 & 2032
- Table 54: Global LNG Terminals Industry Revenue Million Forecast, by Country 2019 & 2032
- Table 55: Global LNG Terminals Industry Revenue Million Forecast, by Terminal Type 2019 & 2032
- Table 56: Global LNG Terminals Industry Revenue Million Forecast, by Country 2019 & 2032
- Table 57: Global LNG Terminals Industry Revenue Million Forecast, by Terminal Type 2019 & 2032
- Table 58: Global LNG Terminals Industry Revenue Million Forecast, by Country 2019 & 2032
Frequently Asked Questions
1. What is the projected Compound Annual Growth Rate (CAGR) of the LNG Terminals Industry?
The projected CAGR is approximately 5.90%.
2. Which companies are prominent players in the LNG Terminals Industry?
Key companies in the market include Larsen & Toubro Limited, Samsung C&T Corporation, CTCI Resources Engineering Inc *List Not Exhaustive, Petronet LNG Limited, Royal Dutch Shell PLC, Tokyo Gas Co Ltd, McDermott International Inc, Egyptian Natural Gas Holding Company, Toho Gas Co Ltd.
3. What are the main segments of the LNG Terminals Industry?
The market segments include Terminal Type.
4. Can you provide details about the market size?
The market size is estimated to be USD XX Million as of 2022.
5. What are some drivers contributing to market growth?
4.; Declining Solar Panel Costs4.; Supportive Government Policies.
6. What are the notable trends driving market growth?
Floating Storage Regasification Unit to Witness Huge Growth.
7. Are there any restraints impacting market growth?
4.; High Upfront Cost.
8. Can you provide examples of recent developments in the market?
N/A
9. What pricing options are available for accessing the report?
Pricing options include single-user, multi-user, and enterprise licenses priced at USD 4750, USD 5250, and USD 8750 respectively.
10. Is the market size provided in terms of value or volume?
The market size is provided in terms of value, measured in Million.
11. Are there any specific market keywords associated with the report?
Yes, the market keyword associated with the report is "LNG Terminals Industry," which aids in identifying and referencing the specific market segment covered.
12. How do I determine which pricing option suits my needs best?
The pricing options vary based on user requirements and access needs. Individual users may opt for single-user licenses, while businesses requiring broader access may choose multi-user or enterprise licenses for cost-effective access to the report.
13. Are there any additional resources or data provided in the LNG Terminals Industry report?
While the report offers comprehensive insights, it's advisable to review the specific contents or supplementary materials provided to ascertain if additional resources or data are available.
14. How can I stay updated on further developments or reports in the LNG Terminals Industry?
To stay informed about further developments, trends, and reports in the LNG Terminals Industry, consider subscribing to industry newsletters, following relevant companies and organizations, or regularly checking reputable industry news sources and publications.
Methodology
Step 1 - Identification of Relevant Samples Size from Population Database


Step 2 - Approaches for Defining Global Market Size (Value, Volume* & Price*)

Note*: In applicable scenarios
Step 3 - Data Sources
Primary Research
- Web Analytics
- Survey Reports
- Research Institute
- Latest Research Reports
- Opinion Leaders
Secondary Research
- Annual Reports
- White Paper
- Latest Press Release
- Industry Association
- Paid Database
- Investor Presentations

Step 4 - Data Triangulation
Involves using different sources of information in order to increase the validity of a study
These sources are likely to be stakeholders in a program - participants, other researchers, program staff, other community members, and so on.
Then we put all data in single framework & apply various statistical tools to find out the dynamic on the market.
During the analysis stage, feedback from the stakeholder groups would be compared to determine areas of agreement as well as areas of divergence


