
Key Insights
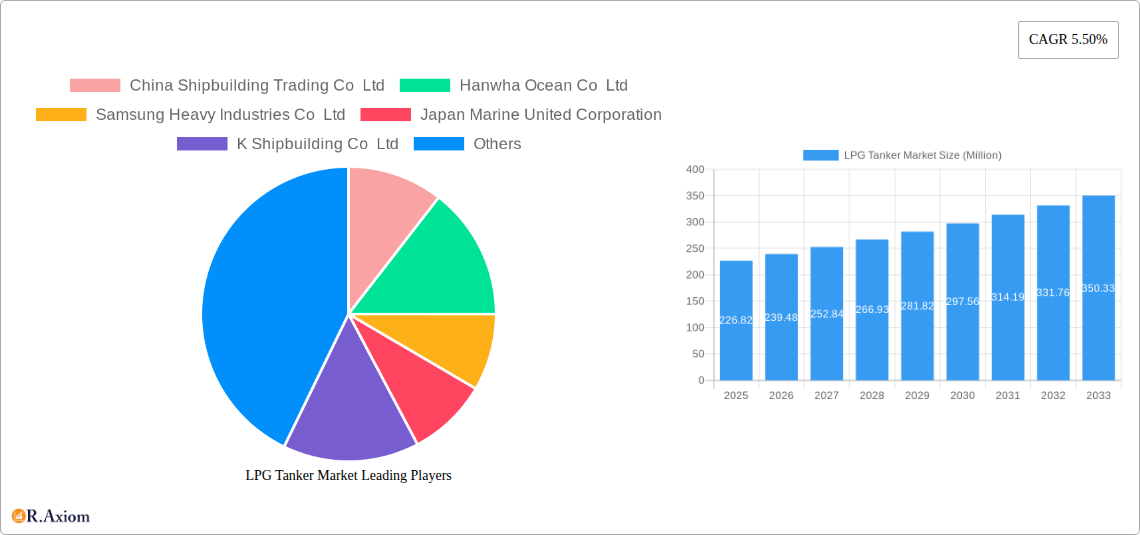
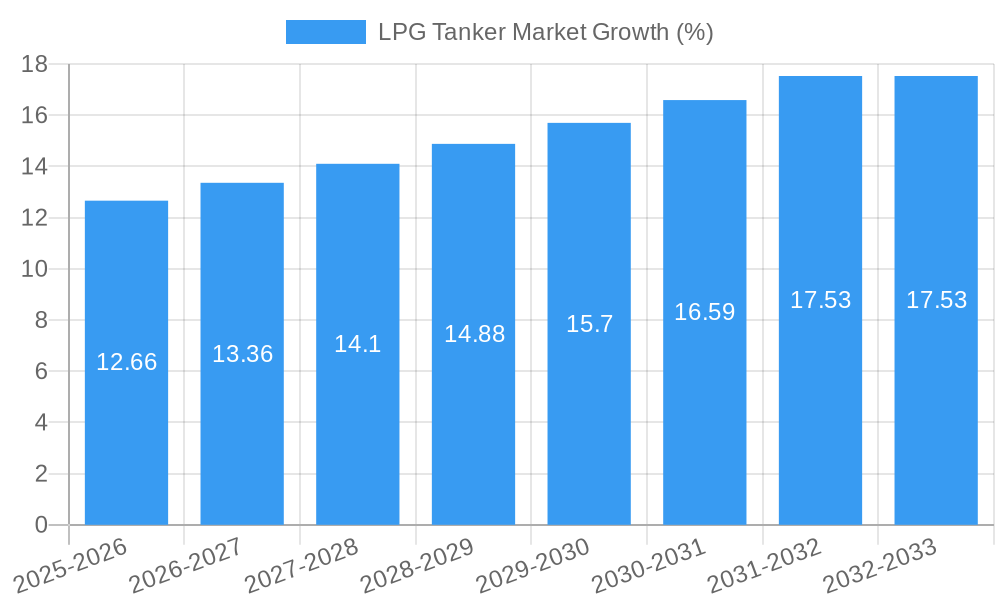
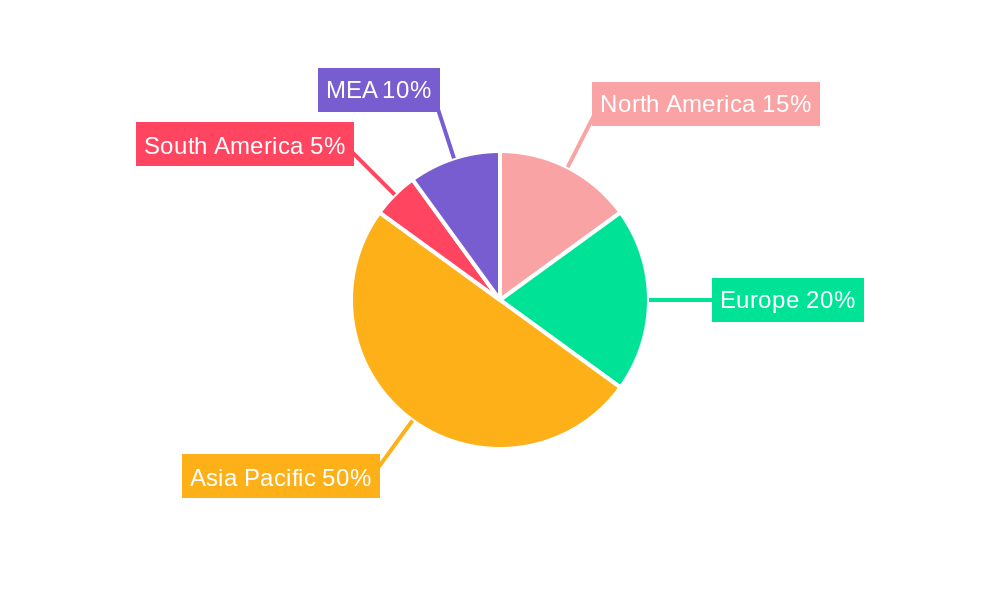
The LPG tanker market, valued at $226.82 million in 2025, is projected to experience robust growth, driven by increasing global demand for liquefied petroleum gas (LPG) and expanding energy infrastructure. A compound annual growth rate (CAGR) of 5.50% from 2025 to 2033 indicates a significant market expansion, fueled by rising consumption in developing economies and the growing adoption of LPG as a cleaner alternative fuel in various sectors, including residential, industrial, and automotive. Key market segments include Very Large Gas Carriers (VLGCs), Large Gas Carriers (LGCs), and smaller vessels, each catering to specific transportation needs. Fully pressurized and refrigerated technologies dominate the refrigeration and pressurization segment, reflecting advancements in efficiency and safety. Significant players such as China Shipbuilding Trading Co Ltd, Samsung Heavy Industries, and others compete in this dynamic market, strategically investing in new vessel construction and operational efficiencies to capitalize on growth opportunities. Regional variations in market share are expected, with Asia-Pacific likely to maintain a leading position due to its high LPG consumption and expanding infrastructure projects. However, growth in other regions, particularly North America and Europe, will contribute to the overall market expansion as sustainable energy sources gain traction.
The competitive landscape features both established players and emerging companies constantly striving for innovation and market share. Strategic partnerships, technological advancements in LPG handling and transportation, and environmental regulations related to greenhouse gas emissions will significantly shape future market trends. The increasing demand for efficient and reliable LPG transportation solutions, coupled with ongoing efforts to improve vessel designs and operational practices, will drive further market growth throughout the forecast period. Fluctuations in global LPG prices and geopolitical factors may influence market dynamics, requiring companies to adopt flexible strategies to mitigate risk and sustain profitability in this evolving sector. Growth in the smaller vessel segments is expected to outpace that of larger vessels, reflecting the rise in smaller-scale LPG distribution networks.
LPG Tanker Market: A Comprehensive Market Report (2019-2033)
This comprehensive report provides a detailed analysis of the LPG Tanker Market, encompassing historical data (2019-2024), the base year (2025), and a forecast period extending to 2033. The report offers in-depth insights into market dynamics, segmentation, competitive landscape, and future growth prospects, equipping stakeholders with actionable intelligence for strategic decision-making. This report covers a total market valued at xx Million in 2025 and is expected to reach xx Million by 2033.
LPG Tanker Market Market Concentration & Innovation
The LPG tanker market exhibits a moderately concentrated structure, with a handful of major players dominating the shipbuilding and operation segments. Key players include China Shipbuilding Trading Co Ltd, Hanwha Ocean Co Ltd, Samsung Heavy Industries Co Ltd, Japan Marine United Corporation, K Shipbuilding Co Ltd, Mitsui OSK Lines Ltd, Kawasaki Heavy Industries Ltd, HJ Shipbuilding & Construction Company Ltd, HD Hyundai Heavy Industries Co Ltd, and Mitsubishi Heavy Industries Ltd. These companies hold a combined market share of approximately xx%, reflecting significant economies of scale and technological advancements. Market concentration is influenced by factors like technological expertise, capital investment requirements, and access to financing.
Innovation is a crucial driver, with a continuous focus on enhancing vessel design, incorporating dual-fuel technologies, and improving operational efficiency to reduce emissions and enhance safety. Regulatory frameworks, particularly concerning environmental regulations (e.g., IMO 2020) and safety standards, exert significant influence on innovation and investment decisions. The presence of substitute modes of transportation (pipelines) and evolving end-user preferences (demand for cleaner fuels) further shape the market dynamics. The LPG tanker market has also witnessed several M&A activities, with deal values ranging from xx Million to xx Million in recent years, primarily focused on expanding operational capacity and geographical reach.
- Market Share: Top 10 players hold approximately xx%.
- M&A Activity: Significant transactions occurred in [Year], involving companies like [Company Name(s)] with deal values totaling xx Million.
- Innovation Focus: Dual-fuel technology, emission reduction, autonomous systems.
- Regulatory Impact: Stringent environmental standards are driving innovation.
LPG Tanker Market Industry Trends & Insights
The LPG tanker market is experiencing robust growth, driven by rising global demand for LPG, particularly in developing economies with expanding petrochemical and residential sectors. The global LPG tanker market is estimated to witness a CAGR of xx% during the forecast period (2025-2033), fueled by a surge in demand across Asia-Pacific and other emerging markets. Technological advancements, such as the adoption of larger, more efficient vessels (VLGCs) and the integration of dual-fuel engines, are enhancing operational efficiency and reducing environmental impact. However, fluctuating LPG prices, geopolitical instability, and potential economic downturns present significant challenges. The market is characterized by intense competition, with established players focusing on fleet expansion, strategic partnerships, and technological differentiation to maintain a strong market position. The market penetration of larger vessel sizes (VLGCs and LGCs) is steadily increasing due to economies of scale.
Dominant Markets & Segments in LPG Tanker Market
The Asia-Pacific region dominates the LPG tanker market, driven by rapid industrialization, rising energy consumption, and a robust infrastructure for LPG transportation. Within this region, countries like China, India, and South Korea are significant contributors to the market’s growth. The Very Large Gas Carrier (VLGC) segment constitutes a considerable portion of the market due to its cost-effectiveness for long-haul transportation. Fully pressurized and semi-pressurized technologies are prevalent for cost efficiency, while fully refrigerated and extra-refrigerated technologies are gaining traction owing to their capacity to handle specialty LPG products.
- Leading Region: Asia-Pacific
- Key Drivers (Asia-Pacific):
- Rapid industrialization and urbanization.
- Increasing energy demand.
- Government support for LPG infrastructure development.
- Dominant Vessel Size: Very Large Gas Carrier (VLGC)
- Dominant Refrigeration/Pressurization: Fully Pressurized & Semi-pressurized.
LPG Tanker Market Product Developments
Recent advancements include the introduction of dual-fuel LPG carriers, reducing reliance on traditional fuels and lowering carbon emissions. Improvements in vessel design, including optimized hull forms and advanced cargo handling systems, enhance efficiency and safety. These developments cater to the increasing demand for cost-effective and environmentally friendly LPG transportation. The incorporation of smart technologies and data analytics is enhancing operational efficiency and predictive maintenance capabilities.
Report Scope & Segmentation Analysis
This report segments the LPG tanker market based on vessel size (Very Large Gas Carrier, Large Gas Carrier, Medium Gas Carrier, Small Gas Carrier) and refrigeration/pressurization technology (Fully Pressurized, Semi-pressurized, Fully Refrigerated, Extra Refrigerated). Each segment is analyzed based on its market size, growth projections, and competitive dynamics. The VLGC segment is expected to show the highest growth, driven by economies of scale. Fully pressurized and semi-pressurized technologies dominate due to cost-effectiveness, while the fully refrigerated and extra refrigerated segments are anticipated to experience significant growth driven by increased demand for specialized LPG products.
Key Drivers of LPG Tanker Market Growth
The growth of the LPG tanker market is propelled by several factors: rising global LPG demand, particularly in emerging economies; the increasing adoption of LPG as a cleaner fuel; advancements in vessel technology, leading to greater efficiency and reduced emissions; and supportive government policies promoting LPG infrastructure development in various countries. The shift towards larger, more efficient vessels further contributes to market expansion.
Challenges in the LPG Tanker Market Sector
The LPG tanker market faces challenges including volatile LPG prices, geopolitical uncertainties impacting trade routes, and stringent environmental regulations increasing operational costs. Furthermore, the shipbuilding industry's dependence on fluctuating steel prices and skilled labor contributes to operational complexities. Supply chain disruptions and potential future economic downturns also pose significant risks to the market's sustained growth.
Emerging Opportunities in LPG Tanker Market
Emerging markets in Africa and South America present significant growth opportunities. Technological advancements such as the adoption of LNG-fuelled LPG carriers and autonomous navigation systems offer further potential for market expansion and efficiency gains. Moreover, the increasing demand for specialty LPG products and the need for eco-friendly transportation solutions will continue to drive innovation and growth in the LPG tanker market.
Leading Players in the LPG Tanker Market Market
- China Shipbuilding Trading Co Ltd
- Hanwha Ocean Co Ltd
- Samsung Heavy Industries Co Ltd
- Japan Marine United Corporation
- K Shipbuilding Co Ltd
- Mitsui OSK Lines Ltd
- Kawasaki Heavy Industries Ltd
- HJ Shipbuilding & Construction Company Ltd
- HD Hyundai Heavy Industries Co Ltd
- Mitsubishi Heavy Industries Ltd
Key Developments in LPG Tanker Market Industry
- April 2023: China delivered the world's largest dual-fuel LPG carrier, showcasing advanced design features. This signifies a shift towards environmentally friendly technologies within the industry.
- July 2023: Pertamina International Shipping (PIS) chartered four LPG carriers (Gas Walio, Gas Widuri, Gas Arjuna, and Gas Ambalat) demonstrating increased demand for LPG transportation services in the region.
Strategic Outlook for LPG Tanker Market Market
The LPG tanker market is poised for significant growth, driven by sustained global demand for LPG and technological advancements. Continued investment in larger, more efficient vessels and the adoption of cleaner fuel technologies will be key drivers of future growth. Expansion into new markets and strategic partnerships will be critical for players seeking to maintain a competitive edge. The market will continue to evolve with a focus on sustainability and operational efficiency.
LPG Tanker Market Segmentation
-
1. Vessel Size
- 1.1. Very Large Gas Carrier
- 1.2. Medium Gas Carrier
- 1.3. Small Gas Carrier
-
2. Refrigeration and Pressurization
- 2.1. Fully Pressurized
- 2.2. Semi-pressurized
- 2.3. Fully Refrigerated
- 2.4. Extra Refrigerated
LPG Tanker Market Segmentation By Geography
-
1. North America
- 1.1. United States
- 1.2. Canada
- 1.3. Rest of North America
-
2. Europe
- 2.1. Germany
- 2.2. France
- 2.3. United Kingdom
- 2.4. Italy
- 2.5. Rest of Europe
-
3. Asia Pacific
- 3.1. China
- 3.2. India
- 3.3. Australia
- 3.4. Japan
- 3.5. Rest of Asia Pacific
-
4. Middle East and Africa
- 4.1. Saudi Arabia
- 4.2. United Arab Emirates
- 4.3. South Africa
- 4.4. Rest of Middle East and Africa
-
5. South America
- 5.1. Brazil
- 5.2. Argentina
- 5.3. Chile
- 5.4. Rest of South America
LPG Tanker Market REPORT HIGHLIGHTS
| Aspects | Details |
|---|---|
| Study Period | 2019-2033 |
| Base Year | 2024 |
| Estimated Year | 2025 |
| Forecast Period | 2025-2033 |
| Historical Period | 2019-2024 |
| Growth Rate | CAGR of 5.50% from 2019-2033 |
| Segmentation |
|
Table of Contents
- 1. Introduction
- 1.1. Research Scope
- 1.2. Market Segmentation
- 1.3. Research Methodology
- 1.4. Definitions and Assumptions
- 2. Executive Summary
- 2.1. Introduction
- 3. Market Dynamics
- 3.1. Introduction
- 3.2. Market Drivers
- 3.2.1 4.; Strong Growth in Shale Gas Production 4.; Rising demand of LPG for heating
- 3.2.2 ventilation and Air conditioning
- 3.3. Market Restrains
- 3.3.1. 4.; Unstable Crude Oil Prices
- 3.4. Market Trends
- 3.4.1. Very Large Gas Carrier segment is expected to witness significant growth
- 4. Market Factor Analysis
- 4.1. Porters Five Forces
- 4.2. Supply/Value Chain
- 4.3. PESTEL analysis
- 4.4. Market Entropy
- 4.5. Patent/Trademark Analysis
- 5. Global LPG Tanker Market Analysis, Insights and Forecast, 2019-2031
- 5.1. Market Analysis, Insights and Forecast - by Vessel Size
- 5.1.1. Very Large Gas Carrier
- 5.1.2. Medium Gas Carrier
- 5.1.3. Small Gas Carrier
- 5.2. Market Analysis, Insights and Forecast - by Refrigeration and Pressurization
- 5.2.1. Fully Pressurized
- 5.2.2. Semi-pressurized
- 5.2.3. Fully Refrigerated
- 5.2.4. Extra Refrigerated
- 5.3. Market Analysis, Insights and Forecast - by Region
- 5.3.1. North America
- 5.3.2. Europe
- 5.3.3. Asia Pacific
- 5.3.4. Middle East and Africa
- 5.3.5. South America
- 5.1. Market Analysis, Insights and Forecast - by Vessel Size
- 6. North America LPG Tanker Market Analysis, Insights and Forecast, 2019-2031
- 6.1. Market Analysis, Insights and Forecast - by Vessel Size
- 6.1.1. Very Large Gas Carrier
- 6.1.2. Medium Gas Carrier
- 6.1.3. Small Gas Carrier
- 6.2. Market Analysis, Insights and Forecast - by Refrigeration and Pressurization
- 6.2.1. Fully Pressurized
- 6.2.2. Semi-pressurized
- 6.2.3. Fully Refrigerated
- 6.2.4. Extra Refrigerated
- 6.1. Market Analysis, Insights and Forecast - by Vessel Size
- 7. Europe LPG Tanker Market Analysis, Insights and Forecast, 2019-2031
- 7.1. Market Analysis, Insights and Forecast - by Vessel Size
- 7.1.1. Very Large Gas Carrier
- 7.1.2. Medium Gas Carrier
- 7.1.3. Small Gas Carrier
- 7.2. Market Analysis, Insights and Forecast - by Refrigeration and Pressurization
- 7.2.1. Fully Pressurized
- 7.2.2. Semi-pressurized
- 7.2.3. Fully Refrigerated
- 7.2.4. Extra Refrigerated
- 7.1. Market Analysis, Insights and Forecast - by Vessel Size
- 8. Asia Pacific LPG Tanker Market Analysis, Insights and Forecast, 2019-2031
- 8.1. Market Analysis, Insights and Forecast - by Vessel Size
- 8.1.1. Very Large Gas Carrier
- 8.1.2. Medium Gas Carrier
- 8.1.3. Small Gas Carrier
- 8.2. Market Analysis, Insights and Forecast - by Refrigeration and Pressurization
- 8.2.1. Fully Pressurized
- 8.2.2. Semi-pressurized
- 8.2.3. Fully Refrigerated
- 8.2.4. Extra Refrigerated
- 8.1. Market Analysis, Insights and Forecast - by Vessel Size
- 9. Middle East and Africa LPG Tanker Market Analysis, Insights and Forecast, 2019-2031
- 9.1. Market Analysis, Insights and Forecast - by Vessel Size
- 9.1.1. Very Large Gas Carrier
- 9.1.2. Medium Gas Carrier
- 9.1.3. Small Gas Carrier
- 9.2. Market Analysis, Insights and Forecast - by Refrigeration and Pressurization
- 9.2.1. Fully Pressurized
- 9.2.2. Semi-pressurized
- 9.2.3. Fully Refrigerated
- 9.2.4. Extra Refrigerated
- 9.1. Market Analysis, Insights and Forecast - by Vessel Size
- 10. South America LPG Tanker Market Analysis, Insights and Forecast, 2019-2031
- 10.1. Market Analysis, Insights and Forecast - by Vessel Size
- 10.1.1. Very Large Gas Carrier
- 10.1.2. Medium Gas Carrier
- 10.1.3. Small Gas Carrier
- 10.2. Market Analysis, Insights and Forecast - by Refrigeration and Pressurization
- 10.2.1. Fully Pressurized
- 10.2.2. Semi-pressurized
- 10.2.3. Fully Refrigerated
- 10.2.4. Extra Refrigerated
- 10.1. Market Analysis, Insights and Forecast - by Vessel Size
- 11. North America LPG Tanker Market Analysis, Insights and Forecast, 2019-2031
- 11.1. Market Analysis, Insights and Forecast - By Country/Sub-region
- 11.1.1 United States
- 11.1.2 Canada
- 11.1.3 Mexico
- 12. Europe LPG Tanker Market Analysis, Insights and Forecast, 2019-2031
- 12.1. Market Analysis, Insights and Forecast - By Country/Sub-region
- 12.1.1 Germany
- 12.1.2 United Kingdom
- 12.1.3 France
- 12.1.4 Spain
- 12.1.5 Italy
- 12.1.6 Spain
- 12.1.7 Belgium
- 12.1.8 Netherland
- 12.1.9 Nordics
- 12.1.10 Rest of Europe
- 13. Asia Pacific LPG Tanker Market Analysis, Insights and Forecast, 2019-2031
- 13.1. Market Analysis, Insights and Forecast - By Country/Sub-region
- 13.1.1 China
- 13.1.2 Japan
- 13.1.3 India
- 13.1.4 South Korea
- 13.1.5 Southeast Asia
- 13.1.6 Australia
- 13.1.7 Indonesia
- 13.1.8 Phillipes
- 13.1.9 Singapore
- 13.1.10 Thailandc
- 13.1.11 Rest of Asia Pacific
- 14. South America LPG Tanker Market Analysis, Insights and Forecast, 2019-2031
- 14.1. Market Analysis, Insights and Forecast - By Country/Sub-region
- 14.1.1 Brazil
- 14.1.2 Argentina
- 14.1.3 Peru
- 14.1.4 Chile
- 14.1.5 Colombia
- 14.1.6 Ecuador
- 14.1.7 Venezuela
- 14.1.8 Rest of South America
- 15. MEA LPG Tanker Market Analysis, Insights and Forecast, 2019-2031
- 15.1. Market Analysis, Insights and Forecast - By Country/Sub-region
- 15.1.1 United Arab Emirates
- 15.1.2 Saudi Arabia
- 15.1.3 South Africa
- 15.1.4 Rest of Middle East and Africa
- 16. Competitive Analysis
- 16.1. Global Market Share Analysis 2024
- 16.2. Company Profiles
- 16.2.1 China Shipbuilding Trading Co Ltd
- 16.2.1.1. Overview
- 16.2.1.2. Products
- 16.2.1.3. SWOT Analysis
- 16.2.1.4. Recent Developments
- 16.2.1.5. Financials (Based on Availability)
- 16.2.2 Hanwha Ocean Co Ltd
- 16.2.2.1. Overview
- 16.2.2.2. Products
- 16.2.2.3. SWOT Analysis
- 16.2.2.4. Recent Developments
- 16.2.2.5. Financials (Based on Availability)
- 16.2.3 Samsung Heavy Industries Co Ltd
- 16.2.3.1. Overview
- 16.2.3.2. Products
- 16.2.3.3. SWOT Analysis
- 16.2.3.4. Recent Developments
- 16.2.3.5. Financials (Based on Availability)
- 16.2.4 Japan Marine United Corporation
- 16.2.4.1. Overview
- 16.2.4.2. Products
- 16.2.4.3. SWOT Analysis
- 16.2.4.4. Recent Developments
- 16.2.4.5. Financials (Based on Availability)
- 16.2.5 K Shipbuilding Co Ltd
- 16.2.5.1. Overview
- 16.2.5.2. Products
- 16.2.5.3. SWOT Analysis
- 16.2.5.4. Recent Developments
- 16.2.5.5. Financials (Based on Availability)
- 16.2.6 Mitsui OSK Lines Ltd
- 16.2.6.1. Overview
- 16.2.6.2. Products
- 16.2.6.3. SWOT Analysis
- 16.2.6.4. Recent Developments
- 16.2.6.5. Financials (Based on Availability)
- 16.2.7 Kawasaki Heavy Industries Ltd
- 16.2.7.1. Overview
- 16.2.7.2. Products
- 16.2.7.3. SWOT Analysis
- 16.2.7.4. Recent Developments
- 16.2.7.5. Financials (Based on Availability)
- 16.2.8 HJ Shipbuilding & Construction Company Ltd
- 16.2.8.1. Overview
- 16.2.8.2. Products
- 16.2.8.3. SWOT Analysis
- 16.2.8.4. Recent Developments
- 16.2.8.5. Financials (Based on Availability)
- 16.2.9 HD Hyundai Heavy Industries Co Ltd
- 16.2.9.1. Overview
- 16.2.9.2. Products
- 16.2.9.3. SWOT Analysis
- 16.2.9.4. Recent Developments
- 16.2.9.5. Financials (Based on Availability)
- 16.2.10 Mitsubishi Heavy Industries Ltd
- 16.2.10.1. Overview
- 16.2.10.2. Products
- 16.2.10.3. SWOT Analysis
- 16.2.10.4. Recent Developments
- 16.2.10.5. Financials (Based on Availability)
- 16.2.1 China Shipbuilding Trading Co Ltd
List of Figures
- Figure 1: Global LPG Tanker Market Revenue Breakdown (Million, %) by Region 2024 & 2032
- Figure 2: Global LPG Tanker Market Volume Breakdown (K Unit, %) by Region 2024 & 2032
- Figure 3: North America LPG Tanker Market Revenue (Million), by Country 2024 & 2032
- Figure 4: North America LPG Tanker Market Volume (K Unit), by Country 2024 & 2032
- Figure 5: North America LPG Tanker Market Revenue Share (%), by Country 2024 & 2032
- Figure 6: North America LPG Tanker Market Volume Share (%), by Country 2024 & 2032
- Figure 7: Europe LPG Tanker Market Revenue (Million), by Country 2024 & 2032
- Figure 8: Europe LPG Tanker Market Volume (K Unit), by Country 2024 & 2032
- Figure 9: Europe LPG Tanker Market Revenue Share (%), by Country 2024 & 2032
- Figure 10: Europe LPG Tanker Market Volume Share (%), by Country 2024 & 2032
- Figure 11: Asia Pacific LPG Tanker Market Revenue (Million), by Country 2024 & 2032
- Figure 12: Asia Pacific LPG Tanker Market Volume (K Unit), by Country 2024 & 2032
- Figure 13: Asia Pacific LPG Tanker Market Revenue Share (%), by Country 2024 & 2032
- Figure 14: Asia Pacific LPG Tanker Market Volume Share (%), by Country 2024 & 2032
- Figure 15: South America LPG Tanker Market Revenue (Million), by Country 2024 & 2032
- Figure 16: South America LPG Tanker Market Volume (K Unit), by Country 2024 & 2032
- Figure 17: South America LPG Tanker Market Revenue Share (%), by Country 2024 & 2032
- Figure 18: South America LPG Tanker Market Volume Share (%), by Country 2024 & 2032
- Figure 19: MEA LPG Tanker Market Revenue (Million), by Country 2024 & 2032
- Figure 20: MEA LPG Tanker Market Volume (K Unit), by Country 2024 & 2032
- Figure 21: MEA LPG Tanker Market Revenue Share (%), by Country 2024 & 2032
- Figure 22: MEA LPG Tanker Market Volume Share (%), by Country 2024 & 2032
- Figure 23: North America LPG Tanker Market Revenue (Million), by Vessel Size 2024 & 2032
- Figure 24: North America LPG Tanker Market Volume (K Unit), by Vessel Size 2024 & 2032
- Figure 25: North America LPG Tanker Market Revenue Share (%), by Vessel Size 2024 & 2032
- Figure 26: North America LPG Tanker Market Volume Share (%), by Vessel Size 2024 & 2032
- Figure 27: North America LPG Tanker Market Revenue (Million), by Refrigeration and Pressurization 2024 & 2032
- Figure 28: North America LPG Tanker Market Volume (K Unit), by Refrigeration and Pressurization 2024 & 2032
- Figure 29: North America LPG Tanker Market Revenue Share (%), by Refrigeration and Pressurization 2024 & 2032
- Figure 30: North America LPG Tanker Market Volume Share (%), by Refrigeration and Pressurization 2024 & 2032
- Figure 31: North America LPG Tanker Market Revenue (Million), by Country 2024 & 2032
- Figure 32: North America LPG Tanker Market Volume (K Unit), by Country 2024 & 2032
- Figure 33: North America LPG Tanker Market Revenue Share (%), by Country 2024 & 2032
- Figure 34: North America LPG Tanker Market Volume Share (%), by Country 2024 & 2032
- Figure 35: Europe LPG Tanker Market Revenue (Million), by Vessel Size 2024 & 2032
- Figure 36: Europe LPG Tanker Market Volume (K Unit), by Vessel Size 2024 & 2032
- Figure 37: Europe LPG Tanker Market Revenue Share (%), by Vessel Size 2024 & 2032
- Figure 38: Europe LPG Tanker Market Volume Share (%), by Vessel Size 2024 & 2032
- Figure 39: Europe LPG Tanker Market Revenue (Million), by Refrigeration and Pressurization 2024 & 2032
- Figure 40: Europe LPG Tanker Market Volume (K Unit), by Refrigeration and Pressurization 2024 & 2032
- Figure 41: Europe LPG Tanker Market Revenue Share (%), by Refrigeration and Pressurization 2024 & 2032
- Figure 42: Europe LPG Tanker Market Volume Share (%), by Refrigeration and Pressurization 2024 & 2032
- Figure 43: Europe LPG Tanker Market Revenue (Million), by Country 2024 & 2032
- Figure 44: Europe LPG Tanker Market Volume (K Unit), by Country 2024 & 2032
- Figure 45: Europe LPG Tanker Market Revenue Share (%), by Country 2024 & 2032
- Figure 46: Europe LPG Tanker Market Volume Share (%), by Country 2024 & 2032
- Figure 47: Asia Pacific LPG Tanker Market Revenue (Million), by Vessel Size 2024 & 2032
- Figure 48: Asia Pacific LPG Tanker Market Volume (K Unit), by Vessel Size 2024 & 2032
- Figure 49: Asia Pacific LPG Tanker Market Revenue Share (%), by Vessel Size 2024 & 2032
- Figure 50: Asia Pacific LPG Tanker Market Volume Share (%), by Vessel Size 2024 & 2032
- Figure 51: Asia Pacific LPG Tanker Market Revenue (Million), by Refrigeration and Pressurization 2024 & 2032
- Figure 52: Asia Pacific LPG Tanker Market Volume (K Unit), by Refrigeration and Pressurization 2024 & 2032
- Figure 53: Asia Pacific LPG Tanker Market Revenue Share (%), by Refrigeration and Pressurization 2024 & 2032
- Figure 54: Asia Pacific LPG Tanker Market Volume Share (%), by Refrigeration and Pressurization 2024 & 2032
- Figure 55: Asia Pacific LPG Tanker Market Revenue (Million), by Country 2024 & 2032
- Figure 56: Asia Pacific LPG Tanker Market Volume (K Unit), by Country 2024 & 2032
- Figure 57: Asia Pacific LPG Tanker Market Revenue Share (%), by Country 2024 & 2032
- Figure 58: Asia Pacific LPG Tanker Market Volume Share (%), by Country 2024 & 2032
- Figure 59: Middle East and Africa LPG Tanker Market Revenue (Million), by Vessel Size 2024 & 2032
- Figure 60: Middle East and Africa LPG Tanker Market Volume (K Unit), by Vessel Size 2024 & 2032
- Figure 61: Middle East and Africa LPG Tanker Market Revenue Share (%), by Vessel Size 2024 & 2032
- Figure 62: Middle East and Africa LPG Tanker Market Volume Share (%), by Vessel Size 2024 & 2032
- Figure 63: Middle East and Africa LPG Tanker Market Revenue (Million), by Refrigeration and Pressurization 2024 & 2032
- Figure 64: Middle East and Africa LPG Tanker Market Volume (K Unit), by Refrigeration and Pressurization 2024 & 2032
- Figure 65: Middle East and Africa LPG Tanker Market Revenue Share (%), by Refrigeration and Pressurization 2024 & 2032
- Figure 66: Middle East and Africa LPG Tanker Market Volume Share (%), by Refrigeration and Pressurization 2024 & 2032
- Figure 67: Middle East and Africa LPG Tanker Market Revenue (Million), by Country 2024 & 2032
- Figure 68: Middle East and Africa LPG Tanker Market Volume (K Unit), by Country 2024 & 2032
- Figure 69: Middle East and Africa LPG Tanker Market Revenue Share (%), by Country 2024 & 2032
- Figure 70: Middle East and Africa LPG Tanker Market Volume Share (%), by Country 2024 & 2032
- Figure 71: South America LPG Tanker Market Revenue (Million), by Vessel Size 2024 & 2032
- Figure 72: South America LPG Tanker Market Volume (K Unit), by Vessel Size 2024 & 2032
- Figure 73: South America LPG Tanker Market Revenue Share (%), by Vessel Size 2024 & 2032
- Figure 74: South America LPG Tanker Market Volume Share (%), by Vessel Size 2024 & 2032
- Figure 75: South America LPG Tanker Market Revenue (Million), by Refrigeration and Pressurization 2024 & 2032
- Figure 76: South America LPG Tanker Market Volume (K Unit), by Refrigeration and Pressurization 2024 & 2032
- Figure 77: South America LPG Tanker Market Revenue Share (%), by Refrigeration and Pressurization 2024 & 2032
- Figure 78: South America LPG Tanker Market Volume Share (%), by Refrigeration and Pressurization 2024 & 2032
- Figure 79: South America LPG Tanker Market Revenue (Million), by Country 2024 & 2032
- Figure 80: South America LPG Tanker Market Volume (K Unit), by Country 2024 & 2032
- Figure 81: South America LPG Tanker Market Revenue Share (%), by Country 2024 & 2032
- Figure 82: South America LPG Tanker Market Volume Share (%), by Country 2024 & 2032
List of Tables
- Table 1: Global LPG Tanker Market Revenue Million Forecast, by Region 2019 & 2032
- Table 2: Global LPG Tanker Market Volume K Unit Forecast, by Region 2019 & 2032
- Table 3: Global LPG Tanker Market Revenue Million Forecast, by Vessel Size 2019 & 2032
- Table 4: Global LPG Tanker Market Volume K Unit Forecast, by Vessel Size 2019 & 2032
- Table 5: Global LPG Tanker Market Revenue Million Forecast, by Refrigeration and Pressurization 2019 & 2032
- Table 6: Global LPG Tanker Market Volume K Unit Forecast, by Refrigeration and Pressurization 2019 & 2032
- Table 7: Global LPG Tanker Market Revenue Million Forecast, by Region 2019 & 2032
- Table 8: Global LPG Tanker Market Volume K Unit Forecast, by Region 2019 & 2032
- Table 9: Global LPG Tanker Market Revenue Million Forecast, by Country 2019 & 2032
- Table 10: Global LPG Tanker Market Volume K Unit Forecast, by Country 2019 & 2032
- Table 11: United States LPG Tanker Market Revenue (Million) Forecast, by Application 2019 & 2032
- Table 12: United States LPG Tanker Market Volume (K Unit) Forecast, by Application 2019 & 2032
- Table 13: Canada LPG Tanker Market Revenue (Million) Forecast, by Application 2019 & 2032
- Table 14: Canada LPG Tanker Market Volume (K Unit) Forecast, by Application 2019 & 2032
- Table 15: Mexico LPG Tanker Market Revenue (Million) Forecast, by Application 2019 & 2032
- Table 16: Mexico LPG Tanker Market Volume (K Unit) Forecast, by Application 2019 & 2032
- Table 17: Global LPG Tanker Market Revenue Million Forecast, by Country 2019 & 2032
- Table 18: Global LPG Tanker Market Volume K Unit Forecast, by Country 2019 & 2032
- Table 19: Germany LPG Tanker Market Revenue (Million) Forecast, by Application 2019 & 2032
- Table 20: Germany LPG Tanker Market Volume (K Unit) Forecast, by Application 2019 & 2032
- Table 21: United Kingdom LPG Tanker Market Revenue (Million) Forecast, by Application 2019 & 2032
- Table 22: United Kingdom LPG Tanker Market Volume (K Unit) Forecast, by Application 2019 & 2032
- Table 23: France LPG Tanker Market Revenue (Million) Forecast, by Application 2019 & 2032
- Table 24: France LPG Tanker Market Volume (K Unit) Forecast, by Application 2019 & 2032
- Table 25: Spain LPG Tanker Market Revenue (Million) Forecast, by Application 2019 & 2032
- Table 26: Spain LPG Tanker Market Volume (K Unit) Forecast, by Application 2019 & 2032
- Table 27: Italy LPG Tanker Market Revenue (Million) Forecast, by Application 2019 & 2032
- Table 28: Italy LPG Tanker Market Volume (K Unit) Forecast, by Application 2019 & 2032
- Table 29: Spain LPG Tanker Market Revenue (Million) Forecast, by Application 2019 & 2032
- Table 30: Spain LPG Tanker Market Volume (K Unit) Forecast, by Application 2019 & 2032
- Table 31: Belgium LPG Tanker Market Revenue (Million) Forecast, by Application 2019 & 2032
- Table 32: Belgium LPG Tanker Market Volume (K Unit) Forecast, by Application 2019 & 2032
- Table 33: Netherland LPG Tanker Market Revenue (Million) Forecast, by Application 2019 & 2032
- Table 34: Netherland LPG Tanker Market Volume (K Unit) Forecast, by Application 2019 & 2032
- Table 35: Nordics LPG Tanker Market Revenue (Million) Forecast, by Application 2019 & 2032
- Table 36: Nordics LPG Tanker Market Volume (K Unit) Forecast, by Application 2019 & 2032
- Table 37: Rest of Europe LPG Tanker Market Revenue (Million) Forecast, by Application 2019 & 2032
- Table 38: Rest of Europe LPG Tanker Market Volume (K Unit) Forecast, by Application 2019 & 2032
- Table 39: Global LPG Tanker Market Revenue Million Forecast, by Country 2019 & 2032
- Table 40: Global LPG Tanker Market Volume K Unit Forecast, by Country 2019 & 2032
- Table 41: China LPG Tanker Market Revenue (Million) Forecast, by Application 2019 & 2032
- Table 42: China LPG Tanker Market Volume (K Unit) Forecast, by Application 2019 & 2032
- Table 43: Japan LPG Tanker Market Revenue (Million) Forecast, by Application 2019 & 2032
- Table 44: Japan LPG Tanker Market Volume (K Unit) Forecast, by Application 2019 & 2032
- Table 45: India LPG Tanker Market Revenue (Million) Forecast, by Application 2019 & 2032
- Table 46: India LPG Tanker Market Volume (K Unit) Forecast, by Application 2019 & 2032
- Table 47: South Korea LPG Tanker Market Revenue (Million) Forecast, by Application 2019 & 2032
- Table 48: South Korea LPG Tanker Market Volume (K Unit) Forecast, by Application 2019 & 2032
- Table 49: Southeast Asia LPG Tanker Market Revenue (Million) Forecast, by Application 2019 & 2032
- Table 50: Southeast Asia LPG Tanker Market Volume (K Unit) Forecast, by Application 2019 & 2032
- Table 51: Australia LPG Tanker Market Revenue (Million) Forecast, by Application 2019 & 2032
- Table 52: Australia LPG Tanker Market Volume (K Unit) Forecast, by Application 2019 & 2032
- Table 53: Indonesia LPG Tanker Market Revenue (Million) Forecast, by Application 2019 & 2032
- Table 54: Indonesia LPG Tanker Market Volume (K Unit) Forecast, by Application 2019 & 2032
- Table 55: Phillipes LPG Tanker Market Revenue (Million) Forecast, by Application 2019 & 2032
- Table 56: Phillipes LPG Tanker Market Volume (K Unit) Forecast, by Application 2019 & 2032
- Table 57: Singapore LPG Tanker Market Revenue (Million) Forecast, by Application 2019 & 2032
- Table 58: Singapore LPG Tanker Market Volume (K Unit) Forecast, by Application 2019 & 2032
- Table 59: Thailandc LPG Tanker Market Revenue (Million) Forecast, by Application 2019 & 2032
- Table 60: Thailandc LPG Tanker Market Volume (K Unit) Forecast, by Application 2019 & 2032
- Table 61: Rest of Asia Pacific LPG Tanker Market Revenue (Million) Forecast, by Application 2019 & 2032
- Table 62: Rest of Asia Pacific LPG Tanker Market Volume (K Unit) Forecast, by Application 2019 & 2032
- Table 63: Global LPG Tanker Market Revenue Million Forecast, by Country 2019 & 2032
- Table 64: Global LPG Tanker Market Volume K Unit Forecast, by Country 2019 & 2032
- Table 65: Brazil LPG Tanker Market Revenue (Million) Forecast, by Application 2019 & 2032
- Table 66: Brazil LPG Tanker Market Volume (K Unit) Forecast, by Application 2019 & 2032
- Table 67: Argentina LPG Tanker Market Revenue (Million) Forecast, by Application 2019 & 2032
- Table 68: Argentina LPG Tanker Market Volume (K Unit) Forecast, by Application 2019 & 2032
- Table 69: Peru LPG Tanker Market Revenue (Million) Forecast, by Application 2019 & 2032
- Table 70: Peru LPG Tanker Market Volume (K Unit) Forecast, by Application 2019 & 2032
- Table 71: Chile LPG Tanker Market Revenue (Million) Forecast, by Application 2019 & 2032
- Table 72: Chile LPG Tanker Market Volume (K Unit) Forecast, by Application 2019 & 2032
- Table 73: Colombia LPG Tanker Market Revenue (Million) Forecast, by Application 2019 & 2032
- Table 74: Colombia LPG Tanker Market Volume (K Unit) Forecast, by Application 2019 & 2032
- Table 75: Ecuador LPG Tanker Market Revenue (Million) Forecast, by Application 2019 & 2032
- Table 76: Ecuador LPG Tanker Market Volume (K Unit) Forecast, by Application 2019 & 2032
- Table 77: Venezuela LPG Tanker Market Revenue (Million) Forecast, by Application 2019 & 2032
- Table 78: Venezuela LPG Tanker Market Volume (K Unit) Forecast, by Application 2019 & 2032
- Table 79: Rest of South America LPG Tanker Market Revenue (Million) Forecast, by Application 2019 & 2032
- Table 80: Rest of South America LPG Tanker Market Volume (K Unit) Forecast, by Application 2019 & 2032
- Table 81: Global LPG Tanker Market Revenue Million Forecast, by Country 2019 & 2032
- Table 82: Global LPG Tanker Market Volume K Unit Forecast, by Country 2019 & 2032
- Table 83: United Arab Emirates LPG Tanker Market Revenue (Million) Forecast, by Application 2019 & 2032
- Table 84: United Arab Emirates LPG Tanker Market Volume (K Unit) Forecast, by Application 2019 & 2032
- Table 85: Saudi Arabia LPG Tanker Market Revenue (Million) Forecast, by Application 2019 & 2032
- Table 86: Saudi Arabia LPG Tanker Market Volume (K Unit) Forecast, by Application 2019 & 2032
- Table 87: South Africa LPG Tanker Market Revenue (Million) Forecast, by Application 2019 & 2032
- Table 88: South Africa LPG Tanker Market Volume (K Unit) Forecast, by Application 2019 & 2032
- Table 89: Rest of Middle East and Africa LPG Tanker Market Revenue (Million) Forecast, by Application 2019 & 2032
- Table 90: Rest of Middle East and Africa LPG Tanker Market Volume (K Unit) Forecast, by Application 2019 & 2032
- Table 91: Global LPG Tanker Market Revenue Million Forecast, by Vessel Size 2019 & 2032
- Table 92: Global LPG Tanker Market Volume K Unit Forecast, by Vessel Size 2019 & 2032
- Table 93: Global LPG Tanker Market Revenue Million Forecast, by Refrigeration and Pressurization 2019 & 2032
- Table 94: Global LPG Tanker Market Volume K Unit Forecast, by Refrigeration and Pressurization 2019 & 2032
- Table 95: Global LPG Tanker Market Revenue Million Forecast, by Country 2019 & 2032
- Table 96: Global LPG Tanker Market Volume K Unit Forecast, by Country 2019 & 2032
- Table 97: United States LPG Tanker Market Revenue (Million) Forecast, by Application 2019 & 2032
- Table 98: United States LPG Tanker Market Volume (K Unit) Forecast, by Application 2019 & 2032
- Table 99: Canada LPG Tanker Market Revenue (Million) Forecast, by Application 2019 & 2032
- Table 100: Canada LPG Tanker Market Volume (K Unit) Forecast, by Application 2019 & 2032
- Table 101: Rest of North America LPG Tanker Market Revenue (Million) Forecast, by Application 2019 & 2032
- Table 102: Rest of North America LPG Tanker Market Volume (K Unit) Forecast, by Application 2019 & 2032
- Table 103: Global LPG Tanker Market Revenue Million Forecast, by Vessel Size 2019 & 2032
- Table 104: Global LPG Tanker Market Volume K Unit Forecast, by Vessel Size 2019 & 2032
- Table 105: Global LPG Tanker Market Revenue Million Forecast, by Refrigeration and Pressurization 2019 & 2032
- Table 106: Global LPG Tanker Market Volume K Unit Forecast, by Refrigeration and Pressurization 2019 & 2032
- Table 107: Global LPG Tanker Market Revenue Million Forecast, by Country 2019 & 2032
- Table 108: Global LPG Tanker Market Volume K Unit Forecast, by Country 2019 & 2032
- Table 109: Germany LPG Tanker Market Revenue (Million) Forecast, by Application 2019 & 2032
- Table 110: Germany LPG Tanker Market Volume (K Unit) Forecast, by Application 2019 & 2032
- Table 111: France LPG Tanker Market Revenue (Million) Forecast, by Application 2019 & 2032
- Table 112: France LPG Tanker Market Volume (K Unit) Forecast, by Application 2019 & 2032
- Table 113: United Kingdom LPG Tanker Market Revenue (Million) Forecast, by Application 2019 & 2032
- Table 114: United Kingdom LPG Tanker Market Volume (K Unit) Forecast, by Application 2019 & 2032
- Table 115: Italy LPG Tanker Market Revenue (Million) Forecast, by Application 2019 & 2032
- Table 116: Italy LPG Tanker Market Volume (K Unit) Forecast, by Application 2019 & 2032
- Table 117: Rest of Europe LPG Tanker Market Revenue (Million) Forecast, by Application 2019 & 2032
- Table 118: Rest of Europe LPG Tanker Market Volume (K Unit) Forecast, by Application 2019 & 2032
- Table 119: Global LPG Tanker Market Revenue Million Forecast, by Vessel Size 2019 & 2032
- Table 120: Global LPG Tanker Market Volume K Unit Forecast, by Vessel Size 2019 & 2032
- Table 121: Global LPG Tanker Market Revenue Million Forecast, by Refrigeration and Pressurization 2019 & 2032
- Table 122: Global LPG Tanker Market Volume K Unit Forecast, by Refrigeration and Pressurization 2019 & 2032
- Table 123: Global LPG Tanker Market Revenue Million Forecast, by Country 2019 & 2032
- Table 124: Global LPG Tanker Market Volume K Unit Forecast, by Country 2019 & 2032
- Table 125: China LPG Tanker Market Revenue (Million) Forecast, by Application 2019 & 2032
- Table 126: China LPG Tanker Market Volume (K Unit) Forecast, by Application 2019 & 2032
- Table 127: India LPG Tanker Market Revenue (Million) Forecast, by Application 2019 & 2032
- Table 128: India LPG Tanker Market Volume (K Unit) Forecast, by Application 2019 & 2032
- Table 129: Australia LPG Tanker Market Revenue (Million) Forecast, by Application 2019 & 2032
- Table 130: Australia LPG Tanker Market Volume (K Unit) Forecast, by Application 2019 & 2032
- Table 131: Japan LPG Tanker Market Revenue (Million) Forecast, by Application 2019 & 2032
- Table 132: Japan LPG Tanker Market Volume (K Unit) Forecast, by Application 2019 & 2032
- Table 133: Rest of Asia Pacific LPG Tanker Market Revenue (Million) Forecast, by Application 2019 & 2032
- Table 134: Rest of Asia Pacific LPG Tanker Market Volume (K Unit) Forecast, by Application 2019 & 2032
- Table 135: Global LPG Tanker Market Revenue Million Forecast, by Vessel Size 2019 & 2032
- Table 136: Global LPG Tanker Market Volume K Unit Forecast, by Vessel Size 2019 & 2032
- Table 137: Global LPG Tanker Market Revenue Million Forecast, by Refrigeration and Pressurization 2019 & 2032
- Table 138: Global LPG Tanker Market Volume K Unit Forecast, by Refrigeration and Pressurization 2019 & 2032
- Table 139: Global LPG Tanker Market Revenue Million Forecast, by Country 2019 & 2032
- Table 140: Global LPG Tanker Market Volume K Unit Forecast, by Country 2019 & 2032
- Table 141: Saudi Arabia LPG Tanker Market Revenue (Million) Forecast, by Application 2019 & 2032
- Table 142: Saudi Arabia LPG Tanker Market Volume (K Unit) Forecast, by Application 2019 & 2032
- Table 143: United Arab Emirates LPG Tanker Market Revenue (Million) Forecast, by Application 2019 & 2032
- Table 144: United Arab Emirates LPG Tanker Market Volume (K Unit) Forecast, by Application 2019 & 2032
- Table 145: South Africa LPG Tanker Market Revenue (Million) Forecast, by Application 2019 & 2032
- Table 146: South Africa LPG Tanker Market Volume (K Unit) Forecast, by Application 2019 & 2032
- Table 147: Rest of Middle East and Africa LPG Tanker Market Revenue (Million) Forecast, by Application 2019 & 2032
- Table 148: Rest of Middle East and Africa LPG Tanker Market Volume (K Unit) Forecast, by Application 2019 & 2032
- Table 149: Global LPG Tanker Market Revenue Million Forecast, by Vessel Size 2019 & 2032
- Table 150: Global LPG Tanker Market Volume K Unit Forecast, by Vessel Size 2019 & 2032
- Table 151: Global LPG Tanker Market Revenue Million Forecast, by Refrigeration and Pressurization 2019 & 2032
- Table 152: Global LPG Tanker Market Volume K Unit Forecast, by Refrigeration and Pressurization 2019 & 2032
- Table 153: Global LPG Tanker Market Revenue Million Forecast, by Country 2019 & 2032
- Table 154: Global LPG Tanker Market Volume K Unit Forecast, by Country 2019 & 2032
- Table 155: Brazil LPG Tanker Market Revenue (Million) Forecast, by Application 2019 & 2032
- Table 156: Brazil LPG Tanker Market Volume (K Unit) Forecast, by Application 2019 & 2032
- Table 157: Argentina LPG Tanker Market Revenue (Million) Forecast, by Application 2019 & 2032
- Table 158: Argentina LPG Tanker Market Volume (K Unit) Forecast, by Application 2019 & 2032
- Table 159: Chile LPG Tanker Market Revenue (Million) Forecast, by Application 2019 & 2032
- Table 160: Chile LPG Tanker Market Volume (K Unit) Forecast, by Application 2019 & 2032
- Table 161: Rest of South America LPG Tanker Market Revenue (Million) Forecast, by Application 2019 & 2032
- Table 162: Rest of South America LPG Tanker Market Volume (K Unit) Forecast, by Application 2019 & 2032
Frequently Asked Questions
1. What is the projected Compound Annual Growth Rate (CAGR) of the LPG Tanker Market?
The projected CAGR is approximately 5.50%.
2. Which companies are prominent players in the LPG Tanker Market?
Key companies in the market include China Shipbuilding Trading Co Ltd, Hanwha Ocean Co Ltd, Samsung Heavy Industries Co Ltd, Japan Marine United Corporation, K Shipbuilding Co Ltd, Mitsui OSK Lines Ltd, Kawasaki Heavy Industries Ltd, HJ Shipbuilding & Construction Company Ltd, HD Hyundai Heavy Industries Co Ltd, Mitsubishi Heavy Industries Ltd.
3. What are the main segments of the LPG Tanker Market?
The market segments include Vessel Size, Refrigeration and Pressurization.
4. Can you provide details about the market size?
The market size is estimated to be USD 226.82 Million as of 2022.
5. What are some drivers contributing to market growth?
4.; Strong Growth in Shale Gas Production 4.; Rising demand of LPG for heating. ventilation and Air conditioning.
6. What are the notable trends driving market growth?
Very Large Gas Carrier segment is expected to witness significant growth.
7. Are there any restraints impacting market growth?
4.; Unstable Crude Oil Prices.
8. Can you provide examples of recent developments in the market?
July 2023: Indonesia's Pertamina International Shipping (PIS) agreed to hire four LPG carriers named Gas Walio, Gas Widuri, Gas Arjuna, and Gas Ambalat LPG via its PIS Middle East subsidiary to three companies.
9. What pricing options are available for accessing the report?
Pricing options include single-user, multi-user, and enterprise licenses priced at USD 4750, USD 5250, and USD 8750 respectively.
10. Is the market size provided in terms of value or volume?
The market size is provided in terms of value, measured in Million and volume, measured in K Unit.
11. Are there any specific market keywords associated with the report?
Yes, the market keyword associated with the report is "LPG Tanker Market," which aids in identifying and referencing the specific market segment covered.
12. How do I determine which pricing option suits my needs best?
The pricing options vary based on user requirements and access needs. Individual users may opt for single-user licenses, while businesses requiring broader access may choose multi-user or enterprise licenses for cost-effective access to the report.
13. Are there any additional resources or data provided in the LPG Tanker Market report?
While the report offers comprehensive insights, it's advisable to review the specific contents or supplementary materials provided to ascertain if additional resources or data are available.
14. How can I stay updated on further developments or reports in the LPG Tanker Market?
To stay informed about further developments, trends, and reports in the LPG Tanker Market, consider subscribing to industry newsletters, following relevant companies and organizations, or regularly checking reputable industry news sources and publications.
Methodology
Step 1 - Identification of Relevant Samples Size from Population Database


Step 2 - Approaches for Defining Global Market Size (Value, Volume* & Price*)

Note*: In applicable scenarios
Step 3 - Data Sources
Primary Research
- Web Analytics
- Survey Reports
- Research Institute
- Latest Research Reports
- Opinion Leaders
Secondary Research
- Annual Reports
- White Paper
- Latest Press Release
- Industry Association
- Paid Database
- Investor Presentations

Step 4 - Data Triangulation
Involves using different sources of information in order to increase the validity of a study
These sources are likely to be stakeholders in a program - participants, other researchers, program staff, other community members, and so on.
Then we put all data in single framework & apply various statistical tools to find out the dynamic on the market.
During the analysis stage, feedback from the stakeholder groups would be compared to determine areas of agreement as well as areas of divergence


