
Key Insights
The Middle East and Africa (MEA) centrifugal pumps market is experiencing robust growth, driven by burgeoning infrastructure development, particularly in the oil & gas, water & wastewater, and construction sectors. A compound annual growth rate (CAGR) of 4.60% from 2019-2024 suggests a continuously expanding market, projected to reach a substantial size by 2033. The increasing demand for efficient water management solutions in arid and semi-arid regions of MEA is a key driver, alongside large-scale industrial projects and expanding power generation capacities. The market is segmented by flow type (axial, radial, mixed), number of stages (single, multi-stage), end-user industry (oil & gas, food & beverage, etc.), and geography (Saudi Arabia, UAE, South Africa, etc.). While precise market sizing for specific years is unavailable, extrapolation based on the provided CAGR suggests significant year-on-year growth. The presence of major players like Ebara Pumps, KSB, Flowserve, and Weir Group indicates a competitive landscape with established international and regional manufacturers. Future growth will likely be influenced by government investments in infrastructure, technological advancements in pump efficiency and materials, and the adoption of smart water management techniques.
The market's diverse segmentation offers opportunities for specialized pump manufacturers. The oil & gas sector remains a significant contributor, with ongoing exploration and production activities fueling demand for robust and high-capacity pumps. However, fluctuating oil prices and economic conditions pose potential restraints. Growth in other sectors, such as food and beverage processing and pharmaceuticals, is expected to further diversify the market and reduce reliance on single industry drivers. The adoption of sustainable and energy-efficient pumps is also a key trend, with manufacturers increasingly focusing on reducing the environmental footprint of their products. Competition among established players will intensify, with companies likely focusing on innovation, strategic partnerships, and regional expansion to maintain their market share.
This detailed report provides a comprehensive analysis of the MEA (Middle East and Africa) Centrifugal Pumps industry, covering market size, growth drivers, key players, and future trends from 2019 to 2033. The study period encompasses the historical period (2019-2024), the base year (2025), and the forecast period (2025-2033). This report is essential for industry stakeholders, investors, and businesses seeking to understand the dynamics of this vital sector. The estimated market size in 2025 is xx Million.
MEA Centrifugal Pumps Industry Market Concentration & Innovation
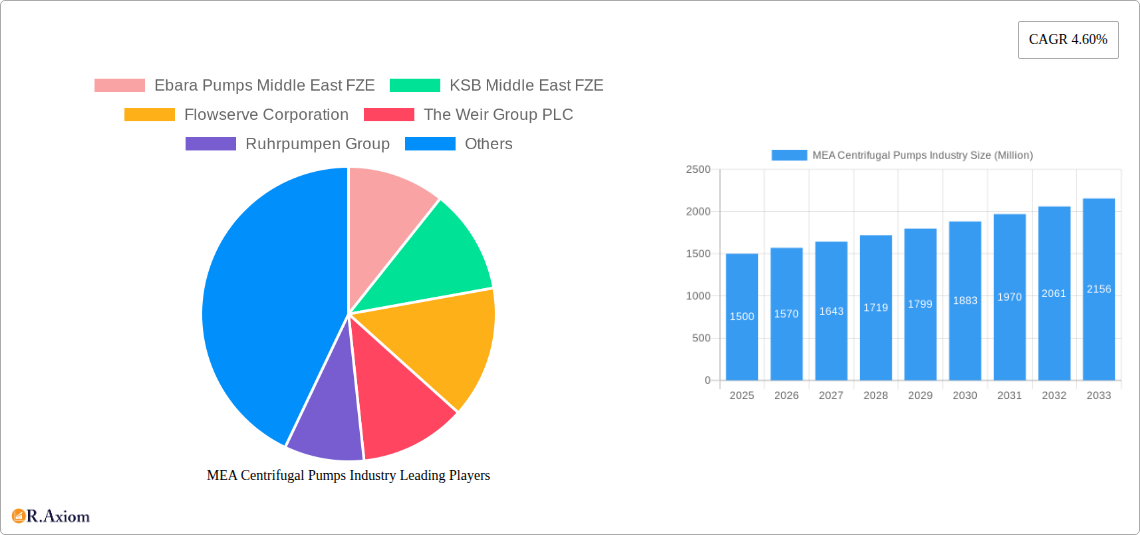
The MEA centrifugal pumps market exhibits a moderately concentrated landscape with several multinational corporations and regional players vying for market share. Key players such as Ebara Pumps Middle East FZE, KSB Middle East FZE, Flowserve Corporation, The Weir Group PLC, and Xylem Inc. hold significant positions, though the exact market share for each company in 2025 is currently unavailable (xx%). Innovation is driven by the demand for energy-efficient pumps, enhanced reliability, and the incorporation of smart technologies for predictive maintenance. Stringent environmental regulations, particularly concerning water usage and emissions, are pushing for more sustainable pump designs. Product substitutes, such as positive displacement pumps, pose some competitive pressure, but centrifugal pumps remain dominant due to their cost-effectiveness and efficiency in various applications. End-user trends reveal increasing adoption of centrifugal pumps across diverse sectors, including Oil & Gas, Water & Wastewater, and Power. Mergers and acquisitions (M&A) are a frequent occurrence, with recent deals like the Wilo Middle East acquisition of PumpsPro in February 2021, indicating consolidation and expansion within the industry. The total value of M&A deals in the past five years is estimated at xx Million.
- Key Market Players: Ebara Pumps Middle East FZE, KSB Middle East FZE, Flowserve Corporation, The Weir Group PLC, Ruhrpumpen Group, Dover Corporation, Baker Hughes Company, Xylem Inc, Schlumberger Limited, Parker Hannifin Corp
- Innovation Drivers: Energy efficiency, reliability, smart technologies, environmental regulations.
- M&A Activity: Significant consolidation through acquisitions, aiming for increased market share and comprehensive service offerings.
MEA Centrifugal Pumps Industry Industry Trends & Insights
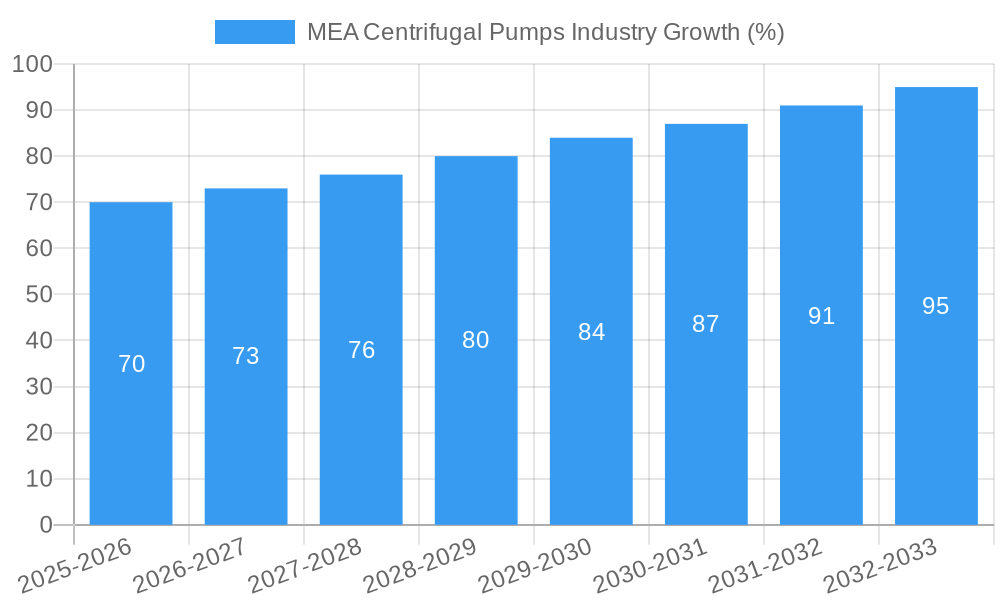
The MEA centrifugal pumps market is witnessing robust growth, driven by increasing industrialization, infrastructure development, and the expansion of various end-user sectors. The Compound Annual Growth Rate (CAGR) from 2025 to 2033 is projected to be xx%. This growth is fueled by rising demand for water and wastewater treatment solutions, particularly in rapidly urbanizing regions. Technological advancements, including the development of advanced materials and smart control systems, are enhancing pump efficiency and operational life. Consumer preferences are shifting towards energy-efficient and environmentally friendly pumps, leading manufacturers to invest in research and development to meet these demands. Competitive dynamics are characterized by both intense rivalry among established players and the emergence of innovative new entrants. Market penetration is higher in developed economies within the MEA region, with significant growth potential remaining in less-developed areas.
Dominant Markets & Segments in MEA Centrifugal Pumps Industry
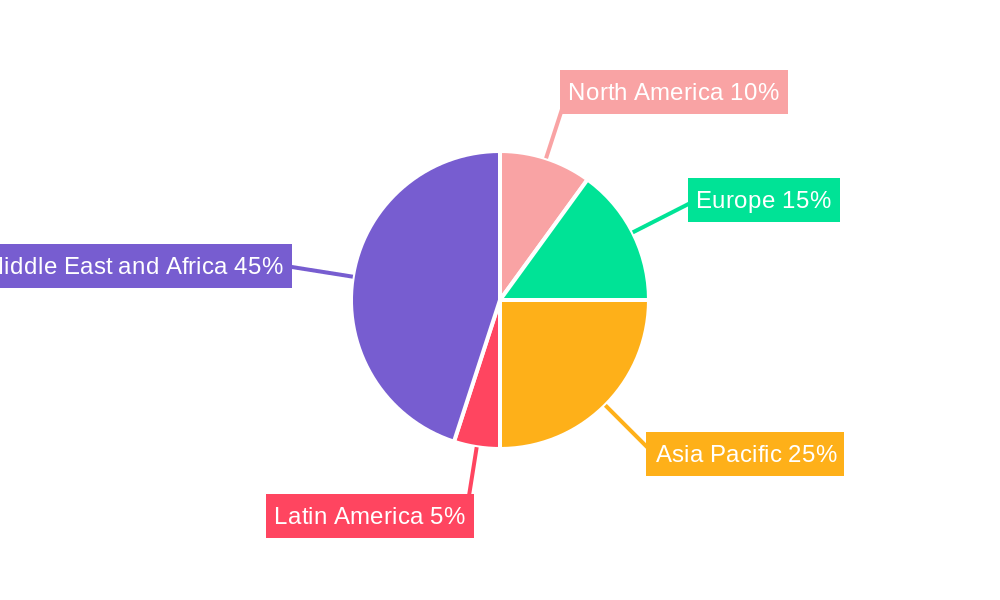
By Country: The United Arab Emirates and Saudi Arabia represent the largest markets, driven by significant investments in infrastructure projects and industrial expansion. South Africa also shows significant growth potential. Growth is fueled by government initiatives to improve water infrastructure and industrial output. The Rest of Middle East & Africa exhibits diverse growth patterns, depending on specific economic and infrastructural developments in each nation.
By Flow Type: Radial pumps dominate the market due to their versatility and effectiveness in various applications. Axial and mixed-flow pumps hold niche market segments, mainly catering to specific high-volume, low-head applications.
By Number of Stages: Single-stage pumps are most prevalent due to their simplicity and cost-effectiveness, although multi-stage pumps find applications in high-pressure systems.
By End-User Industry: The Oil & Gas sector is a major consumer of centrifugal pumps, followed by the Water & Wastewater and Power sectors. The Food & Beverages, Pharma, Construction, and Metal & Mining sectors represent significant, yet smaller, market segments.
Key Drivers:
- Economic Growth: Robust economic growth in several MEA countries drives infrastructure development, particularly in water management and energy production.
- Infrastructure Development: Extensive investments in water treatment plants, power generation facilities, and industrial projects fuel demand for centrifugal pumps.
- Government Regulations: Environmental regulations and initiatives promoting water efficiency create incentives for adopting advanced pump technologies.
MEA Centrifugal Pumps Industry Product Developments
Recent product innovations focus on enhancing energy efficiency, incorporating advanced materials for increased durability, and integrating smart sensors and control systems for predictive maintenance and operational optimization. This allows for reduced downtime, improved efficiency and overall lower lifecycle costs. Manufacturers are also concentrating on developing pumps that are adaptable to harsh operating conditions and can perform efficiently with high-viscosity fluids. This enhanced market fit addresses the specific needs of diverse industries within the MEA region.
Report Scope & Segmentation Analysis
This report segments the MEA centrifugal pumps market by flow type (axial, radial, mixed), number of stages (single-stage, multi-stage), end-user industry (Oil & Gas, Food & Beverages, Water & Wastewater, Pharma, Power, Construction, Metal & Mining, Others), and country (Saudi Arabia, United Arab Emirates, South Africa, Rest of Middle East & Africa). Each segment's market size, growth projections, and competitive dynamics are analyzed extensively. Growth projections vary depending on the specific segment, ranging from xx% to xx% CAGR over the forecast period. The competitive landscape within each segment is analyzed in relation to technological capabilities, pricing strategies, and market penetration.
Key Drivers of MEA Centrifugal Pumps Industry Growth
The MEA centrifugal pumps market is propelled by several factors: Firstly, substantial investments in infrastructure projects across the region, particularly in water management and power generation, fuels demand. Secondly, the expanding Oil & Gas sector necessitates reliable and efficient pumps for various processes. Finally, stringent environmental regulations emphasize the need for energy-efficient pump solutions, thereby increasing demand for technologically advanced pumps.
Challenges in the MEA Centrifugal Pumps Industry Sector
The MEA centrifugal pumps industry faces challenges including fluctuating oil prices impacting the Oil & Gas sector, supply chain disruptions causing delays and cost increases, and intense competition from both established and emerging players. Moreover, regulatory compliance and varying standards across different countries create complexities for manufacturers. The overall impact of these challenges is estimated at a xx% reduction in potential market growth over the forecast period.
Emerging Opportunities in MEA Centrifugal Pumps Industry
The MEA centrifugal pumps market presents opportunities in several areas. The growing focus on sustainable technologies opens avenues for manufacturers of energy-efficient and environmentally friendly pumps. Expansion into emerging markets within the region with untapped potential offers significant growth prospects. Finally, the integration of digital technologies and the adoption of Industry 4.0 principles can create innovative service and maintenance models, boosting overall market revenue.
Leading Players in the MEA Centrifugal Pumps Industry Market
- Ebara Pumps Middle East FZE
- KSB Middle East FZE
- Flowserve Corporation
- The Weir Group PLC
- Ruhrpumpen Group
- Dover Corporation
- Baker Hughes Company
- Xylem Inc
- Schlumberger Limited
- Parker Hannifin Corp
Key Developments in MEA Centrifugal Pumps Industry Industry
- June 2021: Amarinth secured a significant order for 14 API 610 VS4 vertical pumps from ISCCO for the ADNOC Ruwais Refinery East, UAE. This highlights the continued demand for high-specification pumps within the Oil & Gas sector.
- February 2021: Wilo Middle East acquired PumpsPro, strengthening its position as a complete solution provider in the UAE and the wider MEA region. This underscores the ongoing consolidation within the industry.
Strategic Outlook for MEA Centrifugal Pumps Industry Market
The MEA centrifugal pumps market is poised for sustained growth, driven by long-term infrastructural development, increasing industrial activity, and a growing emphasis on sustainable technologies. The focus on energy efficiency, digitalization, and customized solutions will shape future market dynamics. This presents significant opportunities for both established and emerging players to capitalize on market expansion, technological advancements, and increasing demand for robust and reliable pumping solutions across diverse industries.
MEA Centrifugal Pumps Industry Segmentation
-
1. Flow Type
- 1.1. Axial
- 1.2. Radial
- 1.3. Mixed
-
2. Number of Stages
- 2.1. Single Stage
- 2.2. Multi Stage
-
3. End-User Industry
- 3.1. Oil & Gas
- 3.2. Food & Beverages
- 3.3. Water & Wastewater
- 3.4. Pharma
- 3.5. Power
- 3.6. Construction
- 3.7. Metal & Mining
- 3.8. Others
MEA Centrifugal Pumps Industry Segmentation By Geography
-
1. North America
- 1.1. United States
- 1.2. Canada
- 1.3. Mexico
-
2. South America
- 2.1. Brazil
- 2.2. Argentina
- 2.3. Rest of South America
-
3. Europe
- 3.1. United Kingdom
- 3.2. Germany
- 3.3. France
- 3.4. Italy
- 3.5. Spain
- 3.6. Russia
- 3.7. Benelux
- 3.8. Nordics
- 3.9. Rest of Europe
-
4. Middle East & Africa
- 4.1. Turkey
- 4.2. Israel
- 4.3. GCC
- 4.4. North Africa
- 4.5. South Africa
- 4.6. Rest of Middle East & Africa
-
5. Asia Pacific
- 5.1. China
- 5.2. India
- 5.3. Japan
- 5.4. South Korea
- 5.5. ASEAN
- 5.6. Oceania
- 5.7. Rest of Asia Pacific
MEA Centrifugal Pumps Industry REPORT HIGHLIGHTS
| Aspects | Details |
|---|---|
| Study Period | 2019-2033 |
| Base Year | 2024 |
| Estimated Year | 2025 |
| Forecast Period | 2025-2033 |
| Historical Period | 2019-2024 |
| Growth Rate | CAGR of 4.60% from 2019-2033 |
| Segmentation |
|
Table of Contents
- 1. Introduction
- 1.1. Research Scope
- 1.2. Market Segmentation
- 1.3. Research Methodology
- 1.4. Definitions and Assumptions
- 2. Executive Summary
- 2.1. Introduction
- 3. Market Dynamics
- 3.1. Introduction
- 3.2. Market Drivers
- 3.2.1. Rapid Industrialization & Urbanization; Increasing Investments in Urban Waste-Water Sector
- 3.3. Market Restrains
- 3.3.1. High Acquisition and Maintenace Cost of Industrial CT systems
- 3.4. Market Trends
- 3.4.1. Water and Wastewater Management to Drive the Demand for Centrifugal Pumps
- 4. Market Factor Analysis
- 4.1. Porters Five Forces
- 4.2. Supply/Value Chain
- 4.3. PESTEL analysis
- 4.4. Market Entropy
- 4.5. Patent/Trademark Analysis
- 5. Global MEA Centrifugal Pumps Industry Analysis, Insights and Forecast, 2019-2031
- 5.1. Market Analysis, Insights and Forecast - by Flow Type
- 5.1.1. Axial
- 5.1.2. Radial
- 5.1.3. Mixed
- 5.2. Market Analysis, Insights and Forecast - by Number of Stages
- 5.2.1. Single Stage
- 5.2.2. Multi Stage
- 5.3. Market Analysis, Insights and Forecast - by End-User Industry
- 5.3.1. Oil & Gas
- 5.3.2. Food & Beverages
- 5.3.3. Water & Wastewater
- 5.3.4. Pharma
- 5.3.5. Power
- 5.3.6. Construction
- 5.3.7. Metal & Mining
- 5.3.8. Others
- 5.4. Market Analysis, Insights and Forecast - by Region
- 5.4.1. North America
- 5.4.2. South America
- 5.4.3. Europe
- 5.4.4. Middle East & Africa
- 5.4.5. Asia Pacific
- 5.1. Market Analysis, Insights and Forecast - by Flow Type
- 6. North America MEA Centrifugal Pumps Industry Analysis, Insights and Forecast, 2019-2031
- 6.1. Market Analysis, Insights and Forecast - by Flow Type
- 6.1.1. Axial
- 6.1.2. Radial
- 6.1.3. Mixed
- 6.2. Market Analysis, Insights and Forecast - by Number of Stages
- 6.2.1. Single Stage
- 6.2.2. Multi Stage
- 6.3. Market Analysis, Insights and Forecast - by End-User Industry
- 6.3.1. Oil & Gas
- 6.3.2. Food & Beverages
- 6.3.3. Water & Wastewater
- 6.3.4. Pharma
- 6.3.5. Power
- 6.3.6. Construction
- 6.3.7. Metal & Mining
- 6.3.8. Others
- 6.1. Market Analysis, Insights and Forecast - by Flow Type
- 7. South America MEA Centrifugal Pumps Industry Analysis, Insights and Forecast, 2019-2031
- 7.1. Market Analysis, Insights and Forecast - by Flow Type
- 7.1.1. Axial
- 7.1.2. Radial
- 7.1.3. Mixed
- 7.2. Market Analysis, Insights and Forecast - by Number of Stages
- 7.2.1. Single Stage
- 7.2.2. Multi Stage
- 7.3. Market Analysis, Insights and Forecast - by End-User Industry
- 7.3.1. Oil & Gas
- 7.3.2. Food & Beverages
- 7.3.3. Water & Wastewater
- 7.3.4. Pharma
- 7.3.5. Power
- 7.3.6. Construction
- 7.3.7. Metal & Mining
- 7.3.8. Others
- 7.1. Market Analysis, Insights and Forecast - by Flow Type
- 8. Europe MEA Centrifugal Pumps Industry Analysis, Insights and Forecast, 2019-2031
- 8.1. Market Analysis, Insights and Forecast - by Flow Type
- 8.1.1. Axial
- 8.1.2. Radial
- 8.1.3. Mixed
- 8.2. Market Analysis, Insights and Forecast - by Number of Stages
- 8.2.1. Single Stage
- 8.2.2. Multi Stage
- 8.3. Market Analysis, Insights and Forecast - by End-User Industry
- 8.3.1. Oil & Gas
- 8.3.2. Food & Beverages
- 8.3.3. Water & Wastewater
- 8.3.4. Pharma
- 8.3.5. Power
- 8.3.6. Construction
- 8.3.7. Metal & Mining
- 8.3.8. Others
- 8.1. Market Analysis, Insights and Forecast - by Flow Type
- 9. Middle East & Africa MEA Centrifugal Pumps Industry Analysis, Insights and Forecast, 2019-2031
- 9.1. Market Analysis, Insights and Forecast - by Flow Type
- 9.1.1. Axial
- 9.1.2. Radial
- 9.1.3. Mixed
- 9.2. Market Analysis, Insights and Forecast - by Number of Stages
- 9.2.1. Single Stage
- 9.2.2. Multi Stage
- 9.3. Market Analysis, Insights and Forecast - by End-User Industry
- 9.3.1. Oil & Gas
- 9.3.2. Food & Beverages
- 9.3.3. Water & Wastewater
- 9.3.4. Pharma
- 9.3.5. Power
- 9.3.6. Construction
- 9.3.7. Metal & Mining
- 9.3.8. Others
- 9.1. Market Analysis, Insights and Forecast - by Flow Type
- 10. Asia Pacific MEA Centrifugal Pumps Industry Analysis, Insights and Forecast, 2019-2031
- 10.1. Market Analysis, Insights and Forecast - by Flow Type
- 10.1.1. Axial
- 10.1.2. Radial
- 10.1.3. Mixed
- 10.2. Market Analysis, Insights and Forecast - by Number of Stages
- 10.2.1. Single Stage
- 10.2.2. Multi Stage
- 10.3. Market Analysis, Insights and Forecast - by End-User Industry
- 10.3.1. Oil & Gas
- 10.3.2. Food & Beverages
- 10.3.3. Water & Wastewater
- 10.3.4. Pharma
- 10.3.5. Power
- 10.3.6. Construction
- 10.3.7. Metal & Mining
- 10.3.8. Others
- 10.1. Market Analysis, Insights and Forecast - by Flow Type
- 11. North America MEA Centrifugal Pumps Industry Analysis, Insights and Forecast, 2019-2031
- 11.1. Market Analysis, Insights and Forecast - By Country/Sub-region
- 11.1.1.
- 12. Europe MEA Centrifugal Pumps Industry Analysis, Insights and Forecast, 2019-2031
- 12.1. Market Analysis, Insights and Forecast - By Country/Sub-region
- 12.1.1.
- 13. Asia Pacific MEA Centrifugal Pumps Industry Analysis, Insights and Forecast, 2019-2031
- 13.1. Market Analysis, Insights and Forecast - By Country/Sub-region
- 13.1.1.
- 14. Latin America MEA Centrifugal Pumps Industry Analysis, Insights and Forecast, 2019-2031
- 14.1. Market Analysis, Insights and Forecast - By Country/Sub-region
- 14.1.1.
- 15. Middle East and Africa MEA Centrifugal Pumps Industry Analysis, Insights and Forecast, 2019-2031
- 15.1. Market Analysis, Insights and Forecast - By Country/Sub-region
- 15.1.1.
- 16. Competitive Analysis
- 16.1. Global Market Share Analysis 2024
- 16.2. Company Profiles
- 16.2.1 Ebara Pumps Middle East FZE
- 16.2.1.1. Overview
- 16.2.1.2. Products
- 16.2.1.3. SWOT Analysis
- 16.2.1.4. Recent Developments
- 16.2.1.5. Financials (Based on Availability)
- 16.2.2 KSB Middle East FZE
- 16.2.2.1. Overview
- 16.2.2.2. Products
- 16.2.2.3. SWOT Analysis
- 16.2.2.4. Recent Developments
- 16.2.2.5. Financials (Based on Availability)
- 16.2.3 Flowserve Corporation
- 16.2.3.1. Overview
- 16.2.3.2. Products
- 16.2.3.3. SWOT Analysis
- 16.2.3.4. Recent Developments
- 16.2.3.5. Financials (Based on Availability)
- 16.2.4 The Weir Group PLC
- 16.2.4.1. Overview
- 16.2.4.2. Products
- 16.2.4.3. SWOT Analysis
- 16.2.4.4. Recent Developments
- 16.2.4.5. Financials (Based on Availability)
- 16.2.5 Ruhrpumpen Group
- 16.2.5.1. Overview
- 16.2.5.2. Products
- 16.2.5.3. SWOT Analysis
- 16.2.5.4. Recent Developments
- 16.2.5.5. Financials (Based on Availability)
- 16.2.6 Dover Corporation
- 16.2.6.1. Overview
- 16.2.6.2. Products
- 16.2.6.3. SWOT Analysis
- 16.2.6.4. Recent Developments
- 16.2.6.5. Financials (Based on Availability)
- 16.2.7 Baker Hughes Company
- 16.2.7.1. Overview
- 16.2.7.2. Products
- 16.2.7.3. SWOT Analysis
- 16.2.7.4. Recent Developments
- 16.2.7.5. Financials (Based on Availability)
- 16.2.8 Xylem Inc
- 16.2.8.1. Overview
- 16.2.8.2. Products
- 16.2.8.3. SWOT Analysis
- 16.2.8.4. Recent Developments
- 16.2.8.5. Financials (Based on Availability)
- 16.2.9 Schlumberger Limited
- 16.2.9.1. Overview
- 16.2.9.2. Products
- 16.2.9.3. SWOT Analysis
- 16.2.9.4. Recent Developments
- 16.2.9.5. Financials (Based on Availability)
- 16.2.10 Parker Hannifin Corp
- 16.2.10.1. Overview
- 16.2.10.2. Products
- 16.2.10.3. SWOT Analysis
- 16.2.10.4. Recent Developments
- 16.2.10.5. Financials (Based on Availability)
- 16.2.1 Ebara Pumps Middle East FZE
List of Figures
- Figure 1: Global MEA Centrifugal Pumps Industry Revenue Breakdown (Million, %) by Region 2024 & 2032
- Figure 2: Global MEA Centrifugal Pumps Industry Volume Breakdown (K Unit, %) by Region 2024 & 2032
- Figure 3: North America MEA Centrifugal Pumps Industry Revenue (Million), by Country 2024 & 2032
- Figure 4: North America MEA Centrifugal Pumps Industry Volume (K Unit), by Country 2024 & 2032
- Figure 5: North America MEA Centrifugal Pumps Industry Revenue Share (%), by Country 2024 & 2032
- Figure 6: North America MEA Centrifugal Pumps Industry Volume Share (%), by Country 2024 & 2032
- Figure 7: Europe MEA Centrifugal Pumps Industry Revenue (Million), by Country 2024 & 2032
- Figure 8: Europe MEA Centrifugal Pumps Industry Volume (K Unit), by Country 2024 & 2032
- Figure 9: Europe MEA Centrifugal Pumps Industry Revenue Share (%), by Country 2024 & 2032
- Figure 10: Europe MEA Centrifugal Pumps Industry Volume Share (%), by Country 2024 & 2032
- Figure 11: Asia Pacific MEA Centrifugal Pumps Industry Revenue (Million), by Country 2024 & 2032
- Figure 12: Asia Pacific MEA Centrifugal Pumps Industry Volume (K Unit), by Country 2024 & 2032
- Figure 13: Asia Pacific MEA Centrifugal Pumps Industry Revenue Share (%), by Country 2024 & 2032
- Figure 14: Asia Pacific MEA Centrifugal Pumps Industry Volume Share (%), by Country 2024 & 2032
- Figure 15: Latin America MEA Centrifugal Pumps Industry Revenue (Million), by Country 2024 & 2032
- Figure 16: Latin America MEA Centrifugal Pumps Industry Volume (K Unit), by Country 2024 & 2032
- Figure 17: Latin America MEA Centrifugal Pumps Industry Revenue Share (%), by Country 2024 & 2032
- Figure 18: Latin America MEA Centrifugal Pumps Industry Volume Share (%), by Country 2024 & 2032
- Figure 19: Middle East and Africa MEA Centrifugal Pumps Industry Revenue (Million), by Country 2024 & 2032
- Figure 20: Middle East and Africa MEA Centrifugal Pumps Industry Volume (K Unit), by Country 2024 & 2032
- Figure 21: Middle East and Africa MEA Centrifugal Pumps Industry Revenue Share (%), by Country 2024 & 2032
- Figure 22: Middle East and Africa MEA Centrifugal Pumps Industry Volume Share (%), by Country 2024 & 2032
- Figure 23: North America MEA Centrifugal Pumps Industry Revenue (Million), by Flow Type 2024 & 2032
- Figure 24: North America MEA Centrifugal Pumps Industry Volume (K Unit), by Flow Type 2024 & 2032
- Figure 25: North America MEA Centrifugal Pumps Industry Revenue Share (%), by Flow Type 2024 & 2032
- Figure 26: North America MEA Centrifugal Pumps Industry Volume Share (%), by Flow Type 2024 & 2032
- Figure 27: North America MEA Centrifugal Pumps Industry Revenue (Million), by Number of Stages 2024 & 2032
- Figure 28: North America MEA Centrifugal Pumps Industry Volume (K Unit), by Number of Stages 2024 & 2032
- Figure 29: North America MEA Centrifugal Pumps Industry Revenue Share (%), by Number of Stages 2024 & 2032
- Figure 30: North America MEA Centrifugal Pumps Industry Volume Share (%), by Number of Stages 2024 & 2032
- Figure 31: North America MEA Centrifugal Pumps Industry Revenue (Million), by End-User Industry 2024 & 2032
- Figure 32: North America MEA Centrifugal Pumps Industry Volume (K Unit), by End-User Industry 2024 & 2032
- Figure 33: North America MEA Centrifugal Pumps Industry Revenue Share (%), by End-User Industry 2024 & 2032
- Figure 34: North America MEA Centrifugal Pumps Industry Volume Share (%), by End-User Industry 2024 & 2032
- Figure 35: North America MEA Centrifugal Pumps Industry Revenue (Million), by Country 2024 & 2032
- Figure 36: North America MEA Centrifugal Pumps Industry Volume (K Unit), by Country 2024 & 2032
- Figure 37: North America MEA Centrifugal Pumps Industry Revenue Share (%), by Country 2024 & 2032
- Figure 38: North America MEA Centrifugal Pumps Industry Volume Share (%), by Country 2024 & 2032
- Figure 39: South America MEA Centrifugal Pumps Industry Revenue (Million), by Flow Type 2024 & 2032
- Figure 40: South America MEA Centrifugal Pumps Industry Volume (K Unit), by Flow Type 2024 & 2032
- Figure 41: South America MEA Centrifugal Pumps Industry Revenue Share (%), by Flow Type 2024 & 2032
- Figure 42: South America MEA Centrifugal Pumps Industry Volume Share (%), by Flow Type 2024 & 2032
- Figure 43: South America MEA Centrifugal Pumps Industry Revenue (Million), by Number of Stages 2024 & 2032
- Figure 44: South America MEA Centrifugal Pumps Industry Volume (K Unit), by Number of Stages 2024 & 2032
- Figure 45: South America MEA Centrifugal Pumps Industry Revenue Share (%), by Number of Stages 2024 & 2032
- Figure 46: South America MEA Centrifugal Pumps Industry Volume Share (%), by Number of Stages 2024 & 2032
- Figure 47: South America MEA Centrifugal Pumps Industry Revenue (Million), by End-User Industry 2024 & 2032
- Figure 48: South America MEA Centrifugal Pumps Industry Volume (K Unit), by End-User Industry 2024 & 2032
- Figure 49: South America MEA Centrifugal Pumps Industry Revenue Share (%), by End-User Industry 2024 & 2032
- Figure 50: South America MEA Centrifugal Pumps Industry Volume Share (%), by End-User Industry 2024 & 2032
- Figure 51: South America MEA Centrifugal Pumps Industry Revenue (Million), by Country 2024 & 2032
- Figure 52: South America MEA Centrifugal Pumps Industry Volume (K Unit), by Country 2024 & 2032
- Figure 53: South America MEA Centrifugal Pumps Industry Revenue Share (%), by Country 2024 & 2032
- Figure 54: South America MEA Centrifugal Pumps Industry Volume Share (%), by Country 2024 & 2032
- Figure 55: Europe MEA Centrifugal Pumps Industry Revenue (Million), by Flow Type 2024 & 2032
- Figure 56: Europe MEA Centrifugal Pumps Industry Volume (K Unit), by Flow Type 2024 & 2032
- Figure 57: Europe MEA Centrifugal Pumps Industry Revenue Share (%), by Flow Type 2024 & 2032
- Figure 58: Europe MEA Centrifugal Pumps Industry Volume Share (%), by Flow Type 2024 & 2032
- Figure 59: Europe MEA Centrifugal Pumps Industry Revenue (Million), by Number of Stages 2024 & 2032
- Figure 60: Europe MEA Centrifugal Pumps Industry Volume (K Unit), by Number of Stages 2024 & 2032
- Figure 61: Europe MEA Centrifugal Pumps Industry Revenue Share (%), by Number of Stages 2024 & 2032
- Figure 62: Europe MEA Centrifugal Pumps Industry Volume Share (%), by Number of Stages 2024 & 2032
- Figure 63: Europe MEA Centrifugal Pumps Industry Revenue (Million), by End-User Industry 2024 & 2032
- Figure 64: Europe MEA Centrifugal Pumps Industry Volume (K Unit), by End-User Industry 2024 & 2032
- Figure 65: Europe MEA Centrifugal Pumps Industry Revenue Share (%), by End-User Industry 2024 & 2032
- Figure 66: Europe MEA Centrifugal Pumps Industry Volume Share (%), by End-User Industry 2024 & 2032
- Figure 67: Europe MEA Centrifugal Pumps Industry Revenue (Million), by Country 2024 & 2032
- Figure 68: Europe MEA Centrifugal Pumps Industry Volume (K Unit), by Country 2024 & 2032
- Figure 69: Europe MEA Centrifugal Pumps Industry Revenue Share (%), by Country 2024 & 2032
- Figure 70: Europe MEA Centrifugal Pumps Industry Volume Share (%), by Country 2024 & 2032
- Figure 71: Middle East & Africa MEA Centrifugal Pumps Industry Revenue (Million), by Flow Type 2024 & 2032
- Figure 72: Middle East & Africa MEA Centrifugal Pumps Industry Volume (K Unit), by Flow Type 2024 & 2032
- Figure 73: Middle East & Africa MEA Centrifugal Pumps Industry Revenue Share (%), by Flow Type 2024 & 2032
- Figure 74: Middle East & Africa MEA Centrifugal Pumps Industry Volume Share (%), by Flow Type 2024 & 2032
- Figure 75: Middle East & Africa MEA Centrifugal Pumps Industry Revenue (Million), by Number of Stages 2024 & 2032
- Figure 76: Middle East & Africa MEA Centrifugal Pumps Industry Volume (K Unit), by Number of Stages 2024 & 2032
- Figure 77: Middle East & Africa MEA Centrifugal Pumps Industry Revenue Share (%), by Number of Stages 2024 & 2032
- Figure 78: Middle East & Africa MEA Centrifugal Pumps Industry Volume Share (%), by Number of Stages 2024 & 2032
- Figure 79: Middle East & Africa MEA Centrifugal Pumps Industry Revenue (Million), by End-User Industry 2024 & 2032
- Figure 80: Middle East & Africa MEA Centrifugal Pumps Industry Volume (K Unit), by End-User Industry 2024 & 2032
- Figure 81: Middle East & Africa MEA Centrifugal Pumps Industry Revenue Share (%), by End-User Industry 2024 & 2032
- Figure 82: Middle East & Africa MEA Centrifugal Pumps Industry Volume Share (%), by End-User Industry 2024 & 2032
- Figure 83: Middle East & Africa MEA Centrifugal Pumps Industry Revenue (Million), by Country 2024 & 2032
- Figure 84: Middle East & Africa MEA Centrifugal Pumps Industry Volume (K Unit), by Country 2024 & 2032
- Figure 85: Middle East & Africa MEA Centrifugal Pumps Industry Revenue Share (%), by Country 2024 & 2032
- Figure 86: Middle East & Africa MEA Centrifugal Pumps Industry Volume Share (%), by Country 2024 & 2032
- Figure 87: Asia Pacific MEA Centrifugal Pumps Industry Revenue (Million), by Flow Type 2024 & 2032
- Figure 88: Asia Pacific MEA Centrifugal Pumps Industry Volume (K Unit), by Flow Type 2024 & 2032
- Figure 89: Asia Pacific MEA Centrifugal Pumps Industry Revenue Share (%), by Flow Type 2024 & 2032
- Figure 90: Asia Pacific MEA Centrifugal Pumps Industry Volume Share (%), by Flow Type 2024 & 2032
- Figure 91: Asia Pacific MEA Centrifugal Pumps Industry Revenue (Million), by Number of Stages 2024 & 2032
- Figure 92: Asia Pacific MEA Centrifugal Pumps Industry Volume (K Unit), by Number of Stages 2024 & 2032
- Figure 93: Asia Pacific MEA Centrifugal Pumps Industry Revenue Share (%), by Number of Stages 2024 & 2032
- Figure 94: Asia Pacific MEA Centrifugal Pumps Industry Volume Share (%), by Number of Stages 2024 & 2032
- Figure 95: Asia Pacific MEA Centrifugal Pumps Industry Revenue (Million), by End-User Industry 2024 & 2032
- Figure 96: Asia Pacific MEA Centrifugal Pumps Industry Volume (K Unit), by End-User Industry 2024 & 2032
- Figure 97: Asia Pacific MEA Centrifugal Pumps Industry Revenue Share (%), by End-User Industry 2024 & 2032
- Figure 98: Asia Pacific MEA Centrifugal Pumps Industry Volume Share (%), by End-User Industry 2024 & 2032
- Figure 99: Asia Pacific MEA Centrifugal Pumps Industry Revenue (Million), by Country 2024 & 2032
- Figure 100: Asia Pacific MEA Centrifugal Pumps Industry Volume (K Unit), by Country 2024 & 2032
- Figure 101: Asia Pacific MEA Centrifugal Pumps Industry Revenue Share (%), by Country 2024 & 2032
- Figure 102: Asia Pacific MEA Centrifugal Pumps Industry Volume Share (%), by Country 2024 & 2032
List of Tables
- Table 1: Global MEA Centrifugal Pumps Industry Revenue Million Forecast, by Region 2019 & 2032
- Table 2: Global MEA Centrifugal Pumps Industry Volume K Unit Forecast, by Region 2019 & 2032
- Table 3: Global MEA Centrifugal Pumps Industry Revenue Million Forecast, by Flow Type 2019 & 2032
- Table 4: Global MEA Centrifugal Pumps Industry Volume K Unit Forecast, by Flow Type 2019 & 2032
- Table 5: Global MEA Centrifugal Pumps Industry Revenue Million Forecast, by Number of Stages 2019 & 2032
- Table 6: Global MEA Centrifugal Pumps Industry Volume K Unit Forecast, by Number of Stages 2019 & 2032
- Table 7: Global MEA Centrifugal Pumps Industry Revenue Million Forecast, by End-User Industry 2019 & 2032
- Table 8: Global MEA Centrifugal Pumps Industry Volume K Unit Forecast, by End-User Industry 2019 & 2032
- Table 9: Global MEA Centrifugal Pumps Industry Revenue Million Forecast, by Region 2019 & 2032
- Table 10: Global MEA Centrifugal Pumps Industry Volume K Unit Forecast, by Region 2019 & 2032
- Table 11: Global MEA Centrifugal Pumps Industry Revenue Million Forecast, by Country 2019 & 2032
- Table 12: Global MEA Centrifugal Pumps Industry Volume K Unit Forecast, by Country 2019 & 2032
- Table 13: MEA Centrifugal Pumps Industry Revenue (Million) Forecast, by Application 2019 & 2032
- Table 14: MEA Centrifugal Pumps Industry Volume (K Unit) Forecast, by Application 2019 & 2032
- Table 15: Global MEA Centrifugal Pumps Industry Revenue Million Forecast, by Country 2019 & 2032
- Table 16: Global MEA Centrifugal Pumps Industry Volume K Unit Forecast, by Country 2019 & 2032
- Table 17: MEA Centrifugal Pumps Industry Revenue (Million) Forecast, by Application 2019 & 2032
- Table 18: MEA Centrifugal Pumps Industry Volume (K Unit) Forecast, by Application 2019 & 2032
- Table 19: Global MEA Centrifugal Pumps Industry Revenue Million Forecast, by Country 2019 & 2032
- Table 20: Global MEA Centrifugal Pumps Industry Volume K Unit Forecast, by Country 2019 & 2032
- Table 21: MEA Centrifugal Pumps Industry Revenue (Million) Forecast, by Application 2019 & 2032
- Table 22: MEA Centrifugal Pumps Industry Volume (K Unit) Forecast, by Application 2019 & 2032
- Table 23: Global MEA Centrifugal Pumps Industry Revenue Million Forecast, by Country 2019 & 2032
- Table 24: Global MEA Centrifugal Pumps Industry Volume K Unit Forecast, by Country 2019 & 2032
- Table 25: MEA Centrifugal Pumps Industry Revenue (Million) Forecast, by Application 2019 & 2032
- Table 26: MEA Centrifugal Pumps Industry Volume (K Unit) Forecast, by Application 2019 & 2032
- Table 27: Global MEA Centrifugal Pumps Industry Revenue Million Forecast, by Country 2019 & 2032
- Table 28: Global MEA Centrifugal Pumps Industry Volume K Unit Forecast, by Country 2019 & 2032
- Table 29: MEA Centrifugal Pumps Industry Revenue (Million) Forecast, by Application 2019 & 2032
- Table 30: MEA Centrifugal Pumps Industry Volume (K Unit) Forecast, by Application 2019 & 2032
- Table 31: Global MEA Centrifugal Pumps Industry Revenue Million Forecast, by Flow Type 2019 & 2032
- Table 32: Global MEA Centrifugal Pumps Industry Volume K Unit Forecast, by Flow Type 2019 & 2032
- Table 33: Global MEA Centrifugal Pumps Industry Revenue Million Forecast, by Number of Stages 2019 & 2032
- Table 34: Global MEA Centrifugal Pumps Industry Volume K Unit Forecast, by Number of Stages 2019 & 2032
- Table 35: Global MEA Centrifugal Pumps Industry Revenue Million Forecast, by End-User Industry 2019 & 2032
- Table 36: Global MEA Centrifugal Pumps Industry Volume K Unit Forecast, by End-User Industry 2019 & 2032
- Table 37: Global MEA Centrifugal Pumps Industry Revenue Million Forecast, by Country 2019 & 2032
- Table 38: Global MEA Centrifugal Pumps Industry Volume K Unit Forecast, by Country 2019 & 2032
- Table 39: United States MEA Centrifugal Pumps Industry Revenue (Million) Forecast, by Application 2019 & 2032
- Table 40: United States MEA Centrifugal Pumps Industry Volume (K Unit) Forecast, by Application 2019 & 2032
- Table 41: Canada MEA Centrifugal Pumps Industry Revenue (Million) Forecast, by Application 2019 & 2032
- Table 42: Canada MEA Centrifugal Pumps Industry Volume (K Unit) Forecast, by Application 2019 & 2032
- Table 43: Mexico MEA Centrifugal Pumps Industry Revenue (Million) Forecast, by Application 2019 & 2032
- Table 44: Mexico MEA Centrifugal Pumps Industry Volume (K Unit) Forecast, by Application 2019 & 2032
- Table 45: Global MEA Centrifugal Pumps Industry Revenue Million Forecast, by Flow Type 2019 & 2032
- Table 46: Global MEA Centrifugal Pumps Industry Volume K Unit Forecast, by Flow Type 2019 & 2032
- Table 47: Global MEA Centrifugal Pumps Industry Revenue Million Forecast, by Number of Stages 2019 & 2032
- Table 48: Global MEA Centrifugal Pumps Industry Volume K Unit Forecast, by Number of Stages 2019 & 2032
- Table 49: Global MEA Centrifugal Pumps Industry Revenue Million Forecast, by End-User Industry 2019 & 2032
- Table 50: Global MEA Centrifugal Pumps Industry Volume K Unit Forecast, by End-User Industry 2019 & 2032
- Table 51: Global MEA Centrifugal Pumps Industry Revenue Million Forecast, by Country 2019 & 2032
- Table 52: Global MEA Centrifugal Pumps Industry Volume K Unit Forecast, by Country 2019 & 2032
- Table 53: Brazil MEA Centrifugal Pumps Industry Revenue (Million) Forecast, by Application 2019 & 2032
- Table 54: Brazil MEA Centrifugal Pumps Industry Volume (K Unit) Forecast, by Application 2019 & 2032
- Table 55: Argentina MEA Centrifugal Pumps Industry Revenue (Million) Forecast, by Application 2019 & 2032
- Table 56: Argentina MEA Centrifugal Pumps Industry Volume (K Unit) Forecast, by Application 2019 & 2032
- Table 57: Rest of South America MEA Centrifugal Pumps Industry Revenue (Million) Forecast, by Application 2019 & 2032
- Table 58: Rest of South America MEA Centrifugal Pumps Industry Volume (K Unit) Forecast, by Application 2019 & 2032
- Table 59: Global MEA Centrifugal Pumps Industry Revenue Million Forecast, by Flow Type 2019 & 2032
- Table 60: Global MEA Centrifugal Pumps Industry Volume K Unit Forecast, by Flow Type 2019 & 2032
- Table 61: Global MEA Centrifugal Pumps Industry Revenue Million Forecast, by Number of Stages 2019 & 2032
- Table 62: Global MEA Centrifugal Pumps Industry Volume K Unit Forecast, by Number of Stages 2019 & 2032
- Table 63: Global MEA Centrifugal Pumps Industry Revenue Million Forecast, by End-User Industry 2019 & 2032
- Table 64: Global MEA Centrifugal Pumps Industry Volume K Unit Forecast, by End-User Industry 2019 & 2032
- Table 65: Global MEA Centrifugal Pumps Industry Revenue Million Forecast, by Country 2019 & 2032
- Table 66: Global MEA Centrifugal Pumps Industry Volume K Unit Forecast, by Country 2019 & 2032
- Table 67: United Kingdom MEA Centrifugal Pumps Industry Revenue (Million) Forecast, by Application 2019 & 2032
- Table 68: United Kingdom MEA Centrifugal Pumps Industry Volume (K Unit) Forecast, by Application 2019 & 2032
- Table 69: Germany MEA Centrifugal Pumps Industry Revenue (Million) Forecast, by Application 2019 & 2032
- Table 70: Germany MEA Centrifugal Pumps Industry Volume (K Unit) Forecast, by Application 2019 & 2032
- Table 71: France MEA Centrifugal Pumps Industry Revenue (Million) Forecast, by Application 2019 & 2032
- Table 72: France MEA Centrifugal Pumps Industry Volume (K Unit) Forecast, by Application 2019 & 2032
- Table 73: Italy MEA Centrifugal Pumps Industry Revenue (Million) Forecast, by Application 2019 & 2032
- Table 74: Italy MEA Centrifugal Pumps Industry Volume (K Unit) Forecast, by Application 2019 & 2032
- Table 75: Spain MEA Centrifugal Pumps Industry Revenue (Million) Forecast, by Application 2019 & 2032
- Table 76: Spain MEA Centrifugal Pumps Industry Volume (K Unit) Forecast, by Application 2019 & 2032
- Table 77: Russia MEA Centrifugal Pumps Industry Revenue (Million) Forecast, by Application 2019 & 2032
- Table 78: Russia MEA Centrifugal Pumps Industry Volume (K Unit) Forecast, by Application 2019 & 2032
- Table 79: Benelux MEA Centrifugal Pumps Industry Revenue (Million) Forecast, by Application 2019 & 2032
- Table 80: Benelux MEA Centrifugal Pumps Industry Volume (K Unit) Forecast, by Application 2019 & 2032
- Table 81: Nordics MEA Centrifugal Pumps Industry Revenue (Million) Forecast, by Application 2019 & 2032
- Table 82: Nordics MEA Centrifugal Pumps Industry Volume (K Unit) Forecast, by Application 2019 & 2032
- Table 83: Rest of Europe MEA Centrifugal Pumps Industry Revenue (Million) Forecast, by Application 2019 & 2032
- Table 84: Rest of Europe MEA Centrifugal Pumps Industry Volume (K Unit) Forecast, by Application 2019 & 2032
- Table 85: Global MEA Centrifugal Pumps Industry Revenue Million Forecast, by Flow Type 2019 & 2032
- Table 86: Global MEA Centrifugal Pumps Industry Volume K Unit Forecast, by Flow Type 2019 & 2032
- Table 87: Global MEA Centrifugal Pumps Industry Revenue Million Forecast, by Number of Stages 2019 & 2032
- Table 88: Global MEA Centrifugal Pumps Industry Volume K Unit Forecast, by Number of Stages 2019 & 2032
- Table 89: Global MEA Centrifugal Pumps Industry Revenue Million Forecast, by End-User Industry 2019 & 2032
- Table 90: Global MEA Centrifugal Pumps Industry Volume K Unit Forecast, by End-User Industry 2019 & 2032
- Table 91: Global MEA Centrifugal Pumps Industry Revenue Million Forecast, by Country 2019 & 2032
- Table 92: Global MEA Centrifugal Pumps Industry Volume K Unit Forecast, by Country 2019 & 2032
- Table 93: Turkey MEA Centrifugal Pumps Industry Revenue (Million) Forecast, by Application 2019 & 2032
- Table 94: Turkey MEA Centrifugal Pumps Industry Volume (K Unit) Forecast, by Application 2019 & 2032
- Table 95: Israel MEA Centrifugal Pumps Industry Revenue (Million) Forecast, by Application 2019 & 2032
- Table 96: Israel MEA Centrifugal Pumps Industry Volume (K Unit) Forecast, by Application 2019 & 2032
- Table 97: GCC MEA Centrifugal Pumps Industry Revenue (Million) Forecast, by Application 2019 & 2032
- Table 98: GCC MEA Centrifugal Pumps Industry Volume (K Unit) Forecast, by Application 2019 & 2032
- Table 99: North Africa MEA Centrifugal Pumps Industry Revenue (Million) Forecast, by Application 2019 & 2032
- Table 100: North Africa MEA Centrifugal Pumps Industry Volume (K Unit) Forecast, by Application 2019 & 2032
- Table 101: South Africa MEA Centrifugal Pumps Industry Revenue (Million) Forecast, by Application 2019 & 2032
- Table 102: South Africa MEA Centrifugal Pumps Industry Volume (K Unit) Forecast, by Application 2019 & 2032
- Table 103: Rest of Middle East & Africa MEA Centrifugal Pumps Industry Revenue (Million) Forecast, by Application 2019 & 2032
- Table 104: Rest of Middle East & Africa MEA Centrifugal Pumps Industry Volume (K Unit) Forecast, by Application 2019 & 2032
- Table 105: Global MEA Centrifugal Pumps Industry Revenue Million Forecast, by Flow Type 2019 & 2032
- Table 106: Global MEA Centrifugal Pumps Industry Volume K Unit Forecast, by Flow Type 2019 & 2032
- Table 107: Global MEA Centrifugal Pumps Industry Revenue Million Forecast, by Number of Stages 2019 & 2032
- Table 108: Global MEA Centrifugal Pumps Industry Volume K Unit Forecast, by Number of Stages 2019 & 2032
- Table 109: Global MEA Centrifugal Pumps Industry Revenue Million Forecast, by End-User Industry 2019 & 2032
- Table 110: Global MEA Centrifugal Pumps Industry Volume K Unit Forecast, by End-User Industry 2019 & 2032
- Table 111: Global MEA Centrifugal Pumps Industry Revenue Million Forecast, by Country 2019 & 2032
- Table 112: Global MEA Centrifugal Pumps Industry Volume K Unit Forecast, by Country 2019 & 2032
- Table 113: China MEA Centrifugal Pumps Industry Revenue (Million) Forecast, by Application 2019 & 2032
- Table 114: China MEA Centrifugal Pumps Industry Volume (K Unit) Forecast, by Application 2019 & 2032
- Table 115: India MEA Centrifugal Pumps Industry Revenue (Million) Forecast, by Application 2019 & 2032
- Table 116: India MEA Centrifugal Pumps Industry Volume (K Unit) Forecast, by Application 2019 & 2032
- Table 117: Japan MEA Centrifugal Pumps Industry Revenue (Million) Forecast, by Application 2019 & 2032
- Table 118: Japan MEA Centrifugal Pumps Industry Volume (K Unit) Forecast, by Application 2019 & 2032
- Table 119: South Korea MEA Centrifugal Pumps Industry Revenue (Million) Forecast, by Application 2019 & 2032
- Table 120: South Korea MEA Centrifugal Pumps Industry Volume (K Unit) Forecast, by Application 2019 & 2032
- Table 121: ASEAN MEA Centrifugal Pumps Industry Revenue (Million) Forecast, by Application 2019 & 2032
- Table 122: ASEAN MEA Centrifugal Pumps Industry Volume (K Unit) Forecast, by Application 2019 & 2032
- Table 123: Oceania MEA Centrifugal Pumps Industry Revenue (Million) Forecast, by Application 2019 & 2032
- Table 124: Oceania MEA Centrifugal Pumps Industry Volume (K Unit) Forecast, by Application 2019 & 2032
- Table 125: Rest of Asia Pacific MEA Centrifugal Pumps Industry Revenue (Million) Forecast, by Application 2019 & 2032
- Table 126: Rest of Asia Pacific MEA Centrifugal Pumps Industry Volume (K Unit) Forecast, by Application 2019 & 2032
Frequently Asked Questions
1. What is the projected Compound Annual Growth Rate (CAGR) of the MEA Centrifugal Pumps Industry?
The projected CAGR is approximately 4.60%.
2. Which companies are prominent players in the MEA Centrifugal Pumps Industry?
Key companies in the market include Ebara Pumps Middle East FZE, KSB Middle East FZE, Flowserve Corporation, The Weir Group PLC, Ruhrpumpen Group, Dover Corporation, Baker Hughes Company, Xylem Inc , Schlumberger Limited, Parker Hannifin Corp.
3. What are the main segments of the MEA Centrifugal Pumps Industry?
The market segments include Flow Type, Number of Stages, End-User Industry.
4. Can you provide details about the market size?
The market size is estimated to be USD XX Million as of 2022.
5. What are some drivers contributing to market growth?
Rapid Industrialization & Urbanization; Increasing Investments in Urban Waste-Water Sector.
6. What are the notable trends driving market growth?
Water and Wastewater Management to Drive the Demand for Centrifugal Pumps.
7. Are there any restraints impacting market growth?
High Acquisition and Maintenace Cost of Industrial CT systems.
8. Can you provide examples of recent developments in the market?
June 2021 - Amarinth, a global manufacturer of low lifecycle cost centrifugal pumps and associated equipment for various industries, announced that it had secured an order with its agent NAMA for 14 API 610 VS4 vertical pumps from ISCCO for the ADNOC Ruwais Refinery East, UAE.
9. What pricing options are available for accessing the report?
Pricing options include single-user, multi-user, and enterprise licenses priced at USD 4750, USD 4950, and USD 6800 respectively.
10. Is the market size provided in terms of value or volume?
The market size is provided in terms of value, measured in Million and volume, measured in K Unit.
11. Are there any specific market keywords associated with the report?
Yes, the market keyword associated with the report is "MEA Centrifugal Pumps Industry," which aids in identifying and referencing the specific market segment covered.
12. How do I determine which pricing option suits my needs best?
The pricing options vary based on user requirements and access needs. Individual users may opt for single-user licenses, while businesses requiring broader access may choose multi-user or enterprise licenses for cost-effective access to the report.
13. Are there any additional resources or data provided in the MEA Centrifugal Pumps Industry report?
While the report offers comprehensive insights, it's advisable to review the specific contents or supplementary materials provided to ascertain if additional resources or data are available.
14. How can I stay updated on further developments or reports in the MEA Centrifugal Pumps Industry?
To stay informed about further developments, trends, and reports in the MEA Centrifugal Pumps Industry, consider subscribing to industry newsletters, following relevant companies and organizations, or regularly checking reputable industry news sources and publications.
Methodology
Step 1 - Identification of Relevant Samples Size from Population Database


Step 2 - Approaches for Defining Global Market Size (Value, Volume* & Price*)

Note*: In applicable scenarios
Step 3 - Data Sources
Primary Research
- Web Analytics
- Survey Reports
- Research Institute
- Latest Research Reports
- Opinion Leaders
Secondary Research
- Annual Reports
- White Paper
- Latest Press Release
- Industry Association
- Paid Database
- Investor Presentations

Step 4 - Data Triangulation
Involves using different sources of information in order to increase the validity of a study
These sources are likely to be stakeholders in a program - participants, other researchers, program staff, other community members, and so on.
Then we put all data in single framework & apply various statistical tools to find out the dynamic on the market.
During the analysis stage, feedback from the stakeholder groups would be compared to determine areas of agreement as well as areas of divergence


