
Key Insights
The MEA Demand Response Management Systems (DRMS) market is experiencing robust growth, driven by increasing electricity demand, rising energy costs, and a growing emphasis on grid stability and renewable energy integration. Governments across the region are actively promoting energy efficiency initiatives and smart grid technologies, creating a favorable regulatory environment for DRMS adoption. The market is segmented into conventional and automated DRMS, with automated systems witnessing faster growth due to their enhanced capabilities in optimizing energy consumption and grid response. Key players like ABB, Siemens, and Schneider Electric are actively expanding their presence in the MEA region, offering advanced DRMS solutions tailored to the specific needs of utilities and large consumers. The significant investments in smart grid infrastructure and the increasing penetration of renewable energy sources are further fueling market expansion. While challenges remain, such as the initial investment costs associated with DRMS implementation and a lack of awareness in some sectors, the long-term benefits of improved grid efficiency, reduced energy costs, and enhanced grid resilience are outweighing these hurdles.
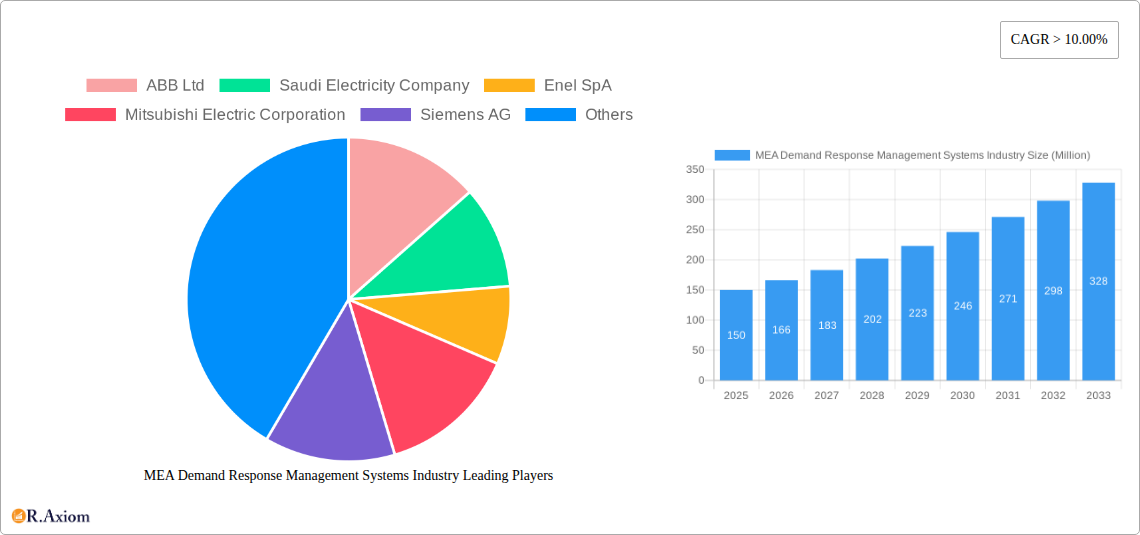
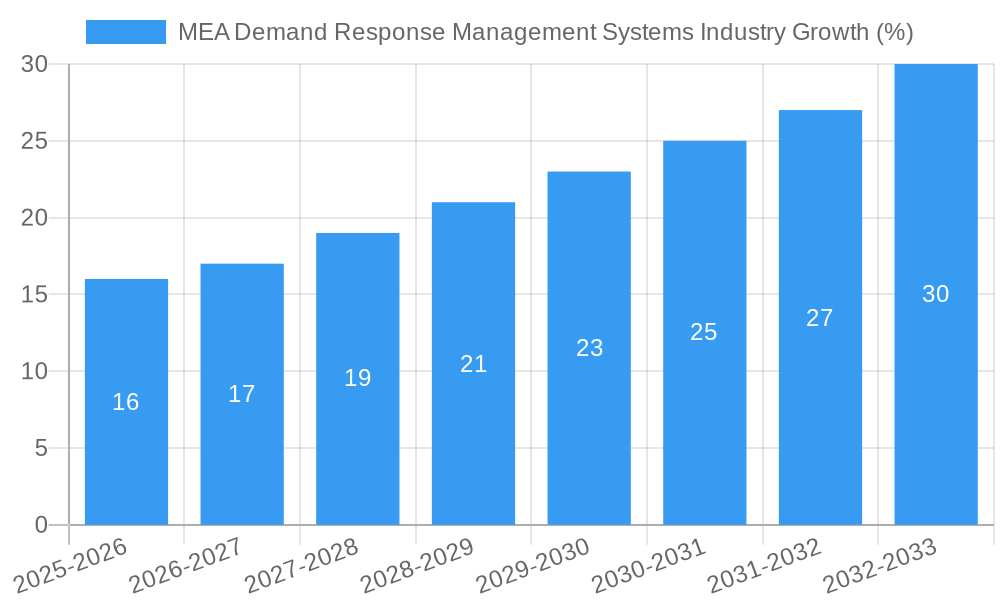
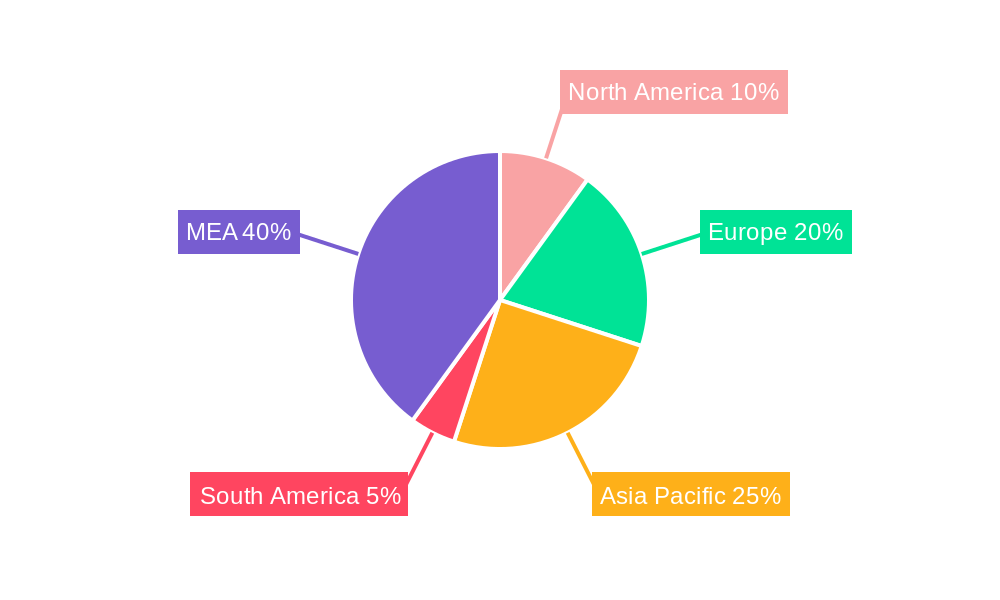
The forecast period (2025-2033) anticipates continued expansion of the MEA DRMS market, with a CAGR exceeding 10%. This growth is projected to be particularly strong in countries like the UAE and Saudi Arabia, driven by large-scale infrastructure projects and ambitious renewable energy targets. The market will likely see increased adoption of sophisticated analytics and AI-powered DRMS solutions to enhance grid management and improve energy efficiency further. Furthermore, the ongoing digital transformation in the energy sector, coupled with rising consumer awareness of sustainable practices, will contribute to the market's sustained growth trajectory. The focus on improving grid reliability and optimizing energy resources in a region facing diverse climate conditions and increasing urbanization will be central to future market trends.
This in-depth report provides a comprehensive analysis of the MEA Demand Response Management Systems industry, covering market size, segmentation, growth drivers, challenges, and key players. The report uses data from the historical period (2019-2024), base year (2025), and estimated year (2025) to forecast market trends up to 2033. The study period encompasses significant industry developments and provides actionable insights for stakeholders. The total market size in 2025 is estimated at $XX Million, projected to reach $XX Million by 2033, exhibiting a CAGR of XX% during the forecast period (2025-2033).
MEA Demand Response Management Systems Industry Market Concentration & Innovation
The MEA Demand Response Management Systems market exhibits a moderately concentrated landscape, with key players like ABB Ltd, ABB Ltd, Saudi Electricity Company, Enel SpA, Mitsubishi Electric Corporation, Siemens AG, Alstom SA, Eaton Corporation PLC, Schneider Electric, General Electric Company holding significant market share. Precise market share figures are not publicly available for all companies, but estimates place the top five players at approximately XX% combined market share in 2025. The industry is characterized by ongoing innovation, driven by the need for efficient energy management and increasing adoption of smart grid technologies.
- Market Concentration: Moderately concentrated, with top players holding a significant share.
- Innovation Drivers: Smart grid technologies, increasing energy costs, government regulations promoting energy efficiency.
- Regulatory Frameworks: Vary across MEA countries, influencing market growth and adoption rates. Stringent regulations in some nations drive innovation and adoption while less stringent ones hinder it.
- Product Substitutes: Limited, as demand response systems are crucial for efficient grid management and energy savings.
- End-User Trends: Growing preference for automated systems and integrated solutions.
- M&A Activities: Moderate M&A activity observed, with deal values in the range of $XX Million to $XX Million, focusing on technology acquisition and market expansion. Increased consolidation is expected in the coming years.
MEA Demand Response Management Systems Industry Industry Trends & Insights
The MEA Demand Response Management Systems market is experiencing robust growth, driven by increasing energy demand, government initiatives promoting energy efficiency, and the rising adoption of renewable energy sources. The region's commitment to diversifying its energy mix is a significant catalyst for growth. Technological advancements, particularly in the areas of AI and IoT, are revolutionizing demand response systems, enabling more efficient and precise energy management. Consumers are increasingly adopting automated demand response solutions due to convenience and cost savings. Competitive dynamics are intense, with established players and new entrants vying for market share. The market penetration rate for automated demand response systems is currently at XX% and is expected to reach XX% by 2033.
Dominant Markets & Segments in MEA Demand Response Management Systems Industry
The UAE and Saudi Arabia are currently the dominant markets within the MEA region for demand response management systems, primarily due to their significant investments in infrastructure development and robust government support for energy efficiency initiatives. The industrial sector constitutes the largest segment, followed by the commercial and residential sectors.
Automated Demand Response is witnessing faster growth compared to conventional demand response due to its superior efficiency and cost-effectiveness. This segment accounts for an estimated XX% market share in 2025.
Key Drivers for UAE and Saudi Arabia Dominance:
- Substantial investments in renewable energy and smart grid infrastructure.
- Government policies and incentives promoting energy efficiency and demand-side management.
- Growing industrialization and urbanization, leading to increased energy demand.
- High energy costs driving the need for cost-effective energy management solutions.
Dominant Segment: Automated Demand Response. The ease of implementation and superior performance compared to conventional methods are driving its accelerated adoption.
MEA Demand Response Management Systems Industry Product Developments
Recent product developments focus on improving the accuracy and efficiency of demand response systems through AI-powered predictive analytics and advanced data management capabilities. This includes advancements in energy storage integration, enhancing the reliability and effectiveness of demand response programs. These innovations cater to the rising demand for smart, automated solutions and contribute to substantial energy savings, driving market growth.
Report Scope & Segmentation Analysis
The report segments the MEA Demand Response Management Systems market based on type:
Conventional Demand Response: This segment includes manually controlled demand response programs. It is projected to grow at a CAGR of XX% during the forecast period, driven by the relatively lower initial investment cost compared to automated solutions. However, this segment faces challenges from the rising popularity of automated alternatives. Market size in 2025 is estimated at $XX Million.
Automated Demand Response: This segment includes systems that automatically adjust energy consumption based on pre-programmed rules or real-time grid conditions. It's projected to experience the most significant growth, with a CAGR of XX% during the forecast period, owing to its greater efficiency, flexibility, and cost-effectiveness in the long run. The market size in 2025 is estimated at $XX Million.
Key Drivers of MEA Demand Response Management Systems Industry Growth
The MEA Demand Response Management Systems industry growth is fueled by:
- Technological Advancements: AI-powered predictive analytics, IoT integration, and advancements in energy storage technologies.
- Government Initiatives: Policies and regulations promoting energy efficiency and renewable energy adoption. The ETIP 2.0 program in Abu Dhabi and the NWEDMP in the UAE serve as prime examples.
- Increasing Energy Costs: The rising cost of electricity is incentivizing businesses and consumers to adopt demand response systems to reduce energy consumption and costs.
- Growing Demand for Sustainable Solutions: Concerns about climate change are driving the adoption of energy-efficient technologies.
Challenges in the MEA Demand Response Management Systems Industry Sector
Challenges facing the industry include:
- Regulatory Hurdles: Inconsistencies in regulatory frameworks across different MEA countries can hinder market growth.
- Lack of Awareness: Limited awareness of demand response technologies amongst consumers and businesses can slow down adoption rates.
- High Initial Investment Costs: The initial investment for some automated demand response systems can be significant, deterring some potential adopters.
- Cybersecurity Risks: The increasing reliance on digital infrastructure presents vulnerabilities to cyberattacks.
Emerging Opportunities in MEA Demand Response Management Systems Industry
The industry presents significant opportunities in:
- Expansion into Untapped Markets: Significant growth potential exists in less developed markets within the MEA region.
- Development of Integrated Solutions: Integrating demand response systems with other smart grid technologies offers significant potential.
- Adoption of Advanced Analytics: Leveraging AI and machine learning for predictive demand response will drive efficiency gains.
Leading Players in the MEA Demand Response Management Systems Industry Market
- ABB Ltd
- Saudi Electricity Company
- Enel SpA
- Mitsubishi Electric Corporation
- Siemens AG
- Alstom SA
- Eaton Corporation PLC
- Schneider Electric
- General Electric Company
Key Developments in MEA Demand Response Management Systems Industry Industry
November 2022: The Abu Dhabi Department of Economic Development (ADDED) launched ETIP 2.0, offering preferential energy rates to incentivize energy efficiency. This significantly boosts the adoption of demand response systems within the industrial sector.
April 2022: The UAE Ministry of Energy and Infrastructure launched a database to monitor energy and water consumption in government buildings. This initiative aids in identifying areas for improvement and accelerates the adoption of energy-efficient solutions, indirectly fostering demand for demand response systems.
Strategic Outlook for MEA Demand Response Management Systems Industry Market
The MEA Demand Response Management Systems market is poised for significant growth over the forecast period, driven by the increasing focus on energy efficiency, government support, and technological advancements. The adoption of automated demand response systems is expected to accelerate, offering cost savings and enhancing grid stability. Companies that innovate and adapt to changing market dynamics will be well-positioned to capture significant market share.
MEA Demand Response Management Systems Industry Segmentation
-
1. Type
- 1.1. Conventional Demand Response
- 1.2. Automated Demand Response
-
2. Geography
- 2.1. United Arab Emirates
- 2.2. Saudi Arabian
- 2.3. South Africa
- 2.4. Res of Middle-East and Africa
MEA Demand Response Management Systems Industry Segmentation By Geography
- 1. United Arab Emirates
- 2. Saudi Arabian
- 3. South Africa
- 4. Res of Middle East and Africa
MEA Demand Response Management Systems Industry REPORT HIGHLIGHTS
| Aspects | Details |
|---|---|
| Study Period | 2019-2033 |
| Base Year | 2024 |
| Estimated Year | 2025 |
| Forecast Period | 2025-2033 |
| Historical Period | 2019-2024 |
| Growth Rate | CAGR of > 10.00% from 2019-2033 |
| Segmentation |
|
Table of Contents
- 1. Introduction
- 1.1. Research Scope
- 1.2. Market Segmentation
- 1.3. Research Methodology
- 1.4. Definitions and Assumptions
- 2. Executive Summary
- 2.1. Introduction
- 3. Market Dynamics
- 3.1. Introduction
- 3.2. Market Drivers
- 3.2.1. 4.; Need for Efficient Energy Management Systems4.; Growing Penetration of Renewable Energy Sources
- 3.3. Market Restrains
- 3.3.1. 4.; Privacy Concerns on the Industrial Demand Response Management Systems
- 3.4. Market Trends
- 3.4.1. Automated Demand Response System to Grow at the Fastest Rate
- 4. Market Factor Analysis
- 4.1. Porters Five Forces
- 4.2. Supply/Value Chain
- 4.3. PESTEL analysis
- 4.4. Market Entropy
- 4.5. Patent/Trademark Analysis
- 5. Global MEA Demand Response Management Systems Industry Analysis, Insights and Forecast, 2019-2031
- 5.1. Market Analysis, Insights and Forecast - by Type
- 5.1.1. Conventional Demand Response
- 5.1.2. Automated Demand Response
- 5.2. Market Analysis, Insights and Forecast - by Geography
- 5.2.1. United Arab Emirates
- 5.2.2. Saudi Arabian
- 5.2.3. South Africa
- 5.2.4. Res of Middle-East and Africa
- 5.3. Market Analysis, Insights and Forecast - by Region
- 5.3.1. United Arab Emirates
- 5.3.2. Saudi Arabian
- 5.3.3. South Africa
- 5.3.4. Res of Middle East and Africa
- 5.1. Market Analysis, Insights and Forecast - by Type
- 6. United Arab Emirates MEA Demand Response Management Systems Industry Analysis, Insights and Forecast, 2019-2031
- 6.1. Market Analysis, Insights and Forecast - by Type
- 6.1.1. Conventional Demand Response
- 6.1.2. Automated Demand Response
- 6.2. Market Analysis, Insights and Forecast - by Geography
- 6.2.1. United Arab Emirates
- 6.2.2. Saudi Arabian
- 6.2.3. South Africa
- 6.2.4. Res of Middle-East and Africa
- 6.1. Market Analysis, Insights and Forecast - by Type
- 7. Saudi Arabian MEA Demand Response Management Systems Industry Analysis, Insights and Forecast, 2019-2031
- 7.1. Market Analysis, Insights and Forecast - by Type
- 7.1.1. Conventional Demand Response
- 7.1.2. Automated Demand Response
- 7.2. Market Analysis, Insights and Forecast - by Geography
- 7.2.1. United Arab Emirates
- 7.2.2. Saudi Arabian
- 7.2.3. South Africa
- 7.2.4. Res of Middle-East and Africa
- 7.1. Market Analysis, Insights and Forecast - by Type
- 8. South Africa MEA Demand Response Management Systems Industry Analysis, Insights and Forecast, 2019-2031
- 8.1. Market Analysis, Insights and Forecast - by Type
- 8.1.1. Conventional Demand Response
- 8.1.2. Automated Demand Response
- 8.2. Market Analysis, Insights and Forecast - by Geography
- 8.2.1. United Arab Emirates
- 8.2.2. Saudi Arabian
- 8.2.3. South Africa
- 8.2.4. Res of Middle-East and Africa
- 8.1. Market Analysis, Insights and Forecast - by Type
- 9. Res of Middle East and Africa MEA Demand Response Management Systems Industry Analysis, Insights and Forecast, 2019-2031
- 9.1. Market Analysis, Insights and Forecast - by Type
- 9.1.1. Conventional Demand Response
- 9.1.2. Automated Demand Response
- 9.2. Market Analysis, Insights and Forecast - by Geography
- 9.2.1. United Arab Emirates
- 9.2.2. Saudi Arabian
- 9.2.3. South Africa
- 9.2.4. Res of Middle-East and Africa
- 9.1. Market Analysis, Insights and Forecast - by Type
- 10. North America MEA Demand Response Management Systems Industry Analysis, Insights and Forecast, 2019-2031
- 10.1. Market Analysis, Insights and Forecast - By Country/Sub-region
- 10.1.1 United States
- 10.1.2 Canada
- 10.1.3 Mexico
- 11. Europe MEA Demand Response Management Systems Industry Analysis, Insights and Forecast, 2019-2031
- 11.1. Market Analysis, Insights and Forecast - By Country/Sub-region
- 11.1.1 Germany
- 11.1.2 United Kingdom
- 11.1.3 France
- 11.1.4 Spain
- 11.1.5 Italy
- 11.1.6 Spain
- 11.1.7 Belgium
- 11.1.8 Netherland
- 11.1.9 Nordics
- 11.1.10 Rest of Europe
- 12. Asia Pacific MEA Demand Response Management Systems Industry Analysis, Insights and Forecast, 2019-2031
- 12.1. Market Analysis, Insights and Forecast - By Country/Sub-region
- 12.1.1 China
- 12.1.2 Japan
- 12.1.3 India
- 12.1.4 South Korea
- 12.1.5 Southeast Asia
- 12.1.6 Australia
- 12.1.7 Indonesia
- 12.1.8 Phillipes
- 12.1.9 Singapore
- 12.1.10 Thailandc
- 12.1.11 Rest of Asia Pacific
- 13. South America MEA Demand Response Management Systems Industry Analysis, Insights and Forecast, 2019-2031
- 13.1. Market Analysis, Insights and Forecast - By Country/Sub-region
- 13.1.1 Brazil
- 13.1.2 Argentina
- 13.1.3 Peru
- 13.1.4 Chile
- 13.1.5 Colombia
- 13.1.6 Ecuador
- 13.1.7 Venezuela
- 13.1.8 Rest of South America
- 14. MEA MEA Demand Response Management Systems Industry Analysis, Insights and Forecast, 2019-2031
- 14.1. Market Analysis, Insights and Forecast - By Country/Sub-region
- 14.1.1 United Arab Emirates
- 14.1.2 Saudi Arabia
- 14.1.3 South Africa
- 14.1.4 Rest of Middle East and Africa
- 15. Competitive Analysis
- 15.1. Global Market Share Analysis 2024
- 15.2. Company Profiles
- 15.2.1 ABB Ltd
- 15.2.1.1. Overview
- 15.2.1.2. Products
- 15.2.1.3. SWOT Analysis
- 15.2.1.4. Recent Developments
- 15.2.1.5. Financials (Based on Availability)
- 15.2.2 Saudi Electricity Company
- 15.2.2.1. Overview
- 15.2.2.2. Products
- 15.2.2.3. SWOT Analysis
- 15.2.2.4. Recent Developments
- 15.2.2.5. Financials (Based on Availability)
- 15.2.3 Enel SpA
- 15.2.3.1. Overview
- 15.2.3.2. Products
- 15.2.3.3. SWOT Analysis
- 15.2.3.4. Recent Developments
- 15.2.3.5. Financials (Based on Availability)
- 15.2.4 Mitsubishi Electric Corporation
- 15.2.4.1. Overview
- 15.2.4.2. Products
- 15.2.4.3. SWOT Analysis
- 15.2.4.4. Recent Developments
- 15.2.4.5. Financials (Based on Availability)
- 15.2.5 Siemens AG
- 15.2.5.1. Overview
- 15.2.5.2. Products
- 15.2.5.3. SWOT Analysis
- 15.2.5.4. Recent Developments
- 15.2.5.5. Financials (Based on Availability)
- 15.2.6 Alstom SA
- 15.2.6.1. Overview
- 15.2.6.2. Products
- 15.2.6.3. SWOT Analysis
- 15.2.6.4. Recent Developments
- 15.2.6.5. Financials (Based on Availability)
- 15.2.7 Eaton Corporation PLC
- 15.2.7.1. Overview
- 15.2.7.2. Products
- 15.2.7.3. SWOT Analysis
- 15.2.7.4. Recent Developments
- 15.2.7.5. Financials (Based on Availability)
- 15.2.8 Schneider Electric
- 15.2.8.1. Overview
- 15.2.8.2. Products
- 15.2.8.3. SWOT Analysis
- 15.2.8.4. Recent Developments
- 15.2.8.5. Financials (Based on Availability)
- 15.2.9 General Electric Company
- 15.2.9.1. Overview
- 15.2.9.2. Products
- 15.2.9.3. SWOT Analysis
- 15.2.9.4. Recent Developments
- 15.2.9.5. Financials (Based on Availability)
- 15.2.1 ABB Ltd
List of Figures
- Figure 1: Global MEA Demand Response Management Systems Industry Revenue Breakdown (Million, %) by Region 2024 & 2032
- Figure 2: North America MEA Demand Response Management Systems Industry Revenue (Million), by Country 2024 & 2032
- Figure 3: North America MEA Demand Response Management Systems Industry Revenue Share (%), by Country 2024 & 2032
- Figure 4: Europe MEA Demand Response Management Systems Industry Revenue (Million), by Country 2024 & 2032
- Figure 5: Europe MEA Demand Response Management Systems Industry Revenue Share (%), by Country 2024 & 2032
- Figure 6: Asia Pacific MEA Demand Response Management Systems Industry Revenue (Million), by Country 2024 & 2032
- Figure 7: Asia Pacific MEA Demand Response Management Systems Industry Revenue Share (%), by Country 2024 & 2032
- Figure 8: South America MEA Demand Response Management Systems Industry Revenue (Million), by Country 2024 & 2032
- Figure 9: South America MEA Demand Response Management Systems Industry Revenue Share (%), by Country 2024 & 2032
- Figure 10: MEA MEA Demand Response Management Systems Industry Revenue (Million), by Country 2024 & 2032
- Figure 11: MEA MEA Demand Response Management Systems Industry Revenue Share (%), by Country 2024 & 2032
- Figure 12: United Arab Emirates MEA Demand Response Management Systems Industry Revenue (Million), by Type 2024 & 2032
- Figure 13: United Arab Emirates MEA Demand Response Management Systems Industry Revenue Share (%), by Type 2024 & 2032
- Figure 14: United Arab Emirates MEA Demand Response Management Systems Industry Revenue (Million), by Geography 2024 & 2032
- Figure 15: United Arab Emirates MEA Demand Response Management Systems Industry Revenue Share (%), by Geography 2024 & 2032
- Figure 16: United Arab Emirates MEA Demand Response Management Systems Industry Revenue (Million), by Country 2024 & 2032
- Figure 17: United Arab Emirates MEA Demand Response Management Systems Industry Revenue Share (%), by Country 2024 & 2032
- Figure 18: Saudi Arabian MEA Demand Response Management Systems Industry Revenue (Million), by Type 2024 & 2032
- Figure 19: Saudi Arabian MEA Demand Response Management Systems Industry Revenue Share (%), by Type 2024 & 2032
- Figure 20: Saudi Arabian MEA Demand Response Management Systems Industry Revenue (Million), by Geography 2024 & 2032
- Figure 21: Saudi Arabian MEA Demand Response Management Systems Industry Revenue Share (%), by Geography 2024 & 2032
- Figure 22: Saudi Arabian MEA Demand Response Management Systems Industry Revenue (Million), by Country 2024 & 2032
- Figure 23: Saudi Arabian MEA Demand Response Management Systems Industry Revenue Share (%), by Country 2024 & 2032
- Figure 24: South Africa MEA Demand Response Management Systems Industry Revenue (Million), by Type 2024 & 2032
- Figure 25: South Africa MEA Demand Response Management Systems Industry Revenue Share (%), by Type 2024 & 2032
- Figure 26: South Africa MEA Demand Response Management Systems Industry Revenue (Million), by Geography 2024 & 2032
- Figure 27: South Africa MEA Demand Response Management Systems Industry Revenue Share (%), by Geography 2024 & 2032
- Figure 28: South Africa MEA Demand Response Management Systems Industry Revenue (Million), by Country 2024 & 2032
- Figure 29: South Africa MEA Demand Response Management Systems Industry Revenue Share (%), by Country 2024 & 2032
- Figure 30: Res of Middle East and Africa MEA Demand Response Management Systems Industry Revenue (Million), by Type 2024 & 2032
- Figure 31: Res of Middle East and Africa MEA Demand Response Management Systems Industry Revenue Share (%), by Type 2024 & 2032
- Figure 32: Res of Middle East and Africa MEA Demand Response Management Systems Industry Revenue (Million), by Geography 2024 & 2032
- Figure 33: Res of Middle East and Africa MEA Demand Response Management Systems Industry Revenue Share (%), by Geography 2024 & 2032
- Figure 34: Res of Middle East and Africa MEA Demand Response Management Systems Industry Revenue (Million), by Country 2024 & 2032
- Figure 35: Res of Middle East and Africa MEA Demand Response Management Systems Industry Revenue Share (%), by Country 2024 & 2032
List of Tables
- Table 1: Global MEA Demand Response Management Systems Industry Revenue Million Forecast, by Region 2019 & 2032
- Table 2: Global MEA Demand Response Management Systems Industry Revenue Million Forecast, by Type 2019 & 2032
- Table 3: Global MEA Demand Response Management Systems Industry Revenue Million Forecast, by Geography 2019 & 2032
- Table 4: Global MEA Demand Response Management Systems Industry Revenue Million Forecast, by Region 2019 & 2032
- Table 5: Global MEA Demand Response Management Systems Industry Revenue Million Forecast, by Country 2019 & 2032
- Table 6: United States MEA Demand Response Management Systems Industry Revenue (Million) Forecast, by Application 2019 & 2032
- Table 7: Canada MEA Demand Response Management Systems Industry Revenue (Million) Forecast, by Application 2019 & 2032
- Table 8: Mexico MEA Demand Response Management Systems Industry Revenue (Million) Forecast, by Application 2019 & 2032
- Table 9: Global MEA Demand Response Management Systems Industry Revenue Million Forecast, by Country 2019 & 2032
- Table 10: Germany MEA Demand Response Management Systems Industry Revenue (Million) Forecast, by Application 2019 & 2032
- Table 11: United Kingdom MEA Demand Response Management Systems Industry Revenue (Million) Forecast, by Application 2019 & 2032
- Table 12: France MEA Demand Response Management Systems Industry Revenue (Million) Forecast, by Application 2019 & 2032
- Table 13: Spain MEA Demand Response Management Systems Industry Revenue (Million) Forecast, by Application 2019 & 2032
- Table 14: Italy MEA Demand Response Management Systems Industry Revenue (Million) Forecast, by Application 2019 & 2032
- Table 15: Spain MEA Demand Response Management Systems Industry Revenue (Million) Forecast, by Application 2019 & 2032
- Table 16: Belgium MEA Demand Response Management Systems Industry Revenue (Million) Forecast, by Application 2019 & 2032
- Table 17: Netherland MEA Demand Response Management Systems Industry Revenue (Million) Forecast, by Application 2019 & 2032
- Table 18: Nordics MEA Demand Response Management Systems Industry Revenue (Million) Forecast, by Application 2019 & 2032
- Table 19: Rest of Europe MEA Demand Response Management Systems Industry Revenue (Million) Forecast, by Application 2019 & 2032
- Table 20: Global MEA Demand Response Management Systems Industry Revenue Million Forecast, by Country 2019 & 2032
- Table 21: China MEA Demand Response Management Systems Industry Revenue (Million) Forecast, by Application 2019 & 2032
- Table 22: Japan MEA Demand Response Management Systems Industry Revenue (Million) Forecast, by Application 2019 & 2032
- Table 23: India MEA Demand Response Management Systems Industry Revenue (Million) Forecast, by Application 2019 & 2032
- Table 24: South Korea MEA Demand Response Management Systems Industry Revenue (Million) Forecast, by Application 2019 & 2032
- Table 25: Southeast Asia MEA Demand Response Management Systems Industry Revenue (Million) Forecast, by Application 2019 & 2032
- Table 26: Australia MEA Demand Response Management Systems Industry Revenue (Million) Forecast, by Application 2019 & 2032
- Table 27: Indonesia MEA Demand Response Management Systems Industry Revenue (Million) Forecast, by Application 2019 & 2032
- Table 28: Phillipes MEA Demand Response Management Systems Industry Revenue (Million) Forecast, by Application 2019 & 2032
- Table 29: Singapore MEA Demand Response Management Systems Industry Revenue (Million) Forecast, by Application 2019 & 2032
- Table 30: Thailandc MEA Demand Response Management Systems Industry Revenue (Million) Forecast, by Application 2019 & 2032
- Table 31: Rest of Asia Pacific MEA Demand Response Management Systems Industry Revenue (Million) Forecast, by Application 2019 & 2032
- Table 32: Global MEA Demand Response Management Systems Industry Revenue Million Forecast, by Country 2019 & 2032
- Table 33: Brazil MEA Demand Response Management Systems Industry Revenue (Million) Forecast, by Application 2019 & 2032
- Table 34: Argentina MEA Demand Response Management Systems Industry Revenue (Million) Forecast, by Application 2019 & 2032
- Table 35: Peru MEA Demand Response Management Systems Industry Revenue (Million) Forecast, by Application 2019 & 2032
- Table 36: Chile MEA Demand Response Management Systems Industry Revenue (Million) Forecast, by Application 2019 & 2032
- Table 37: Colombia MEA Demand Response Management Systems Industry Revenue (Million) Forecast, by Application 2019 & 2032
- Table 38: Ecuador MEA Demand Response Management Systems Industry Revenue (Million) Forecast, by Application 2019 & 2032
- Table 39: Venezuela MEA Demand Response Management Systems Industry Revenue (Million) Forecast, by Application 2019 & 2032
- Table 40: Rest of South America MEA Demand Response Management Systems Industry Revenue (Million) Forecast, by Application 2019 & 2032
- Table 41: Global MEA Demand Response Management Systems Industry Revenue Million Forecast, by Country 2019 & 2032
- Table 42: United Arab Emirates MEA Demand Response Management Systems Industry Revenue (Million) Forecast, by Application 2019 & 2032
- Table 43: Saudi Arabia MEA Demand Response Management Systems Industry Revenue (Million) Forecast, by Application 2019 & 2032
- Table 44: South Africa MEA Demand Response Management Systems Industry Revenue (Million) Forecast, by Application 2019 & 2032
- Table 45: Rest of Middle East and Africa MEA Demand Response Management Systems Industry Revenue (Million) Forecast, by Application 2019 & 2032
- Table 46: Global MEA Demand Response Management Systems Industry Revenue Million Forecast, by Type 2019 & 2032
- Table 47: Global MEA Demand Response Management Systems Industry Revenue Million Forecast, by Geography 2019 & 2032
- Table 48: Global MEA Demand Response Management Systems Industry Revenue Million Forecast, by Country 2019 & 2032
- Table 49: Global MEA Demand Response Management Systems Industry Revenue Million Forecast, by Type 2019 & 2032
- Table 50: Global MEA Demand Response Management Systems Industry Revenue Million Forecast, by Geography 2019 & 2032
- Table 51: Global MEA Demand Response Management Systems Industry Revenue Million Forecast, by Country 2019 & 2032
- Table 52: Global MEA Demand Response Management Systems Industry Revenue Million Forecast, by Type 2019 & 2032
- Table 53: Global MEA Demand Response Management Systems Industry Revenue Million Forecast, by Geography 2019 & 2032
- Table 54: Global MEA Demand Response Management Systems Industry Revenue Million Forecast, by Country 2019 & 2032
- Table 55: Global MEA Demand Response Management Systems Industry Revenue Million Forecast, by Type 2019 & 2032
- Table 56: Global MEA Demand Response Management Systems Industry Revenue Million Forecast, by Geography 2019 & 2032
- Table 57: Global MEA Demand Response Management Systems Industry Revenue Million Forecast, by Country 2019 & 2032
Frequently Asked Questions
1. What is the projected Compound Annual Growth Rate (CAGR) of the MEA Demand Response Management Systems Industry?
The projected CAGR is approximately > 10.00%.
2. Which companies are prominent players in the MEA Demand Response Management Systems Industry?
Key companies in the market include ABB Ltd, Saudi Electricity Company, Enel SpA, Mitsubishi Electric Corporation, Siemens AG, Alstom SA, Eaton Corporation PLC, Schneider Electric, General Electric Company.
3. What are the main segments of the MEA Demand Response Management Systems Industry?
The market segments include Type, Geography.
4. Can you provide details about the market size?
The market size is estimated to be USD XX Million as of 2022.
5. What are some drivers contributing to market growth?
4.; Need for Efficient Energy Management Systems4.; Growing Penetration of Renewable Energy Sources.
6. What are the notable trends driving market growth?
Automated Demand Response System to Grow at the Fastest Rate.
7. Are there any restraints impacting market growth?
4.; Privacy Concerns on the Industrial Demand Response Management Systems.
8. Can you provide examples of recent developments in the market?
Nov 2022: The Abu Dhabi Department of Economic Development (ADDED) expanded the Energy Tariff Incentive Programme (ETIP 2.0) by offering preferential rates for gas and electricity to the industrial sector based on eligibility criteria that include economic impact, Emiratisation rate, and energy management efficiency.
9. What pricing options are available for accessing the report?
Pricing options include single-user, multi-user, and enterprise licenses priced at USD 4750, USD 5250, and USD 8750 respectively.
10. Is the market size provided in terms of value or volume?
The market size is provided in terms of value, measured in Million.
11. Are there any specific market keywords associated with the report?
Yes, the market keyword associated with the report is "MEA Demand Response Management Systems Industry," which aids in identifying and referencing the specific market segment covered.
12. How do I determine which pricing option suits my needs best?
The pricing options vary based on user requirements and access needs. Individual users may opt for single-user licenses, while businesses requiring broader access may choose multi-user or enterprise licenses for cost-effective access to the report.
13. Are there any additional resources or data provided in the MEA Demand Response Management Systems Industry report?
While the report offers comprehensive insights, it's advisable to review the specific contents or supplementary materials provided to ascertain if additional resources or data are available.
14. How can I stay updated on further developments or reports in the MEA Demand Response Management Systems Industry?
To stay informed about further developments, trends, and reports in the MEA Demand Response Management Systems Industry, consider subscribing to industry newsletters, following relevant companies and organizations, or regularly checking reputable industry news sources and publications.
Methodology
Step 1 - Identification of Relevant Samples Size from Population Database


Step 2 - Approaches for Defining Global Market Size (Value, Volume* & Price*)

Note*: In applicable scenarios
Step 3 - Data Sources
Primary Research
- Web Analytics
- Survey Reports
- Research Institute
- Latest Research Reports
- Opinion Leaders
Secondary Research
- Annual Reports
- White Paper
- Latest Press Release
- Industry Association
- Paid Database
- Investor Presentations

Step 4 - Data Triangulation
Involves using different sources of information in order to increase the validity of a study
These sources are likely to be stakeholders in a program - participants, other researchers, program staff, other community members, and so on.
Then we put all data in single framework & apply various statistical tools to find out the dynamic on the market.
During the analysis stage, feedback from the stakeholder groups would be compared to determine areas of agreement as well as areas of divergence


