
Key Insights
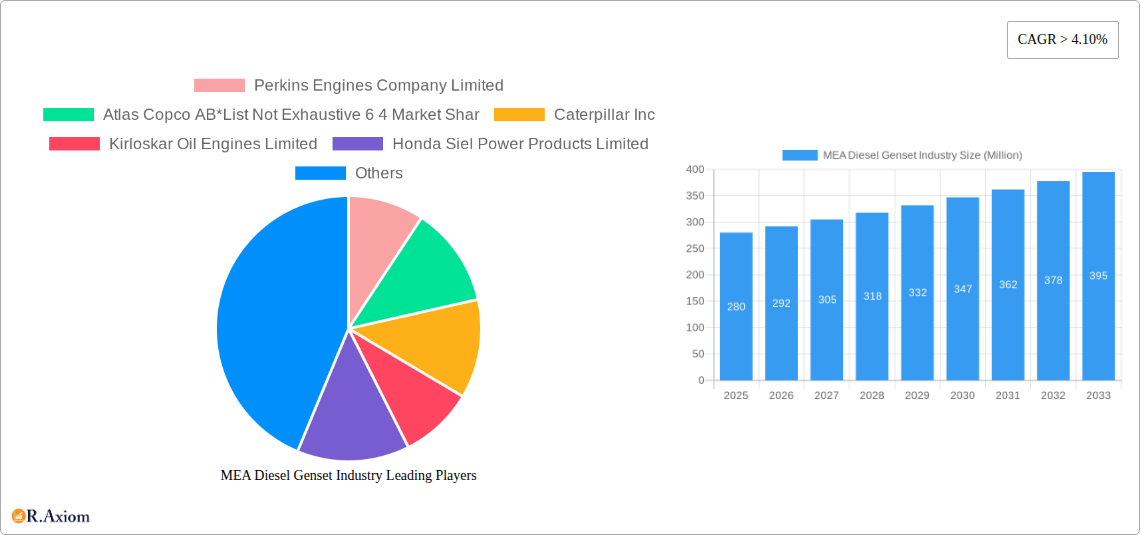
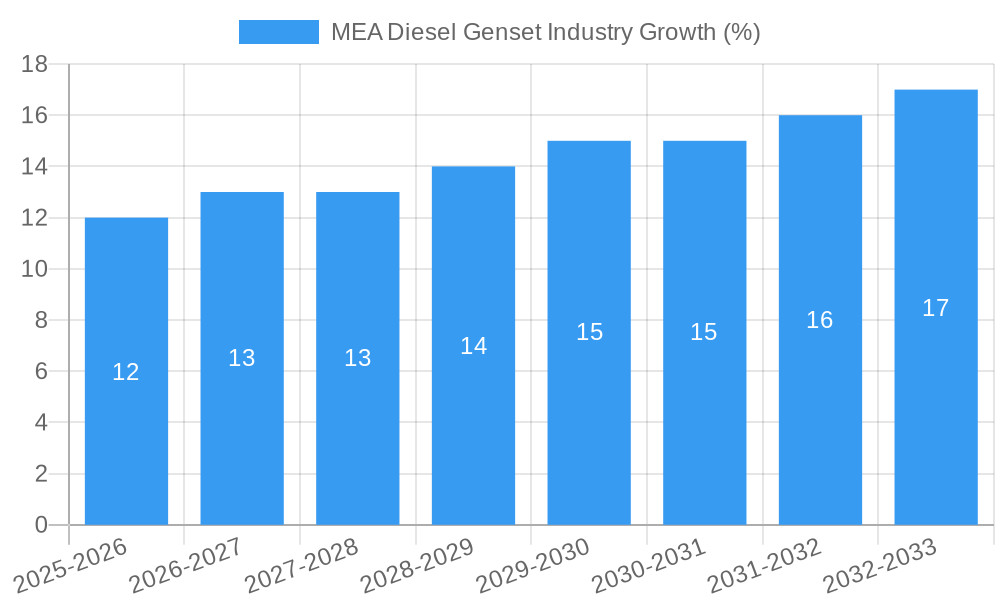
The MEA (Middle East and Africa) diesel genset market, valued at approximately $280 million in 2025, is projected to experience robust growth with a Compound Annual Growth Rate (CAGR) exceeding 4.10% from 2025 to 2033. This growth is fueled by several key factors. Increased industrialization and urbanization across the region are driving demand for reliable power solutions, particularly in areas with inconsistent grid infrastructure. The expansion of the construction sector, coupled with the rising adoption of diesel gensets in sectors like telecom, healthcare, and data centers, further contributes to market expansion. Furthermore, government initiatives aimed at improving power infrastructure in developing nations are indirectly boosting the market, as diesel gensets often serve as a crucial interim solution. However, stringent emission regulations and increasing adoption of renewable energy sources present challenges to the market's sustained growth. The market segmentation reveals a significant share held by the 75-375 kVA rating range, reflecting the prevalent need for medium-sized power generation units across various applications. Prime power applications continue to dominate, indicating the vital role diesel gensets play as primary power sources in many MEA regions.
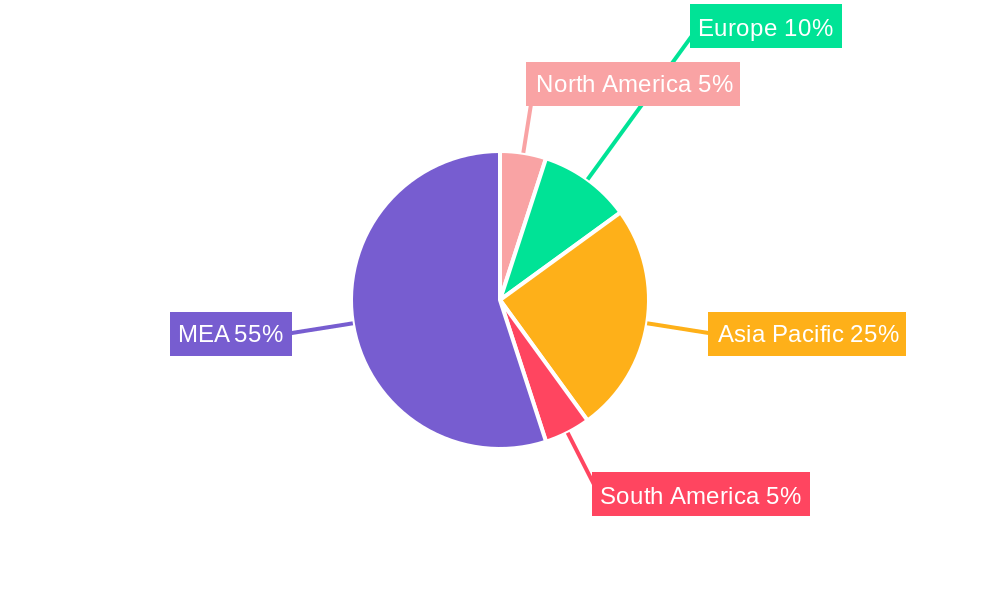
The competitive landscape is characterized by a mix of global giants like Caterpillar, Cummins, and Kohler, alongside regional players. These companies are investing in technological advancements to improve fuel efficiency and reduce emissions, thereby enhancing their product offerings. While the market faces headwinds from stricter environmental regulations and rising renewable energy penetration, the persistent need for reliable backup power in regions with underdeveloped grids and the growth of various industrial and infrastructural projects are expected to ensure consistent, albeit possibly slower, growth over the forecast period. The market's geographic spread reflects considerable variation, with countries such as the UAE and Saudi Arabia likely driving a significant portion of the overall growth, based on their large-scale infrastructure development and higher per capita energy consumption.
MEA Diesel Genset Industry Market Report: 2019-2033
This comprehensive report provides a detailed analysis of the Middle East and Africa (MEA) diesel genset industry, covering market size, growth drivers, challenges, key players, and future outlook. The study period spans from 2019 to 2033, with 2025 as the base and estimated year. This report is crucial for industry stakeholders, investors, and businesses seeking to understand the dynamics and opportunities within this evolving market.
MEA Diesel Genset Industry Market Concentration & Innovation
The MEA diesel genset market exhibits moderate concentration, with several key players holding significant market share. Perkins Engines Company Limited, Caterpillar Inc., Cummins Inc., and Kirloskar Oil Engines Limited are among the dominant players, collectively accounting for approximately 64% of the market share in 2025 (estimated). However, several smaller regional players and new entrants are actively competing, creating a dynamic competitive landscape.
Innovation in the MEA diesel genset market is driven by increasing demand for fuel-efficient, environmentally friendly, and technologically advanced gensets. Regulations promoting cleaner energy sources are pressuring manufacturers to develop quieter and more emission-compliant models. The adoption of advanced technologies such as digital controls, remote monitoring, and predictive maintenance is also gaining traction.
Mergers and acquisitions (M&A) activity has been relatively low in recent years, with deal values remaining below xx Million USD annually in the historical period. However, increasing competition and the need for technological advancements may lead to increased M&A activity in the forecast period (2025-2033).
- Market Concentration: High (estimated 64% market share for top players in 2025).
- Innovation Drivers: Environmental regulations, fuel efficiency demands, technological advancements.
- M&A Activity: Low in recent years, potential for increase in forecast period.
- Product Substitutes: Solar and wind power are emerging substitutes, but diesel gensets still dominate in reliability and off-grid situations.
- End-User Trends: Increasing demand from various sectors including industrial, commercial, and residential, with growing focus on reliability and efficiency.
MEA Diesel Genset Industry Industry Trends & Insights
The MEA diesel genset market is projected to experience a Compound Annual Growth Rate (CAGR) of xx% during the forecast period (2025-2033). Key growth drivers include robust infrastructure development, rising urbanization, increasing industrialization, and expanding energy demands across various sectors. However, the market faces challenges from government initiatives promoting renewable energy sources and increasing competition from alternative power generation technologies. Market penetration of diesel gensets remains high in areas with unreliable grid infrastructure, particularly in rural and remote areas. Consumer preference is shifting towards technologically advanced, efficient, and environment-friendly models.
The market is witnessing technological disruptions with the introduction of quieter, more efficient gensets and enhanced digital capabilities. These advancements aim to enhance operational efficiency and lower environmental impact. However, adoption remains influenced by initial capital investment costs. Competitive dynamics are characterized by price competition, technological innovation, and branding. Large global players dominate the market, but local players are becoming more competitive, especially in specific regions or segments. The market is also influenced by governmental policies promoting renewable energy sources. The CAGR for the forecast period is expected to be impacted by the penetration rate of alternative power sources.
Dominant Markets & Segments in MEA Diesel Genset Industry
The MEA region presents diverse opportunities across various countries and segments. While specific country dominance requires a deeper analysis within the full report, several areas exhibit strong growth. The prime power segment consistently dominates, driven by reliable and uninterrupted power needs in industrial and commercial applications. The segment of 75-375 kVA dominates in market share due to the balanced need for power capacity and cost-effectiveness in commercial and small industrial use cases.
- Dominant Region/Country: [Specific country/region will be identified in the full report - requires additional data analysis]
- Dominant Application: Prime Power
- Dominant Rating: 75-375 kVA
- Key Drivers: Infrastructure development, industrial growth, urbanization, unreliable grid infrastructure in some regions.
MEA Diesel Genset Industry Product Developments
Recent product innovations focus on enhancing efficiency, reducing emissions, and improving noise levels. Manufacturers are incorporating advanced technologies like electronic fuel injection, turbocharging, and exhaust gas recirculation systems. These developments improve fuel economy, reduce emissions, and comply with stringent environmental regulations. The integration of smart functionalities, remote diagnostics, and predictive maintenance capabilities enhances operational efficiency and reduces downtime. These developments create competitive advantages by offering enhanced performance, reliability, and reduced operational costs.
Report Scope & Segmentation Analysis
This report comprehensively segments the MEA diesel genset market based on application (Prime Power, Backup Power, Peak Shaving) and rating (0-75 kVA, 75-375 kVA, Above 375 kVA). Each segment's growth projections, market size, and competitive dynamics are analyzed. For instance, the Prime Power segment is characterized by high market share and steady growth, while the Backup Power segment experiences moderate growth driven by increased demand for power backup solutions. The 75-375 kVA segment dominates the rating-based segmentation. Detailed analysis of each segment's growth drivers and challenges are provided within the full report.
Key Drivers of MEA Diesel Genset Industry Growth
Several key factors propel the growth of the MEA diesel genset industry. These include the continuous expansion of industrial and commercial sectors, requiring robust power solutions. Rapid urbanization and population growth further increase energy demands, driving the need for reliable power generation. Furthermore, inadequate electricity grid infrastructure in many regions, especially in rural areas, necessitates the use of diesel gensets. Government infrastructure projects also fuel increased demand.
Challenges in the MEA Diesel Genset Industry Sector
Despite significant growth potential, the MEA diesel genset market faces challenges. Stringent emission regulations necessitate the adoption of cleaner technologies, increasing production costs. Fluctuating fuel prices create uncertainty in operating costs. The rising popularity of renewable energy sources presents significant competition. Supply chain disruptions, particularly in securing key components, can impact production and delivery timelines. These factors pose significant challenges to market growth and profitability.
Emerging Opportunities in MEA Diesel Genset Industry
The MEA diesel genset industry presents significant growth opportunities. The increasing focus on hybrid power systems, integrating diesel gensets with renewable energy sources, offers a promising avenue. The growing adoption of smart grid technologies enables optimized energy management and reduces reliance on traditional diesel generators. Expanding into remote and underserved areas with limited grid access presents lucrative market opportunities.
Leading Players in the MEA Diesel Genset Industry Market
- Perkins Engines Company Limited
- Atlas Copco AB
- Caterpillar Inc
- Kirloskar Oil Engines Limited
- Honda Siel Power Products Limited
- Cummins Inc
- Yanmar Holdings Co Ltd
- Mitsubishi Heavy Industries Ltd
- Kohler Co.
- MTU Onsite Energy (a Rolls-Royce Power Systems company)
Key Developments in MEA Diesel Genset Industry Industry
- Dec 2023: Nigeria received a USD 750 Million loan from the World Bank for the DARES project, aiming to improve electricity access and potentially reduce reliance on diesel generators. This development could negatively impact the long-term growth of the diesel genset market in Nigeria.
- Aug 2023: Guangxi Dingbo Power Equipment Manufacturing Co. Ltd. secured a diesel generator order from Iran, highlighting continued demand in specific markets. This indicates sustained market interest despite global shifts toward renewable energy.
Strategic Outlook for MEA Diesel Genset Industry Market
The MEA diesel genset market is poised for continued growth, driven by infrastructure development, industrial expansion, and persistent grid unreliability in certain regions. However, long-term growth will be influenced by government policies promoting renewable energy, and manufacturers must adapt by offering energy-efficient and environmentally friendly solutions. The market presents opportunities for players focusing on hybrid systems and innovative technological advancements. The focus on sustainable and cost-effective solutions will be key to navigating the evolving market landscape.
MEA Diesel Genset Industry Segmentation
-
1. Ratings
- 1.1. 0-75 kVA
- 1.2. 75-375 kVA
- 1.3. Above 375 kVA
-
2. Application
- 2.1. Prime Power
- 2.2. Backup Power
- 2.3. Peak Shaving
MEA Diesel Genset Industry Segmentation By Geography
- 1. Nigeria
- 2. Iraq
- 3. Saudi Arabia
- 4. United Arab Emirates
- 5. Qatar
- 6. Rest of Middle East and Africa
MEA Diesel Genset Industry REPORT HIGHLIGHTS
| Aspects | Details |
|---|---|
| Study Period | 2019-2033 |
| Base Year | 2024 |
| Estimated Year | 2025 |
| Forecast Period | 2025-2033 |
| Historical Period | 2019-2024 |
| Growth Rate | CAGR of > 4.10% from 2019-2033 |
| Segmentation |
|
Table of Contents
- 1. Introduction
- 1.1. Research Scope
- 1.2. Market Segmentation
- 1.3. Research Methodology
- 1.4. Definitions and Assumptions
- 2. Executive Summary
- 2.1. Introduction
- 3. Market Dynamics
- 3.1. Introduction
- 3.2. Market Drivers
- 3.2.1. 4.; Unreliable Power Supply4.; Construction and Infrastructure Projects
- 3.3. Market Restrains
- 3.3.1. 4.; Environmental Concerns
- 3.4. Market Trends
- 3.4.1. Backup Generator Segment to Dominate the Market
- 4. Market Factor Analysis
- 4.1. Porters Five Forces
- 4.2. Supply/Value Chain
- 4.3. PESTEL analysis
- 4.4. Market Entropy
- 4.5. Patent/Trademark Analysis
- 5. Global MEA Diesel Genset Industry Analysis, Insights and Forecast, 2019-2031
- 5.1. Market Analysis, Insights and Forecast - by Ratings
- 5.1.1. 0-75 kVA
- 5.1.2. 75-375 kVA
- 5.1.3. Above 375 kVA
- 5.2. Market Analysis, Insights and Forecast - by Application
- 5.2.1. Prime Power
- 5.2.2. Backup Power
- 5.2.3. Peak Shaving
- 5.3. Market Analysis, Insights and Forecast - by Region
- 5.3.1. Nigeria
- 5.3.2. Iraq
- 5.3.3. Saudi Arabia
- 5.3.4. United Arab Emirates
- 5.3.5. Qatar
- 5.3.6. Rest of Middle East and Africa
- 5.1. Market Analysis, Insights and Forecast - by Ratings
- 6. Nigeria MEA Diesel Genset Industry Analysis, Insights and Forecast, 2019-2031
- 6.1. Market Analysis, Insights and Forecast - by Ratings
- 6.1.1. 0-75 kVA
- 6.1.2. 75-375 kVA
- 6.1.3. Above 375 kVA
- 6.2. Market Analysis, Insights and Forecast - by Application
- 6.2.1. Prime Power
- 6.2.2. Backup Power
- 6.2.3. Peak Shaving
- 6.1. Market Analysis, Insights and Forecast - by Ratings
- 7. Iraq MEA Diesel Genset Industry Analysis, Insights and Forecast, 2019-2031
- 7.1. Market Analysis, Insights and Forecast - by Ratings
- 7.1.1. 0-75 kVA
- 7.1.2. 75-375 kVA
- 7.1.3. Above 375 kVA
- 7.2. Market Analysis, Insights and Forecast - by Application
- 7.2.1. Prime Power
- 7.2.2. Backup Power
- 7.2.3. Peak Shaving
- 7.1. Market Analysis, Insights and Forecast - by Ratings
- 8. Saudi Arabia MEA Diesel Genset Industry Analysis, Insights and Forecast, 2019-2031
- 8.1. Market Analysis, Insights and Forecast - by Ratings
- 8.1.1. 0-75 kVA
- 8.1.2. 75-375 kVA
- 8.1.3. Above 375 kVA
- 8.2. Market Analysis, Insights and Forecast - by Application
- 8.2.1. Prime Power
- 8.2.2. Backup Power
- 8.2.3. Peak Shaving
- 8.1. Market Analysis, Insights and Forecast - by Ratings
- 9. United Arab Emirates MEA Diesel Genset Industry Analysis, Insights and Forecast, 2019-2031
- 9.1. Market Analysis, Insights and Forecast - by Ratings
- 9.1.1. 0-75 kVA
- 9.1.2. 75-375 kVA
- 9.1.3. Above 375 kVA
- 9.2. Market Analysis, Insights and Forecast - by Application
- 9.2.1. Prime Power
- 9.2.2. Backup Power
- 9.2.3. Peak Shaving
- 9.1. Market Analysis, Insights and Forecast - by Ratings
- 10. Qatar MEA Diesel Genset Industry Analysis, Insights and Forecast, 2019-2031
- 10.1. Market Analysis, Insights and Forecast - by Ratings
- 10.1.1. 0-75 kVA
- 10.1.2. 75-375 kVA
- 10.1.3. Above 375 kVA
- 10.2. Market Analysis, Insights and Forecast - by Application
- 10.2.1. Prime Power
- 10.2.2. Backup Power
- 10.2.3. Peak Shaving
- 10.1. Market Analysis, Insights and Forecast - by Ratings
- 11. Rest of Middle East and Africa MEA Diesel Genset Industry Analysis, Insights and Forecast, 2019-2031
- 11.1. Market Analysis, Insights and Forecast - by Ratings
- 11.1.1. 0-75 kVA
- 11.1.2. 75-375 kVA
- 11.1.3. Above 375 kVA
- 11.2. Market Analysis, Insights and Forecast - by Application
- 11.2.1. Prime Power
- 11.2.2. Backup Power
- 11.2.3. Peak Shaving
- 11.1. Market Analysis, Insights and Forecast - by Ratings
- 12. North America MEA Diesel Genset Industry Analysis, Insights and Forecast, 2019-2031
- 12.1. Market Analysis, Insights and Forecast - By Country/Sub-region
- 12.1.1 United States
- 12.1.2 Canada
- 12.1.3 Mexico
- 13. Europe MEA Diesel Genset Industry Analysis, Insights and Forecast, 2019-2031
- 13.1. Market Analysis, Insights and Forecast - By Country/Sub-region
- 13.1.1 Germany
- 13.1.2 United Kingdom
- 13.1.3 France
- 13.1.4 Spain
- 13.1.5 Italy
- 13.1.6 Spain
- 13.1.7 Belgium
- 13.1.8 Netherland
- 13.1.9 Nordics
- 13.1.10 Rest of Europe
- 14. Asia Pacific MEA Diesel Genset Industry Analysis, Insights and Forecast, 2019-2031
- 14.1. Market Analysis, Insights and Forecast - By Country/Sub-region
- 14.1.1 China
- 14.1.2 Japan
- 14.1.3 India
- 14.1.4 South Korea
- 14.1.5 Southeast Asia
- 14.1.6 Australia
- 14.1.7 Indonesia
- 14.1.8 Phillipes
- 14.1.9 Singapore
- 14.1.10 Thailandc
- 14.1.11 Rest of Asia Pacific
- 15. South America MEA Diesel Genset Industry Analysis, Insights and Forecast, 2019-2031
- 15.1. Market Analysis, Insights and Forecast - By Country/Sub-region
- 15.1.1 Brazil
- 15.1.2 Argentina
- 15.1.3 Peru
- 15.1.4 Chile
- 15.1.5 Colombia
- 15.1.6 Ecuador
- 15.1.7 Venezuela
- 15.1.8 Rest of South America
- 16. North America MEA Diesel Genset Industry Analysis, Insights and Forecast, 2019-2031
- 16.1. Market Analysis, Insights and Forecast - By Country/Sub-region
- 16.1.1 United States
- 16.1.2 Canada
- 16.1.3 Mexico
- 17. MEA MEA Diesel Genset Industry Analysis, Insights and Forecast, 2019-2031
- 17.1. Market Analysis, Insights and Forecast - By Country/Sub-region
- 17.1.1 United Arab Emirates
- 17.1.2 Saudi Arabia
- 17.1.3 South Africa
- 17.1.4 Rest of Middle East and Africa
- 18. Competitive Analysis
- 18.1. Global Market Share Analysis 2024
- 18.2. Company Profiles
- 18.2.1 Perkins Engines Company Limited
- 18.2.1.1. Overview
- 18.2.1.2. Products
- 18.2.1.3. SWOT Analysis
- 18.2.1.4. Recent Developments
- 18.2.1.5. Financials (Based on Availability)
- 18.2.2 Atlas Copco AB*List Not Exhaustive 6 4 Market Shar
- 18.2.2.1. Overview
- 18.2.2.2. Products
- 18.2.2.3. SWOT Analysis
- 18.2.2.4. Recent Developments
- 18.2.2.5. Financials (Based on Availability)
- 18.2.3 Caterpillar Inc
- 18.2.3.1. Overview
- 18.2.3.2. Products
- 18.2.3.3. SWOT Analysis
- 18.2.3.4. Recent Developments
- 18.2.3.5. Financials (Based on Availability)
- 18.2.4 Kirloskar Oil Engines Limited
- 18.2.4.1. Overview
- 18.2.4.2. Products
- 18.2.4.3. SWOT Analysis
- 18.2.4.4. Recent Developments
- 18.2.4.5. Financials (Based on Availability)
- 18.2.5 Honda Siel Power Products Limited
- 18.2.5.1. Overview
- 18.2.5.2. Products
- 18.2.5.3. SWOT Analysis
- 18.2.5.4. Recent Developments
- 18.2.5.5. Financials (Based on Availability)
- 18.2.6 Cummins Inc
- 18.2.6.1. Overview
- 18.2.6.2. Products
- 18.2.6.3. SWOT Analysis
- 18.2.6.4. Recent Developments
- 18.2.6.5. Financials (Based on Availability)
- 18.2.7 Yanmar Holdings Co Ltd
- 18.2.7.1. Overview
- 18.2.7.2. Products
- 18.2.7.3. SWOT Analysis
- 18.2.7.4. Recent Developments
- 18.2.7.5. Financials (Based on Availability)
- 18.2.8 Mitsubishi Heavy Industries Ltd
- 18.2.8.1. Overview
- 18.2.8.2. Products
- 18.2.8.3. SWOT Analysis
- 18.2.8.4. Recent Developments
- 18.2.8.5. Financials (Based on Availability)
- 18.2.9 Kohler Co.
- 18.2.9.1. Overview
- 18.2.9.2. Products
- 18.2.9.3. SWOT Analysis
- 18.2.9.4. Recent Developments
- 18.2.9.5. Financials (Based on Availability)
- 18.2.10 MTU Onsite Energy (a Rolls-Royce Power Systems company)
- 18.2.10.1. Overview
- 18.2.10.2. Products
- 18.2.10.3. SWOT Analysis
- 18.2.10.4. Recent Developments
- 18.2.10.5. Financials (Based on Availability)
- 18.2.1 Perkins Engines Company Limited
List of Figures
- Figure 1: Global MEA Diesel Genset Industry Revenue Breakdown (Million, %) by Region 2024 & 2032
- Figure 2: Global MEA Diesel Genset Industry Volume Breakdown (Gigawatt, %) by Region 2024 & 2032
- Figure 3: North America MEA Diesel Genset Industry Revenue (Million), by Country 2024 & 2032
- Figure 4: North America MEA Diesel Genset Industry Volume (Gigawatt), by Country 2024 & 2032
- Figure 5: North America MEA Diesel Genset Industry Revenue Share (%), by Country 2024 & 2032
- Figure 6: North America MEA Diesel Genset Industry Volume Share (%), by Country 2024 & 2032
- Figure 7: Europe MEA Diesel Genset Industry Revenue (Million), by Country 2024 & 2032
- Figure 8: Europe MEA Diesel Genset Industry Volume (Gigawatt), by Country 2024 & 2032
- Figure 9: Europe MEA Diesel Genset Industry Revenue Share (%), by Country 2024 & 2032
- Figure 10: Europe MEA Diesel Genset Industry Volume Share (%), by Country 2024 & 2032
- Figure 11: Asia Pacific MEA Diesel Genset Industry Revenue (Million), by Country 2024 & 2032
- Figure 12: Asia Pacific MEA Diesel Genset Industry Volume (Gigawatt), by Country 2024 & 2032
- Figure 13: Asia Pacific MEA Diesel Genset Industry Revenue Share (%), by Country 2024 & 2032
- Figure 14: Asia Pacific MEA Diesel Genset Industry Volume Share (%), by Country 2024 & 2032
- Figure 15: South America MEA Diesel Genset Industry Revenue (Million), by Country 2024 & 2032
- Figure 16: South America MEA Diesel Genset Industry Volume (Gigawatt), by Country 2024 & 2032
- Figure 17: South America MEA Diesel Genset Industry Revenue Share (%), by Country 2024 & 2032
- Figure 18: South America MEA Diesel Genset Industry Volume Share (%), by Country 2024 & 2032
- Figure 19: North America MEA Diesel Genset Industry Revenue (Million), by Country 2024 & 2032
- Figure 20: North America MEA Diesel Genset Industry Volume (Gigawatt), by Country 2024 & 2032
- Figure 21: North America MEA Diesel Genset Industry Revenue Share (%), by Country 2024 & 2032
- Figure 22: North America MEA Diesel Genset Industry Volume Share (%), by Country 2024 & 2032
- Figure 23: MEA MEA Diesel Genset Industry Revenue (Million), by Country 2024 & 2032
- Figure 24: MEA MEA Diesel Genset Industry Volume (Gigawatt), by Country 2024 & 2032
- Figure 25: MEA MEA Diesel Genset Industry Revenue Share (%), by Country 2024 & 2032
- Figure 26: MEA MEA Diesel Genset Industry Volume Share (%), by Country 2024 & 2032
- Figure 27: Nigeria MEA Diesel Genset Industry Revenue (Million), by Ratings 2024 & 2032
- Figure 28: Nigeria MEA Diesel Genset Industry Volume (Gigawatt), by Ratings 2024 & 2032
- Figure 29: Nigeria MEA Diesel Genset Industry Revenue Share (%), by Ratings 2024 & 2032
- Figure 30: Nigeria MEA Diesel Genset Industry Volume Share (%), by Ratings 2024 & 2032
- Figure 31: Nigeria MEA Diesel Genset Industry Revenue (Million), by Application 2024 & 2032
- Figure 32: Nigeria MEA Diesel Genset Industry Volume (Gigawatt), by Application 2024 & 2032
- Figure 33: Nigeria MEA Diesel Genset Industry Revenue Share (%), by Application 2024 & 2032
- Figure 34: Nigeria MEA Diesel Genset Industry Volume Share (%), by Application 2024 & 2032
- Figure 35: Nigeria MEA Diesel Genset Industry Revenue (Million), by Country 2024 & 2032
- Figure 36: Nigeria MEA Diesel Genset Industry Volume (Gigawatt), by Country 2024 & 2032
- Figure 37: Nigeria MEA Diesel Genset Industry Revenue Share (%), by Country 2024 & 2032
- Figure 38: Nigeria MEA Diesel Genset Industry Volume Share (%), by Country 2024 & 2032
- Figure 39: Iraq MEA Diesel Genset Industry Revenue (Million), by Ratings 2024 & 2032
- Figure 40: Iraq MEA Diesel Genset Industry Volume (Gigawatt), by Ratings 2024 & 2032
- Figure 41: Iraq MEA Diesel Genset Industry Revenue Share (%), by Ratings 2024 & 2032
- Figure 42: Iraq MEA Diesel Genset Industry Volume Share (%), by Ratings 2024 & 2032
- Figure 43: Iraq MEA Diesel Genset Industry Revenue (Million), by Application 2024 & 2032
- Figure 44: Iraq MEA Diesel Genset Industry Volume (Gigawatt), by Application 2024 & 2032
- Figure 45: Iraq MEA Diesel Genset Industry Revenue Share (%), by Application 2024 & 2032
- Figure 46: Iraq MEA Diesel Genset Industry Volume Share (%), by Application 2024 & 2032
- Figure 47: Iraq MEA Diesel Genset Industry Revenue (Million), by Country 2024 & 2032
- Figure 48: Iraq MEA Diesel Genset Industry Volume (Gigawatt), by Country 2024 & 2032
- Figure 49: Iraq MEA Diesel Genset Industry Revenue Share (%), by Country 2024 & 2032
- Figure 50: Iraq MEA Diesel Genset Industry Volume Share (%), by Country 2024 & 2032
- Figure 51: Saudi Arabia MEA Diesel Genset Industry Revenue (Million), by Ratings 2024 & 2032
- Figure 52: Saudi Arabia MEA Diesel Genset Industry Volume (Gigawatt), by Ratings 2024 & 2032
- Figure 53: Saudi Arabia MEA Diesel Genset Industry Revenue Share (%), by Ratings 2024 & 2032
- Figure 54: Saudi Arabia MEA Diesel Genset Industry Volume Share (%), by Ratings 2024 & 2032
- Figure 55: Saudi Arabia MEA Diesel Genset Industry Revenue (Million), by Application 2024 & 2032
- Figure 56: Saudi Arabia MEA Diesel Genset Industry Volume (Gigawatt), by Application 2024 & 2032
- Figure 57: Saudi Arabia MEA Diesel Genset Industry Revenue Share (%), by Application 2024 & 2032
- Figure 58: Saudi Arabia MEA Diesel Genset Industry Volume Share (%), by Application 2024 & 2032
- Figure 59: Saudi Arabia MEA Diesel Genset Industry Revenue (Million), by Country 2024 & 2032
- Figure 60: Saudi Arabia MEA Diesel Genset Industry Volume (Gigawatt), by Country 2024 & 2032
- Figure 61: Saudi Arabia MEA Diesel Genset Industry Revenue Share (%), by Country 2024 & 2032
- Figure 62: Saudi Arabia MEA Diesel Genset Industry Volume Share (%), by Country 2024 & 2032
- Figure 63: United Arab Emirates MEA Diesel Genset Industry Revenue (Million), by Ratings 2024 & 2032
- Figure 64: United Arab Emirates MEA Diesel Genset Industry Volume (Gigawatt), by Ratings 2024 & 2032
- Figure 65: United Arab Emirates MEA Diesel Genset Industry Revenue Share (%), by Ratings 2024 & 2032
- Figure 66: United Arab Emirates MEA Diesel Genset Industry Volume Share (%), by Ratings 2024 & 2032
- Figure 67: United Arab Emirates MEA Diesel Genset Industry Revenue (Million), by Application 2024 & 2032
- Figure 68: United Arab Emirates MEA Diesel Genset Industry Volume (Gigawatt), by Application 2024 & 2032
- Figure 69: United Arab Emirates MEA Diesel Genset Industry Revenue Share (%), by Application 2024 & 2032
- Figure 70: United Arab Emirates MEA Diesel Genset Industry Volume Share (%), by Application 2024 & 2032
- Figure 71: United Arab Emirates MEA Diesel Genset Industry Revenue (Million), by Country 2024 & 2032
- Figure 72: United Arab Emirates MEA Diesel Genset Industry Volume (Gigawatt), by Country 2024 & 2032
- Figure 73: United Arab Emirates MEA Diesel Genset Industry Revenue Share (%), by Country 2024 & 2032
- Figure 74: United Arab Emirates MEA Diesel Genset Industry Volume Share (%), by Country 2024 & 2032
- Figure 75: Qatar MEA Diesel Genset Industry Revenue (Million), by Ratings 2024 & 2032
- Figure 76: Qatar MEA Diesel Genset Industry Volume (Gigawatt), by Ratings 2024 & 2032
- Figure 77: Qatar MEA Diesel Genset Industry Revenue Share (%), by Ratings 2024 & 2032
- Figure 78: Qatar MEA Diesel Genset Industry Volume Share (%), by Ratings 2024 & 2032
- Figure 79: Qatar MEA Diesel Genset Industry Revenue (Million), by Application 2024 & 2032
- Figure 80: Qatar MEA Diesel Genset Industry Volume (Gigawatt), by Application 2024 & 2032
- Figure 81: Qatar MEA Diesel Genset Industry Revenue Share (%), by Application 2024 & 2032
- Figure 82: Qatar MEA Diesel Genset Industry Volume Share (%), by Application 2024 & 2032
- Figure 83: Qatar MEA Diesel Genset Industry Revenue (Million), by Country 2024 & 2032
- Figure 84: Qatar MEA Diesel Genset Industry Volume (Gigawatt), by Country 2024 & 2032
- Figure 85: Qatar MEA Diesel Genset Industry Revenue Share (%), by Country 2024 & 2032
- Figure 86: Qatar MEA Diesel Genset Industry Volume Share (%), by Country 2024 & 2032
- Figure 87: Rest of Middle East and Africa MEA Diesel Genset Industry Revenue (Million), by Ratings 2024 & 2032
- Figure 88: Rest of Middle East and Africa MEA Diesel Genset Industry Volume (Gigawatt), by Ratings 2024 & 2032
- Figure 89: Rest of Middle East and Africa MEA Diesel Genset Industry Revenue Share (%), by Ratings 2024 & 2032
- Figure 90: Rest of Middle East and Africa MEA Diesel Genset Industry Volume Share (%), by Ratings 2024 & 2032
- Figure 91: Rest of Middle East and Africa MEA Diesel Genset Industry Revenue (Million), by Application 2024 & 2032
- Figure 92: Rest of Middle East and Africa MEA Diesel Genset Industry Volume (Gigawatt), by Application 2024 & 2032
- Figure 93: Rest of Middle East and Africa MEA Diesel Genset Industry Revenue Share (%), by Application 2024 & 2032
- Figure 94: Rest of Middle East and Africa MEA Diesel Genset Industry Volume Share (%), by Application 2024 & 2032
- Figure 95: Rest of Middle East and Africa MEA Diesel Genset Industry Revenue (Million), by Country 2024 & 2032
- Figure 96: Rest of Middle East and Africa MEA Diesel Genset Industry Volume (Gigawatt), by Country 2024 & 2032
- Figure 97: Rest of Middle East and Africa MEA Diesel Genset Industry Revenue Share (%), by Country 2024 & 2032
- Figure 98: Rest of Middle East and Africa MEA Diesel Genset Industry Volume Share (%), by Country 2024 & 2032
List of Tables
- Table 1: Global MEA Diesel Genset Industry Revenue Million Forecast, by Region 2019 & 2032
- Table 2: Global MEA Diesel Genset Industry Volume Gigawatt Forecast, by Region 2019 & 2032
- Table 3: Global MEA Diesel Genset Industry Revenue Million Forecast, by Ratings 2019 & 2032
- Table 4: Global MEA Diesel Genset Industry Volume Gigawatt Forecast, by Ratings 2019 & 2032
- Table 5: Global MEA Diesel Genset Industry Revenue Million Forecast, by Application 2019 & 2032
- Table 6: Global MEA Diesel Genset Industry Volume Gigawatt Forecast, by Application 2019 & 2032
- Table 7: Global MEA Diesel Genset Industry Revenue Million Forecast, by Region 2019 & 2032
- Table 8: Global MEA Diesel Genset Industry Volume Gigawatt Forecast, by Region 2019 & 2032
- Table 9: Global MEA Diesel Genset Industry Revenue Million Forecast, by Country 2019 & 2032
- Table 10: Global MEA Diesel Genset Industry Volume Gigawatt Forecast, by Country 2019 & 2032
- Table 11: United States MEA Diesel Genset Industry Revenue (Million) Forecast, by Application 2019 & 2032
- Table 12: United States MEA Diesel Genset Industry Volume (Gigawatt) Forecast, by Application 2019 & 2032
- Table 13: Canada MEA Diesel Genset Industry Revenue (Million) Forecast, by Application 2019 & 2032
- Table 14: Canada MEA Diesel Genset Industry Volume (Gigawatt) Forecast, by Application 2019 & 2032
- Table 15: Mexico MEA Diesel Genset Industry Revenue (Million) Forecast, by Application 2019 & 2032
- Table 16: Mexico MEA Diesel Genset Industry Volume (Gigawatt) Forecast, by Application 2019 & 2032
- Table 17: Global MEA Diesel Genset Industry Revenue Million Forecast, by Country 2019 & 2032
- Table 18: Global MEA Diesel Genset Industry Volume Gigawatt Forecast, by Country 2019 & 2032
- Table 19: Germany MEA Diesel Genset Industry Revenue (Million) Forecast, by Application 2019 & 2032
- Table 20: Germany MEA Diesel Genset Industry Volume (Gigawatt) Forecast, by Application 2019 & 2032
- Table 21: United Kingdom MEA Diesel Genset Industry Revenue (Million) Forecast, by Application 2019 & 2032
- Table 22: United Kingdom MEA Diesel Genset Industry Volume (Gigawatt) Forecast, by Application 2019 & 2032
- Table 23: France MEA Diesel Genset Industry Revenue (Million) Forecast, by Application 2019 & 2032
- Table 24: France MEA Diesel Genset Industry Volume (Gigawatt) Forecast, by Application 2019 & 2032
- Table 25: Spain MEA Diesel Genset Industry Revenue (Million) Forecast, by Application 2019 & 2032
- Table 26: Spain MEA Diesel Genset Industry Volume (Gigawatt) Forecast, by Application 2019 & 2032
- Table 27: Italy MEA Diesel Genset Industry Revenue (Million) Forecast, by Application 2019 & 2032
- Table 28: Italy MEA Diesel Genset Industry Volume (Gigawatt) Forecast, by Application 2019 & 2032
- Table 29: Spain MEA Diesel Genset Industry Revenue (Million) Forecast, by Application 2019 & 2032
- Table 30: Spain MEA Diesel Genset Industry Volume (Gigawatt) Forecast, by Application 2019 & 2032
- Table 31: Belgium MEA Diesel Genset Industry Revenue (Million) Forecast, by Application 2019 & 2032
- Table 32: Belgium MEA Diesel Genset Industry Volume (Gigawatt) Forecast, by Application 2019 & 2032
- Table 33: Netherland MEA Diesel Genset Industry Revenue (Million) Forecast, by Application 2019 & 2032
- Table 34: Netherland MEA Diesel Genset Industry Volume (Gigawatt) Forecast, by Application 2019 & 2032
- Table 35: Nordics MEA Diesel Genset Industry Revenue (Million) Forecast, by Application 2019 & 2032
- Table 36: Nordics MEA Diesel Genset Industry Volume (Gigawatt) Forecast, by Application 2019 & 2032
- Table 37: Rest of Europe MEA Diesel Genset Industry Revenue (Million) Forecast, by Application 2019 & 2032
- Table 38: Rest of Europe MEA Diesel Genset Industry Volume (Gigawatt) Forecast, by Application 2019 & 2032
- Table 39: Global MEA Diesel Genset Industry Revenue Million Forecast, by Country 2019 & 2032
- Table 40: Global MEA Diesel Genset Industry Volume Gigawatt Forecast, by Country 2019 & 2032
- Table 41: China MEA Diesel Genset Industry Revenue (Million) Forecast, by Application 2019 & 2032
- Table 42: China MEA Diesel Genset Industry Volume (Gigawatt) Forecast, by Application 2019 & 2032
- Table 43: Japan MEA Diesel Genset Industry Revenue (Million) Forecast, by Application 2019 & 2032
- Table 44: Japan MEA Diesel Genset Industry Volume (Gigawatt) Forecast, by Application 2019 & 2032
- Table 45: India MEA Diesel Genset Industry Revenue (Million) Forecast, by Application 2019 & 2032
- Table 46: India MEA Diesel Genset Industry Volume (Gigawatt) Forecast, by Application 2019 & 2032
- Table 47: South Korea MEA Diesel Genset Industry Revenue (Million) Forecast, by Application 2019 & 2032
- Table 48: South Korea MEA Diesel Genset Industry Volume (Gigawatt) Forecast, by Application 2019 & 2032
- Table 49: Southeast Asia MEA Diesel Genset Industry Revenue (Million) Forecast, by Application 2019 & 2032
- Table 50: Southeast Asia MEA Diesel Genset Industry Volume (Gigawatt) Forecast, by Application 2019 & 2032
- Table 51: Australia MEA Diesel Genset Industry Revenue (Million) Forecast, by Application 2019 & 2032
- Table 52: Australia MEA Diesel Genset Industry Volume (Gigawatt) Forecast, by Application 2019 & 2032
- Table 53: Indonesia MEA Diesel Genset Industry Revenue (Million) Forecast, by Application 2019 & 2032
- Table 54: Indonesia MEA Diesel Genset Industry Volume (Gigawatt) Forecast, by Application 2019 & 2032
- Table 55: Phillipes MEA Diesel Genset Industry Revenue (Million) Forecast, by Application 2019 & 2032
- Table 56: Phillipes MEA Diesel Genset Industry Volume (Gigawatt) Forecast, by Application 2019 & 2032
- Table 57: Singapore MEA Diesel Genset Industry Revenue (Million) Forecast, by Application 2019 & 2032
- Table 58: Singapore MEA Diesel Genset Industry Volume (Gigawatt) Forecast, by Application 2019 & 2032
- Table 59: Thailandc MEA Diesel Genset Industry Revenue (Million) Forecast, by Application 2019 & 2032
- Table 60: Thailandc MEA Diesel Genset Industry Volume (Gigawatt) Forecast, by Application 2019 & 2032
- Table 61: Rest of Asia Pacific MEA Diesel Genset Industry Revenue (Million) Forecast, by Application 2019 & 2032
- Table 62: Rest of Asia Pacific MEA Diesel Genset Industry Volume (Gigawatt) Forecast, by Application 2019 & 2032
- Table 63: Global MEA Diesel Genset Industry Revenue Million Forecast, by Country 2019 & 2032
- Table 64: Global MEA Diesel Genset Industry Volume Gigawatt Forecast, by Country 2019 & 2032
- Table 65: Brazil MEA Diesel Genset Industry Revenue (Million) Forecast, by Application 2019 & 2032
- Table 66: Brazil MEA Diesel Genset Industry Volume (Gigawatt) Forecast, by Application 2019 & 2032
- Table 67: Argentina MEA Diesel Genset Industry Revenue (Million) Forecast, by Application 2019 & 2032
- Table 68: Argentina MEA Diesel Genset Industry Volume (Gigawatt) Forecast, by Application 2019 & 2032
- Table 69: Peru MEA Diesel Genset Industry Revenue (Million) Forecast, by Application 2019 & 2032
- Table 70: Peru MEA Diesel Genset Industry Volume (Gigawatt) Forecast, by Application 2019 & 2032
- Table 71: Chile MEA Diesel Genset Industry Revenue (Million) Forecast, by Application 2019 & 2032
- Table 72: Chile MEA Diesel Genset Industry Volume (Gigawatt) Forecast, by Application 2019 & 2032
- Table 73: Colombia MEA Diesel Genset Industry Revenue (Million) Forecast, by Application 2019 & 2032
- Table 74: Colombia MEA Diesel Genset Industry Volume (Gigawatt) Forecast, by Application 2019 & 2032
- Table 75: Ecuador MEA Diesel Genset Industry Revenue (Million) Forecast, by Application 2019 & 2032
- Table 76: Ecuador MEA Diesel Genset Industry Volume (Gigawatt) Forecast, by Application 2019 & 2032
- Table 77: Venezuela MEA Diesel Genset Industry Revenue (Million) Forecast, by Application 2019 & 2032
- Table 78: Venezuela MEA Diesel Genset Industry Volume (Gigawatt) Forecast, by Application 2019 & 2032
- Table 79: Rest of South America MEA Diesel Genset Industry Revenue (Million) Forecast, by Application 2019 & 2032
- Table 80: Rest of South America MEA Diesel Genset Industry Volume (Gigawatt) Forecast, by Application 2019 & 2032
- Table 81: Global MEA Diesel Genset Industry Revenue Million Forecast, by Country 2019 & 2032
- Table 82: Global MEA Diesel Genset Industry Volume Gigawatt Forecast, by Country 2019 & 2032
- Table 83: United States MEA Diesel Genset Industry Revenue (Million) Forecast, by Application 2019 & 2032
- Table 84: United States MEA Diesel Genset Industry Volume (Gigawatt) Forecast, by Application 2019 & 2032
- Table 85: Canada MEA Diesel Genset Industry Revenue (Million) Forecast, by Application 2019 & 2032
- Table 86: Canada MEA Diesel Genset Industry Volume (Gigawatt) Forecast, by Application 2019 & 2032
- Table 87: Mexico MEA Diesel Genset Industry Revenue (Million) Forecast, by Application 2019 & 2032
- Table 88: Mexico MEA Diesel Genset Industry Volume (Gigawatt) Forecast, by Application 2019 & 2032
- Table 89: Global MEA Diesel Genset Industry Revenue Million Forecast, by Country 2019 & 2032
- Table 90: Global MEA Diesel Genset Industry Volume Gigawatt Forecast, by Country 2019 & 2032
- Table 91: United Arab Emirates MEA Diesel Genset Industry Revenue (Million) Forecast, by Application 2019 & 2032
- Table 92: United Arab Emirates MEA Diesel Genset Industry Volume (Gigawatt) Forecast, by Application 2019 & 2032
- Table 93: Saudi Arabia MEA Diesel Genset Industry Revenue (Million) Forecast, by Application 2019 & 2032
- Table 94: Saudi Arabia MEA Diesel Genset Industry Volume (Gigawatt) Forecast, by Application 2019 & 2032
- Table 95: South Africa MEA Diesel Genset Industry Revenue (Million) Forecast, by Application 2019 & 2032
- Table 96: South Africa MEA Diesel Genset Industry Volume (Gigawatt) Forecast, by Application 2019 & 2032
- Table 97: Rest of Middle East and Africa MEA Diesel Genset Industry Revenue (Million) Forecast, by Application 2019 & 2032
- Table 98: Rest of Middle East and Africa MEA Diesel Genset Industry Volume (Gigawatt) Forecast, by Application 2019 & 2032
- Table 99: Global MEA Diesel Genset Industry Revenue Million Forecast, by Ratings 2019 & 2032
- Table 100: Global MEA Diesel Genset Industry Volume Gigawatt Forecast, by Ratings 2019 & 2032
- Table 101: Global MEA Diesel Genset Industry Revenue Million Forecast, by Application 2019 & 2032
- Table 102: Global MEA Diesel Genset Industry Volume Gigawatt Forecast, by Application 2019 & 2032
- Table 103: Global MEA Diesel Genset Industry Revenue Million Forecast, by Country 2019 & 2032
- Table 104: Global MEA Diesel Genset Industry Volume Gigawatt Forecast, by Country 2019 & 2032
- Table 105: Global MEA Diesel Genset Industry Revenue Million Forecast, by Ratings 2019 & 2032
- Table 106: Global MEA Diesel Genset Industry Volume Gigawatt Forecast, by Ratings 2019 & 2032
- Table 107: Global MEA Diesel Genset Industry Revenue Million Forecast, by Application 2019 & 2032
- Table 108: Global MEA Diesel Genset Industry Volume Gigawatt Forecast, by Application 2019 & 2032
- Table 109: Global MEA Diesel Genset Industry Revenue Million Forecast, by Country 2019 & 2032
- Table 110: Global MEA Diesel Genset Industry Volume Gigawatt Forecast, by Country 2019 & 2032
- Table 111: Global MEA Diesel Genset Industry Revenue Million Forecast, by Ratings 2019 & 2032
- Table 112: Global MEA Diesel Genset Industry Volume Gigawatt Forecast, by Ratings 2019 & 2032
- Table 113: Global MEA Diesel Genset Industry Revenue Million Forecast, by Application 2019 & 2032
- Table 114: Global MEA Diesel Genset Industry Volume Gigawatt Forecast, by Application 2019 & 2032
- Table 115: Global MEA Diesel Genset Industry Revenue Million Forecast, by Country 2019 & 2032
- Table 116: Global MEA Diesel Genset Industry Volume Gigawatt Forecast, by Country 2019 & 2032
- Table 117: Global MEA Diesel Genset Industry Revenue Million Forecast, by Ratings 2019 & 2032
- Table 118: Global MEA Diesel Genset Industry Volume Gigawatt Forecast, by Ratings 2019 & 2032
- Table 119: Global MEA Diesel Genset Industry Revenue Million Forecast, by Application 2019 & 2032
- Table 120: Global MEA Diesel Genset Industry Volume Gigawatt Forecast, by Application 2019 & 2032
- Table 121: Global MEA Diesel Genset Industry Revenue Million Forecast, by Country 2019 & 2032
- Table 122: Global MEA Diesel Genset Industry Volume Gigawatt Forecast, by Country 2019 & 2032
- Table 123: Global MEA Diesel Genset Industry Revenue Million Forecast, by Ratings 2019 & 2032
- Table 124: Global MEA Diesel Genset Industry Volume Gigawatt Forecast, by Ratings 2019 & 2032
- Table 125: Global MEA Diesel Genset Industry Revenue Million Forecast, by Application 2019 & 2032
- Table 126: Global MEA Diesel Genset Industry Volume Gigawatt Forecast, by Application 2019 & 2032
- Table 127: Global MEA Diesel Genset Industry Revenue Million Forecast, by Country 2019 & 2032
- Table 128: Global MEA Diesel Genset Industry Volume Gigawatt Forecast, by Country 2019 & 2032
- Table 129: Global MEA Diesel Genset Industry Revenue Million Forecast, by Ratings 2019 & 2032
- Table 130: Global MEA Diesel Genset Industry Volume Gigawatt Forecast, by Ratings 2019 & 2032
- Table 131: Global MEA Diesel Genset Industry Revenue Million Forecast, by Application 2019 & 2032
- Table 132: Global MEA Diesel Genset Industry Volume Gigawatt Forecast, by Application 2019 & 2032
- Table 133: Global MEA Diesel Genset Industry Revenue Million Forecast, by Country 2019 & 2032
- Table 134: Global MEA Diesel Genset Industry Volume Gigawatt Forecast, by Country 2019 & 2032
Frequently Asked Questions
1. What is the projected Compound Annual Growth Rate (CAGR) of the MEA Diesel Genset Industry?
The projected CAGR is approximately > 4.10%.
2. Which companies are prominent players in the MEA Diesel Genset Industry?
Key companies in the market include Perkins Engines Company Limited, Atlas Copco AB*List Not Exhaustive 6 4 Market Shar, Caterpillar Inc, Kirloskar Oil Engines Limited, Honda Siel Power Products Limited, Cummins Inc, Yanmar Holdings Co Ltd, Mitsubishi Heavy Industries Ltd, Kohler Co. , MTU Onsite Energy (a Rolls-Royce Power Systems company).
3. What are the main segments of the MEA Diesel Genset Industry?
The market segments include Ratings, Application.
4. Can you provide details about the market size?
The market size is estimated to be USD 2.80 Million as of 2022.
5. What are some drivers contributing to market growth?
4.; Unreliable Power Supply4.; Construction and Infrastructure Projects.
6. What are the notable trends driving market growth?
Backup Generator Segment to Dominate the Market.
7. Are there any restraints impacting market growth?
4.; Environmental Concerns.
8. Can you provide examples of recent developments in the market?
Dec 2023: Nigeria received a USD 750 million loan from the World Bank for the DARES project. The DARES project aims to provide around 17.5 million Nigerians with access to electricity and eliminate noisy and polluting diesel generators with clean energy.
9. What pricing options are available for accessing the report?
Pricing options include single-user, multi-user, and enterprise licenses priced at USD 4750, USD 5250, and USD 8750 respectively.
10. Is the market size provided in terms of value or volume?
The market size is provided in terms of value, measured in Million and volume, measured in Gigawatt.
11. Are there any specific market keywords associated with the report?
Yes, the market keyword associated with the report is "MEA Diesel Genset Industry," which aids in identifying and referencing the specific market segment covered.
12. How do I determine which pricing option suits my needs best?
The pricing options vary based on user requirements and access needs. Individual users may opt for single-user licenses, while businesses requiring broader access may choose multi-user or enterprise licenses for cost-effective access to the report.
13. Are there any additional resources or data provided in the MEA Diesel Genset Industry report?
While the report offers comprehensive insights, it's advisable to review the specific contents or supplementary materials provided to ascertain if additional resources or data are available.
14. How can I stay updated on further developments or reports in the MEA Diesel Genset Industry?
To stay informed about further developments, trends, and reports in the MEA Diesel Genset Industry, consider subscribing to industry newsletters, following relevant companies and organizations, or regularly checking reputable industry news sources and publications.
Methodology
Step 1 - Identification of Relevant Samples Size from Population Database


Step 2 - Approaches for Defining Global Market Size (Value, Volume* & Price*)

Note*: In applicable scenarios
Step 3 - Data Sources
Primary Research
- Web Analytics
- Survey Reports
- Research Institute
- Latest Research Reports
- Opinion Leaders
Secondary Research
- Annual Reports
- White Paper
- Latest Press Release
- Industry Association
- Paid Database
- Investor Presentations

Step 4 - Data Triangulation
Involves using different sources of information in order to increase the validity of a study
These sources are likely to be stakeholders in a program - participants, other researchers, program staff, other community members, and so on.
Then we put all data in single framework & apply various statistical tools to find out the dynamic on the market.
During the analysis stage, feedback from the stakeholder groups would be compared to determine areas of agreement as well as areas of divergence


