
Key Insights
The Middle East and Africa (MEA) jet fuel market is experiencing robust growth, driven by a surge in air travel, particularly in rapidly developing economies within the region. The expanding aviation sector, fueled by tourism, business travel, and the increasing affordability of airfare, is a primary catalyst for this expansion. Furthermore, the substantial investments in airport infrastructure and the emergence of new low-cost carriers are significantly contributing to the market's upward trajectory. While the global aviation industry faced significant headwinds during the COVID-19 pandemic, the MEA region is demonstrating a strong recovery, indicating a promising outlook for jet fuel demand in the coming years. The rising adoption of more fuel-efficient aircraft technologies will partially offset the growth in demand, however, the overall expansion of the aviation sector in the region suggests continued market expansion. Key players in the MEA region, such as Emirates National Oil Company and Abu Dhabi National Oil Company, are strategically positioning themselves to capitalize on this growth by investing in infrastructure and supply chain optimization. Competition in the MEA jet fuel market is intense, with both international and regional players vying for market share. This competitive landscape fosters innovation and drives down prices, ultimately benefiting airlines and promoting further growth in the sector. The shift toward sustainable aviation fuels (SAF) is also a developing trend, although its current impact on the market share remains relatively limited. Government regulations and policies promoting sustainable practices will likely play a significant role in shaping the future composition of the jet fuel market within the MEA region.
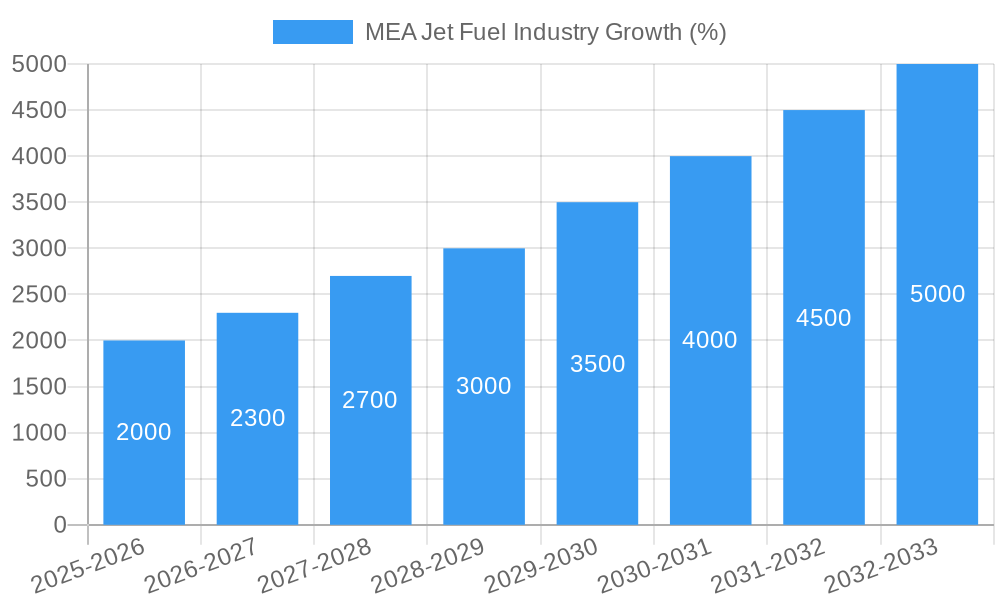
The forecast for the MEA jet fuel market over the next decade is exceptionally positive, anticipating a continued high CAGR. This optimistic outlook is reinforced by the projected expansion of airline fleets, increased passenger numbers, and sustained economic growth in several MEA countries. However, geopolitical instability and potential fuel price volatility pose significant challenges to the market's consistent growth trajectory. Furthermore, the market's vulnerability to global economic downturns and fluctuations in crude oil prices necessitates a cautious approach to long-term projections. Nevertheless, the inherent growth drivers within the MEA aviation sector are powerful enough to suggest that this market will continue its upward trend, presenting compelling opportunities for investors and industry players. Detailed market segmentation analysis, considering various fuel types like ATF and AVGAS, is crucial for a comprehensive understanding of the competitive dynamics and regional variations within the MEA jet fuel industry.
This in-depth report provides a comprehensive analysis of the Middle East and Africa (MEA) jet fuel industry, offering invaluable insights for industry stakeholders, investors, and strategic decision-makers. The report covers the period from 2019 to 2033, with a focus on the forecast period (2025-2033), utilizing 2025 as the base and estimated year. We analyze market dynamics, competitive landscapes, technological advancements, and growth opportunities within this crucial energy sector. Our analysis incorporates key data points and projections, providing actionable intelligence for informed business strategies. The report covers a market valued at XX Million in 2024 and projects a value of XX Million by 2033.
MEA Jet Fuel Industry Market Concentration & Innovation
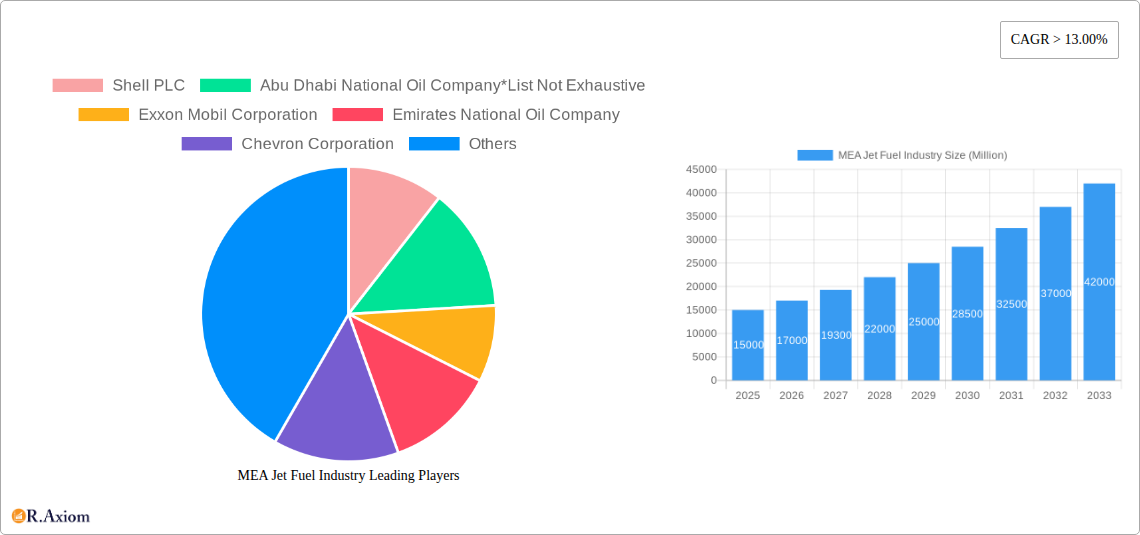
This section analyzes the MEA jet fuel market's concentration, examining the market share held by key players such as Shell PLC, Shell PLC, Abu Dhabi National Oil Company, Exxon Mobil Corporation, Exxon Mobil Corporation, Emirates National Oil Company, Chevron Corporation, Chevron Corporation, TotalEnergies SE, TotalEnergies SE, BP PLC, BP PLC, and Repsol SA. The report further investigates the drivers of innovation, regulatory landscapes, the impact of substitute products, evolving end-user trends, and significant M&A activities within the industry. We delve into the market share distribution, identifying dominant players and analyzing their strategic moves. Data on M&A deal values (totaling approximately XX Million in the historical period) and their influence on market consolidation will be presented. The analysis will also include a detailed assessment of regulatory frameworks and their impact on market growth. The report assesses the potential for substitution, focusing on sustainable alternatives, and explores emerging end-user trends, such as the increasing demand for SAF.
- Market Share Analysis: Detailed breakdown of market share by key players (Shell, ADNOC, ExxonMobil, etc.).
- M&A Activity: Analysis of recent mergers and acquisitions, including deal values and their impact on market concentration.
- Innovation Drivers: Discussion of technological advancements (e.g., SAF production) and their effect on the industry.
- Regulatory Landscape: Assessment of relevant regulations and their influence on market dynamics.
- Substitute Products: Evaluation of the impact of alternative fuels (e.g., biofuels) on the market.
MEA Jet Fuel Industry Industry Trends & Insights
This section offers a comprehensive overview of the MEA jet fuel market's trends and insights. We examine the growth drivers, technological disruptions, consumer preferences, and competitive dynamics that shape the industry. The report will detail the Compound Annual Growth Rate (CAGR) for the forecast period and provide analysis of market penetration rates for different fuel types. Specific factors influencing the market's trajectory will be highlighted, including the impact of geopolitical events, fluctuating oil prices, and the growing adoption of sustainable aviation fuel. We will assess the market's response to technological advancements and their implications for both producers and consumers. The analysis will also include the examination of various market factors, such as macroeconomic trends and consumer behavior, to deliver a complete market overview.
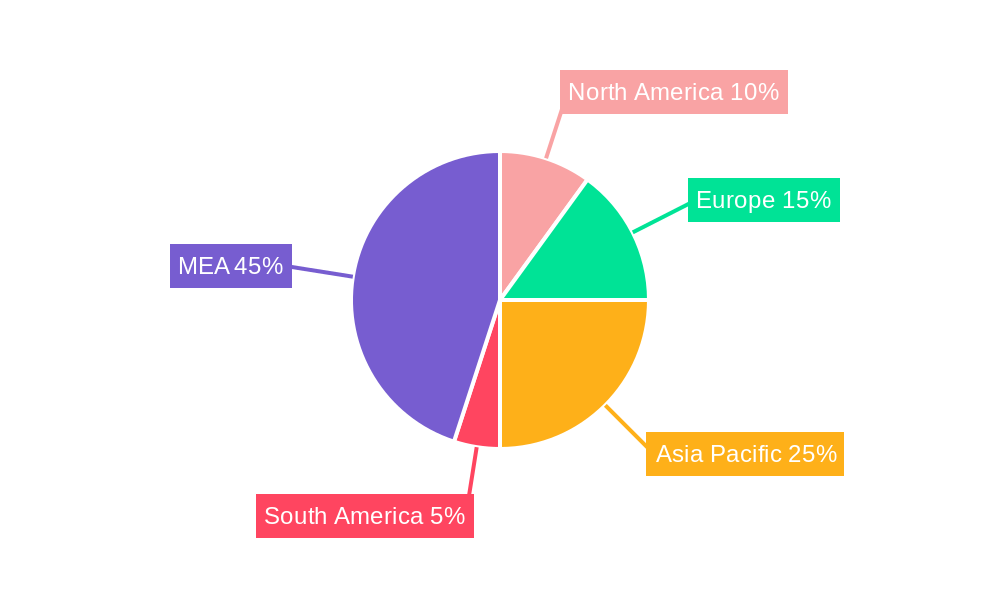
Dominant Markets & Segments in MEA Jet Fuel Industry
This section identifies the leading regions, countries, and segments within the MEA jet fuel market. We analyze the dominance of specific application segments (Commercial, Defense, General Aviation) and fuel types (ATF, Aviation Biofuel, AVGAS). Key growth drivers for each dominant segment will be outlined using bullet points, encompassing economic policies, infrastructural developments, and other relevant factors. A detailed analysis will be provided for each segment, including a thorough examination of the factors contributing to their market leadership.
- Dominant Region: [Region Name] - Reasons for dominance (e.g., high air traffic, robust aviation sector).
- Dominant Country: [Country Name] - Factors contributing to its leading position (e.g., strong economic growth, strategic location).
- Dominant Application Segment: [Segment Name] - Analysis of its market share and growth drivers.
- Dominant Fuel Type: [Fuel Type] - Reasons behind its market leadership (e.g., cost-effectiveness, availability).
MEA Jet Fuel Industry Product Developments
This section summarizes the latest product innovations, their applications, and competitive advantages. We highlight technological trends and market fit, focusing on the ongoing developments in sustainable aviation fuel (SAF) and other advancements aimed at improving fuel efficiency and reducing environmental impact. The section will also evaluate the market acceptance of new products and assess their potential to disrupt the existing market dynamics.
Report Scope & Segmentation Analysis
This section details the market segmentation by application (Commercial, Defense, General Aviation) and fuel type (ATF, Aviation Biofuel, AVGAS). For each segment, we provide growth projections, market sizes, and a competitive landscape overview. Specific data will be presented for the projected market size of each segment in 2025 and 2033, along with an analysis of their respective growth trajectories and the competitive forces at play within each segment. The growth projections consider several factors, such as market penetration rates and technological advancements.
Key Drivers of MEA Jet Fuel Industry Growth
This section outlines the key factors driving the growth of the MEA jet fuel industry. These include technological advancements (e.g., development of SAF), economic factors (e.g., growth in air travel), and favorable regulatory environments that stimulate industry expansion. Specific examples of each driver will be cited, illustrating their direct contribution to industry growth. We will elaborate on how these factors influence market expansion and the projected growth trends.
Challenges in the MEA Jet Fuel Industry Sector
This section discusses the challenges and restraints hindering the MEA jet fuel market's growth. We address regulatory hurdles, supply chain disruptions, and intense competition, quantifying their impact on market expansion. Specific examples of these challenges will be detailed, along with their projected impact on market growth during the forecast period. We analyze the influence of these constraints on market trends.
Emerging Opportunities in MEA Jet Fuel Industry
This section highlights emerging opportunities within the MEA jet fuel market. We focus on new markets, technological advancements, and shifting consumer preferences. We assess the potential for market expansion in previously untapped areas and the potential benefits of technological innovations, such as the development and adoption of biofuels.
Leading Players in the MEA Jet Fuel Industry Market
- Shell PLC
- Abu Dhabi National Oil Company
- Exxon Mobil Corporation
- Emirates National Oil Company
- Chevron Corporation
- TotalEnergies SE
- BP PLC
- Repsol SA
Key Developments in MEA Jet Fuel Industry Industry
- January 2022: Masdar, Siemens Energy, and TotalEnergies partnered to produce sustainable aviation fuel (SAF) using green hydrogen. This development signals a significant shift towards sustainable practices within the industry.
- January 2023: AviLease and the Saudi Investment Recycling Company (SIRC) signed a MoU to produce and distribute SAF, further boosting the SAF market. This collaboration highlights the growing interest in sustainable aviation fuels.
Strategic Outlook for MEA Jet Fuel Industry Market
This section summarizes the growth catalysts and provides a strategic outlook for the MEA jet fuel market. We discuss the significant potential for growth, driven by rising air travel demand and the increasing adoption of sustainable aviation fuels. The projection for market growth is based on an analysis of numerous factors, including macroeconomic trends and technological advancements.
MEA Jet Fuel Industry Segmentation
-
1. Fuel Type
- 1.1. Air Turbine Fuel (ATF)
- 1.2. Aviation Biofuel
- 1.3. AVGAS
-
2. Application
- 2.1. Commercial
- 2.2. Defense
- 2.3. General Aviation
-
3. Geography
- 3.1. United Arab Emirates
- 3.2. Saudi Arabia
- 3.3. Qatar
- 3.4. Egypt
- 3.5. South Africa
- 3.6. Rest of Middle-East and Africa
MEA Jet Fuel Industry Segmentation By Geography
- 1. United Arab Emirates
- 2. Saudi Arabia
- 3. Qatar
- 4. Egypt
- 5. South Africa
- 6. Rest of Middle East and Africa
MEA Jet Fuel Industry REPORT HIGHLIGHTS
| Aspects | Details |
|---|---|
| Study Period | 2019-2033 |
| Base Year | 2024 |
| Estimated Year | 2025 |
| Forecast Period | 2025-2033 |
| Historical Period | 2019-2024 |
| Growth Rate | CAGR of > 13.00% from 2019-2033 |
| Segmentation |
|
Table of Contents
- 1. Introduction
- 1.1. Research Scope
- 1.2. Market Segmentation
- 1.3. Research Methodology
- 1.4. Definitions and Assumptions
- 2. Executive Summary
- 2.1. Introduction
- 3. Market Dynamics
- 3.1. Introduction
- 3.2. Market Drivers
- 3.2.1. Increasing Renewables Capacity in Thailand4.; Rising Modernization of Existing Transmission and Distribution Infrastructure
- 3.3. Market Restrains
- 3.3.1. Huge Capital Expenditure Required for Carrying out Modernization of Existing Facilities
- 3.4. Market Trends
- 3.4.1. Commercial Sector to Dominate the Market
- 4. Market Factor Analysis
- 4.1. Porters Five Forces
- 4.2. Supply/Value Chain
- 4.3. PESTEL analysis
- 4.4. Market Entropy
- 4.5. Patent/Trademark Analysis
- 5. Global MEA Jet Fuel Industry Analysis, Insights and Forecast, 2019-2031
- 5.1. Market Analysis, Insights and Forecast - by Fuel Type
- 5.1.1. Air Turbine Fuel (ATF)
- 5.1.2. Aviation Biofuel
- 5.1.3. AVGAS
- 5.2. Market Analysis, Insights and Forecast - by Application
- 5.2.1. Commercial
- 5.2.2. Defense
- 5.2.3. General Aviation
- 5.3. Market Analysis, Insights and Forecast - by Geography
- 5.3.1. United Arab Emirates
- 5.3.2. Saudi Arabia
- 5.3.3. Qatar
- 5.3.4. Egypt
- 5.3.5. South Africa
- 5.3.6. Rest of Middle-East and Africa
- 5.4. Market Analysis, Insights and Forecast - by Region
- 5.4.1. United Arab Emirates
- 5.4.2. Saudi Arabia
- 5.4.3. Qatar
- 5.4.4. Egypt
- 5.4.5. South Africa
- 5.4.6. Rest of Middle East and Africa
- 5.1. Market Analysis, Insights and Forecast - by Fuel Type
- 6. United Arab Emirates MEA Jet Fuel Industry Analysis, Insights and Forecast, 2019-2031
- 6.1. Market Analysis, Insights and Forecast - by Fuel Type
- 6.1.1. Air Turbine Fuel (ATF)
- 6.1.2. Aviation Biofuel
- 6.1.3. AVGAS
- 6.2. Market Analysis, Insights and Forecast - by Application
- 6.2.1. Commercial
- 6.2.2. Defense
- 6.2.3. General Aviation
- 6.3. Market Analysis, Insights and Forecast - by Geography
- 6.3.1. United Arab Emirates
- 6.3.2. Saudi Arabia
- 6.3.3. Qatar
- 6.3.4. Egypt
- 6.3.5. South Africa
- 6.3.6. Rest of Middle-East and Africa
- 6.1. Market Analysis, Insights and Forecast - by Fuel Type
- 7. Saudi Arabia MEA Jet Fuel Industry Analysis, Insights and Forecast, 2019-2031
- 7.1. Market Analysis, Insights and Forecast - by Fuel Type
- 7.1.1. Air Turbine Fuel (ATF)
- 7.1.2. Aviation Biofuel
- 7.1.3. AVGAS
- 7.2. Market Analysis, Insights and Forecast - by Application
- 7.2.1. Commercial
- 7.2.2. Defense
- 7.2.3. General Aviation
- 7.3. Market Analysis, Insights and Forecast - by Geography
- 7.3.1. United Arab Emirates
- 7.3.2. Saudi Arabia
- 7.3.3. Qatar
- 7.3.4. Egypt
- 7.3.5. South Africa
- 7.3.6. Rest of Middle-East and Africa
- 7.1. Market Analysis, Insights and Forecast - by Fuel Type
- 8. Qatar MEA Jet Fuel Industry Analysis, Insights and Forecast, 2019-2031
- 8.1. Market Analysis, Insights and Forecast - by Fuel Type
- 8.1.1. Air Turbine Fuel (ATF)
- 8.1.2. Aviation Biofuel
- 8.1.3. AVGAS
- 8.2. Market Analysis, Insights and Forecast - by Application
- 8.2.1. Commercial
- 8.2.2. Defense
- 8.2.3. General Aviation
- 8.3. Market Analysis, Insights and Forecast - by Geography
- 8.3.1. United Arab Emirates
- 8.3.2. Saudi Arabia
- 8.3.3. Qatar
- 8.3.4. Egypt
- 8.3.5. South Africa
- 8.3.6. Rest of Middle-East and Africa
- 8.1. Market Analysis, Insights and Forecast - by Fuel Type
- 9. Egypt MEA Jet Fuel Industry Analysis, Insights and Forecast, 2019-2031
- 9.1. Market Analysis, Insights and Forecast - by Fuel Type
- 9.1.1. Air Turbine Fuel (ATF)
- 9.1.2. Aviation Biofuel
- 9.1.3. AVGAS
- 9.2. Market Analysis, Insights and Forecast - by Application
- 9.2.1. Commercial
- 9.2.2. Defense
- 9.2.3. General Aviation
- 9.3. Market Analysis, Insights and Forecast - by Geography
- 9.3.1. United Arab Emirates
- 9.3.2. Saudi Arabia
- 9.3.3. Qatar
- 9.3.4. Egypt
- 9.3.5. South Africa
- 9.3.6. Rest of Middle-East and Africa
- 9.1. Market Analysis, Insights and Forecast - by Fuel Type
- 10. South Africa MEA Jet Fuel Industry Analysis, Insights and Forecast, 2019-2031
- 10.1. Market Analysis, Insights and Forecast - by Fuel Type
- 10.1.1. Air Turbine Fuel (ATF)
- 10.1.2. Aviation Biofuel
- 10.1.3. AVGAS
- 10.2. Market Analysis, Insights and Forecast - by Application
- 10.2.1. Commercial
- 10.2.2. Defense
- 10.2.3. General Aviation
- 10.3. Market Analysis, Insights and Forecast - by Geography
- 10.3.1. United Arab Emirates
- 10.3.2. Saudi Arabia
- 10.3.3. Qatar
- 10.3.4. Egypt
- 10.3.5. South Africa
- 10.3.6. Rest of Middle-East and Africa
- 10.1. Market Analysis, Insights and Forecast - by Fuel Type
- 11. Rest of Middle East and Africa MEA Jet Fuel Industry Analysis, Insights and Forecast, 2019-2031
- 11.1. Market Analysis, Insights and Forecast - by Fuel Type
- 11.1.1. Air Turbine Fuel (ATF)
- 11.1.2. Aviation Biofuel
- 11.1.3. AVGAS
- 11.2. Market Analysis, Insights and Forecast - by Application
- 11.2.1. Commercial
- 11.2.2. Defense
- 11.2.3. General Aviation
- 11.3. Market Analysis, Insights and Forecast - by Geography
- 11.3.1. United Arab Emirates
- 11.3.2. Saudi Arabia
- 11.3.3. Qatar
- 11.3.4. Egypt
- 11.3.5. South Africa
- 11.3.6. Rest of Middle-East and Africa
- 11.1. Market Analysis, Insights and Forecast - by Fuel Type
- 12. North America MEA Jet Fuel Industry Analysis, Insights and Forecast, 2019-2031
- 12.1. Market Analysis, Insights and Forecast - By Country/Sub-region
- 12.1.1 United States
- 12.1.2 Canada
- 12.1.3 Mexico
- 13. Europe MEA Jet Fuel Industry Analysis, Insights and Forecast, 2019-2031
- 13.1. Market Analysis, Insights and Forecast - By Country/Sub-region
- 13.1.1 Germany
- 13.1.2 United Kingdom
- 13.1.3 France
- 13.1.4 Spain
- 13.1.5 Italy
- 13.1.6 Spain
- 13.1.7 Belgium
- 13.1.8 Netherland
- 13.1.9 Nordics
- 13.1.10 Rest of Europe
- 14. Asia Pacific MEA Jet Fuel Industry Analysis, Insights and Forecast, 2019-2031
- 14.1. Market Analysis, Insights and Forecast - By Country/Sub-region
- 14.1.1 China
- 14.1.2 Japan
- 14.1.3 India
- 14.1.4 South Korea
- 14.1.5 Southeast Asia
- 14.1.6 Australia
- 14.1.7 Indonesia
- 14.1.8 Phillipes
- 14.1.9 Singapore
- 14.1.10 Thailandc
- 14.1.11 Rest of Asia Pacific
- 15. South America MEA Jet Fuel Industry Analysis, Insights and Forecast, 2019-2031
- 15.1. Market Analysis, Insights and Forecast - By Country/Sub-region
- 15.1.1 Brazil
- 15.1.2 Argentina
- 15.1.3 Peru
- 15.1.4 Chile
- 15.1.5 Colombia
- 15.1.6 Ecuador
- 15.1.7 Venezuela
- 15.1.8 Rest of South America
- 16. North America MEA Jet Fuel Industry Analysis, Insights and Forecast, 2019-2031
- 16.1. Market Analysis, Insights and Forecast - By Country/Sub-region
- 16.1.1 United States
- 16.1.2 Canada
- 16.1.3 Mexico
- 17. MEA MEA Jet Fuel Industry Analysis, Insights and Forecast, 2019-2031
- 17.1. Market Analysis, Insights and Forecast - By Country/Sub-region
- 17.1.1 United Arab Emirates
- 17.1.2 Saudi Arabia
- 17.1.3 South Africa
- 17.1.4 Rest of Middle East and Africa
- 18. Competitive Analysis
- 18.1. Global Market Share Analysis 2024
- 18.2. Company Profiles
- 18.2.1 Shell PLC
- 18.2.1.1. Overview
- 18.2.1.2. Products
- 18.2.1.3. SWOT Analysis
- 18.2.1.4. Recent Developments
- 18.2.1.5. Financials (Based on Availability)
- 18.2.2 Abu Dhabi National Oil Company*List Not Exhaustive
- 18.2.2.1. Overview
- 18.2.2.2. Products
- 18.2.2.3. SWOT Analysis
- 18.2.2.4. Recent Developments
- 18.2.2.5. Financials (Based on Availability)
- 18.2.3 Exxon Mobil Corporation
- 18.2.3.1. Overview
- 18.2.3.2. Products
- 18.2.3.3. SWOT Analysis
- 18.2.3.4. Recent Developments
- 18.2.3.5. Financials (Based on Availability)
- 18.2.4 Emirates National Oil Company
- 18.2.4.1. Overview
- 18.2.4.2. Products
- 18.2.4.3. SWOT Analysis
- 18.2.4.4. Recent Developments
- 18.2.4.5. Financials (Based on Availability)
- 18.2.5 Chevron Corporation
- 18.2.5.1. Overview
- 18.2.5.2. Products
- 18.2.5.3. SWOT Analysis
- 18.2.5.4. Recent Developments
- 18.2.5.5. Financials (Based on Availability)
- 18.2.6 TotalENergies SE
- 18.2.6.1. Overview
- 18.2.6.2. Products
- 18.2.6.3. SWOT Analysis
- 18.2.6.4. Recent Developments
- 18.2.6.5. Financials (Based on Availability)
- 18.2.7 BP PLC
- 18.2.7.1. Overview
- 18.2.7.2. Products
- 18.2.7.3. SWOT Analysis
- 18.2.7.4. Recent Developments
- 18.2.7.5. Financials (Based on Availability)
- 18.2.8 Repsol SA
- 18.2.8.1. Overview
- 18.2.8.2. Products
- 18.2.8.3. SWOT Analysis
- 18.2.8.4. Recent Developments
- 18.2.8.5. Financials (Based on Availability)
- 18.2.1 Shell PLC
List of Figures
- Figure 1: Global MEA Jet Fuel Industry Revenue Breakdown (Million, %) by Region 2024 & 2032
- Figure 2: Global MEA Jet Fuel Industry Volume Breakdown (Litre, %) by Region 2024 & 2032
- Figure 3: North America MEA Jet Fuel Industry Revenue (Million), by Country 2024 & 2032
- Figure 4: North America MEA Jet Fuel Industry Volume (Litre), by Country 2024 & 2032
- Figure 5: North America MEA Jet Fuel Industry Revenue Share (%), by Country 2024 & 2032
- Figure 6: North America MEA Jet Fuel Industry Volume Share (%), by Country 2024 & 2032
- Figure 7: Europe MEA Jet Fuel Industry Revenue (Million), by Country 2024 & 2032
- Figure 8: Europe MEA Jet Fuel Industry Volume (Litre), by Country 2024 & 2032
- Figure 9: Europe MEA Jet Fuel Industry Revenue Share (%), by Country 2024 & 2032
- Figure 10: Europe MEA Jet Fuel Industry Volume Share (%), by Country 2024 & 2032
- Figure 11: Asia Pacific MEA Jet Fuel Industry Revenue (Million), by Country 2024 & 2032
- Figure 12: Asia Pacific MEA Jet Fuel Industry Volume (Litre), by Country 2024 & 2032
- Figure 13: Asia Pacific MEA Jet Fuel Industry Revenue Share (%), by Country 2024 & 2032
- Figure 14: Asia Pacific MEA Jet Fuel Industry Volume Share (%), by Country 2024 & 2032
- Figure 15: South America MEA Jet Fuel Industry Revenue (Million), by Country 2024 & 2032
- Figure 16: South America MEA Jet Fuel Industry Volume (Litre), by Country 2024 & 2032
- Figure 17: South America MEA Jet Fuel Industry Revenue Share (%), by Country 2024 & 2032
- Figure 18: South America MEA Jet Fuel Industry Volume Share (%), by Country 2024 & 2032
- Figure 19: North America MEA Jet Fuel Industry Revenue (Million), by Country 2024 & 2032
- Figure 20: North America MEA Jet Fuel Industry Volume (Litre), by Country 2024 & 2032
- Figure 21: North America MEA Jet Fuel Industry Revenue Share (%), by Country 2024 & 2032
- Figure 22: North America MEA Jet Fuel Industry Volume Share (%), by Country 2024 & 2032
- Figure 23: MEA MEA Jet Fuel Industry Revenue (Million), by Country 2024 & 2032
- Figure 24: MEA MEA Jet Fuel Industry Volume (Litre), by Country 2024 & 2032
- Figure 25: MEA MEA Jet Fuel Industry Revenue Share (%), by Country 2024 & 2032
- Figure 26: MEA MEA Jet Fuel Industry Volume Share (%), by Country 2024 & 2032
- Figure 27: United Arab Emirates MEA Jet Fuel Industry Revenue (Million), by Fuel Type 2024 & 2032
- Figure 28: United Arab Emirates MEA Jet Fuel Industry Volume (Litre), by Fuel Type 2024 & 2032
- Figure 29: United Arab Emirates MEA Jet Fuel Industry Revenue Share (%), by Fuel Type 2024 & 2032
- Figure 30: United Arab Emirates MEA Jet Fuel Industry Volume Share (%), by Fuel Type 2024 & 2032
- Figure 31: United Arab Emirates MEA Jet Fuel Industry Revenue (Million), by Application 2024 & 2032
- Figure 32: United Arab Emirates MEA Jet Fuel Industry Volume (Litre), by Application 2024 & 2032
- Figure 33: United Arab Emirates MEA Jet Fuel Industry Revenue Share (%), by Application 2024 & 2032
- Figure 34: United Arab Emirates MEA Jet Fuel Industry Volume Share (%), by Application 2024 & 2032
- Figure 35: United Arab Emirates MEA Jet Fuel Industry Revenue (Million), by Geography 2024 & 2032
- Figure 36: United Arab Emirates MEA Jet Fuel Industry Volume (Litre), by Geography 2024 & 2032
- Figure 37: United Arab Emirates MEA Jet Fuel Industry Revenue Share (%), by Geography 2024 & 2032
- Figure 38: United Arab Emirates MEA Jet Fuel Industry Volume Share (%), by Geography 2024 & 2032
- Figure 39: United Arab Emirates MEA Jet Fuel Industry Revenue (Million), by Country 2024 & 2032
- Figure 40: United Arab Emirates MEA Jet Fuel Industry Volume (Litre), by Country 2024 & 2032
- Figure 41: United Arab Emirates MEA Jet Fuel Industry Revenue Share (%), by Country 2024 & 2032
- Figure 42: United Arab Emirates MEA Jet Fuel Industry Volume Share (%), by Country 2024 & 2032
- Figure 43: Saudi Arabia MEA Jet Fuel Industry Revenue (Million), by Fuel Type 2024 & 2032
- Figure 44: Saudi Arabia MEA Jet Fuel Industry Volume (Litre), by Fuel Type 2024 & 2032
- Figure 45: Saudi Arabia MEA Jet Fuel Industry Revenue Share (%), by Fuel Type 2024 & 2032
- Figure 46: Saudi Arabia MEA Jet Fuel Industry Volume Share (%), by Fuel Type 2024 & 2032
- Figure 47: Saudi Arabia MEA Jet Fuel Industry Revenue (Million), by Application 2024 & 2032
- Figure 48: Saudi Arabia MEA Jet Fuel Industry Volume (Litre), by Application 2024 & 2032
- Figure 49: Saudi Arabia MEA Jet Fuel Industry Revenue Share (%), by Application 2024 & 2032
- Figure 50: Saudi Arabia MEA Jet Fuel Industry Volume Share (%), by Application 2024 & 2032
- Figure 51: Saudi Arabia MEA Jet Fuel Industry Revenue (Million), by Geography 2024 & 2032
- Figure 52: Saudi Arabia MEA Jet Fuel Industry Volume (Litre), by Geography 2024 & 2032
- Figure 53: Saudi Arabia MEA Jet Fuel Industry Revenue Share (%), by Geography 2024 & 2032
- Figure 54: Saudi Arabia MEA Jet Fuel Industry Volume Share (%), by Geography 2024 & 2032
- Figure 55: Saudi Arabia MEA Jet Fuel Industry Revenue (Million), by Country 2024 & 2032
- Figure 56: Saudi Arabia MEA Jet Fuel Industry Volume (Litre), by Country 2024 & 2032
- Figure 57: Saudi Arabia MEA Jet Fuel Industry Revenue Share (%), by Country 2024 & 2032
- Figure 58: Saudi Arabia MEA Jet Fuel Industry Volume Share (%), by Country 2024 & 2032
- Figure 59: Qatar MEA Jet Fuel Industry Revenue (Million), by Fuel Type 2024 & 2032
- Figure 60: Qatar MEA Jet Fuel Industry Volume (Litre), by Fuel Type 2024 & 2032
- Figure 61: Qatar MEA Jet Fuel Industry Revenue Share (%), by Fuel Type 2024 & 2032
- Figure 62: Qatar MEA Jet Fuel Industry Volume Share (%), by Fuel Type 2024 & 2032
- Figure 63: Qatar MEA Jet Fuel Industry Revenue (Million), by Application 2024 & 2032
- Figure 64: Qatar MEA Jet Fuel Industry Volume (Litre), by Application 2024 & 2032
- Figure 65: Qatar MEA Jet Fuel Industry Revenue Share (%), by Application 2024 & 2032
- Figure 66: Qatar MEA Jet Fuel Industry Volume Share (%), by Application 2024 & 2032
- Figure 67: Qatar MEA Jet Fuel Industry Revenue (Million), by Geography 2024 & 2032
- Figure 68: Qatar MEA Jet Fuel Industry Volume (Litre), by Geography 2024 & 2032
- Figure 69: Qatar MEA Jet Fuel Industry Revenue Share (%), by Geography 2024 & 2032
- Figure 70: Qatar MEA Jet Fuel Industry Volume Share (%), by Geography 2024 & 2032
- Figure 71: Qatar MEA Jet Fuel Industry Revenue (Million), by Country 2024 & 2032
- Figure 72: Qatar MEA Jet Fuel Industry Volume (Litre), by Country 2024 & 2032
- Figure 73: Qatar MEA Jet Fuel Industry Revenue Share (%), by Country 2024 & 2032
- Figure 74: Qatar MEA Jet Fuel Industry Volume Share (%), by Country 2024 & 2032
- Figure 75: Egypt MEA Jet Fuel Industry Revenue (Million), by Fuel Type 2024 & 2032
- Figure 76: Egypt MEA Jet Fuel Industry Volume (Litre), by Fuel Type 2024 & 2032
- Figure 77: Egypt MEA Jet Fuel Industry Revenue Share (%), by Fuel Type 2024 & 2032
- Figure 78: Egypt MEA Jet Fuel Industry Volume Share (%), by Fuel Type 2024 & 2032
- Figure 79: Egypt MEA Jet Fuel Industry Revenue (Million), by Application 2024 & 2032
- Figure 80: Egypt MEA Jet Fuel Industry Volume (Litre), by Application 2024 & 2032
- Figure 81: Egypt MEA Jet Fuel Industry Revenue Share (%), by Application 2024 & 2032
- Figure 82: Egypt MEA Jet Fuel Industry Volume Share (%), by Application 2024 & 2032
- Figure 83: Egypt MEA Jet Fuel Industry Revenue (Million), by Geography 2024 & 2032
- Figure 84: Egypt MEA Jet Fuel Industry Volume (Litre), by Geography 2024 & 2032
- Figure 85: Egypt MEA Jet Fuel Industry Revenue Share (%), by Geography 2024 & 2032
- Figure 86: Egypt MEA Jet Fuel Industry Volume Share (%), by Geography 2024 & 2032
- Figure 87: Egypt MEA Jet Fuel Industry Revenue (Million), by Country 2024 & 2032
- Figure 88: Egypt MEA Jet Fuel Industry Volume (Litre), by Country 2024 & 2032
- Figure 89: Egypt MEA Jet Fuel Industry Revenue Share (%), by Country 2024 & 2032
- Figure 90: Egypt MEA Jet Fuel Industry Volume Share (%), by Country 2024 & 2032
- Figure 91: South Africa MEA Jet Fuel Industry Revenue (Million), by Fuel Type 2024 & 2032
- Figure 92: South Africa MEA Jet Fuel Industry Volume (Litre), by Fuel Type 2024 & 2032
- Figure 93: South Africa MEA Jet Fuel Industry Revenue Share (%), by Fuel Type 2024 & 2032
- Figure 94: South Africa MEA Jet Fuel Industry Volume Share (%), by Fuel Type 2024 & 2032
- Figure 95: South Africa MEA Jet Fuel Industry Revenue (Million), by Application 2024 & 2032
- Figure 96: South Africa MEA Jet Fuel Industry Volume (Litre), by Application 2024 & 2032
- Figure 97: South Africa MEA Jet Fuel Industry Revenue Share (%), by Application 2024 & 2032
- Figure 98: South Africa MEA Jet Fuel Industry Volume Share (%), by Application 2024 & 2032
- Figure 99: South Africa MEA Jet Fuel Industry Revenue (Million), by Geography 2024 & 2032
- Figure 100: South Africa MEA Jet Fuel Industry Volume (Litre), by Geography 2024 & 2032
- Figure 101: South Africa MEA Jet Fuel Industry Revenue Share (%), by Geography 2024 & 2032
- Figure 102: South Africa MEA Jet Fuel Industry Volume Share (%), by Geography 2024 & 2032
- Figure 103: South Africa MEA Jet Fuel Industry Revenue (Million), by Country 2024 & 2032
- Figure 104: South Africa MEA Jet Fuel Industry Volume (Litre), by Country 2024 & 2032
- Figure 105: South Africa MEA Jet Fuel Industry Revenue Share (%), by Country 2024 & 2032
- Figure 106: South Africa MEA Jet Fuel Industry Volume Share (%), by Country 2024 & 2032
- Figure 107: Rest of Middle East and Africa MEA Jet Fuel Industry Revenue (Million), by Fuel Type 2024 & 2032
- Figure 108: Rest of Middle East and Africa MEA Jet Fuel Industry Volume (Litre), by Fuel Type 2024 & 2032
- Figure 109: Rest of Middle East and Africa MEA Jet Fuel Industry Revenue Share (%), by Fuel Type 2024 & 2032
- Figure 110: Rest of Middle East and Africa MEA Jet Fuel Industry Volume Share (%), by Fuel Type 2024 & 2032
- Figure 111: Rest of Middle East and Africa MEA Jet Fuel Industry Revenue (Million), by Application 2024 & 2032
- Figure 112: Rest of Middle East and Africa MEA Jet Fuel Industry Volume (Litre), by Application 2024 & 2032
- Figure 113: Rest of Middle East and Africa MEA Jet Fuel Industry Revenue Share (%), by Application 2024 & 2032
- Figure 114: Rest of Middle East and Africa MEA Jet Fuel Industry Volume Share (%), by Application 2024 & 2032
- Figure 115: Rest of Middle East and Africa MEA Jet Fuel Industry Revenue (Million), by Geography 2024 & 2032
- Figure 116: Rest of Middle East and Africa MEA Jet Fuel Industry Volume (Litre), by Geography 2024 & 2032
- Figure 117: Rest of Middle East and Africa MEA Jet Fuel Industry Revenue Share (%), by Geography 2024 & 2032
- Figure 118: Rest of Middle East and Africa MEA Jet Fuel Industry Volume Share (%), by Geography 2024 & 2032
- Figure 119: Rest of Middle East and Africa MEA Jet Fuel Industry Revenue (Million), by Country 2024 & 2032
- Figure 120: Rest of Middle East and Africa MEA Jet Fuel Industry Volume (Litre), by Country 2024 & 2032
- Figure 121: Rest of Middle East and Africa MEA Jet Fuel Industry Revenue Share (%), by Country 2024 & 2032
- Figure 122: Rest of Middle East and Africa MEA Jet Fuel Industry Volume Share (%), by Country 2024 & 2032
List of Tables
- Table 1: Global MEA Jet Fuel Industry Revenue Million Forecast, by Region 2019 & 2032
- Table 2: Global MEA Jet Fuel Industry Volume Litre Forecast, by Region 2019 & 2032
- Table 3: Global MEA Jet Fuel Industry Revenue Million Forecast, by Fuel Type 2019 & 2032
- Table 4: Global MEA Jet Fuel Industry Volume Litre Forecast, by Fuel Type 2019 & 2032
- Table 5: Global MEA Jet Fuel Industry Revenue Million Forecast, by Application 2019 & 2032
- Table 6: Global MEA Jet Fuel Industry Volume Litre Forecast, by Application 2019 & 2032
- Table 7: Global MEA Jet Fuel Industry Revenue Million Forecast, by Geography 2019 & 2032
- Table 8: Global MEA Jet Fuel Industry Volume Litre Forecast, by Geography 2019 & 2032
- Table 9: Global MEA Jet Fuel Industry Revenue Million Forecast, by Region 2019 & 2032
- Table 10: Global MEA Jet Fuel Industry Volume Litre Forecast, by Region 2019 & 2032
- Table 11: Global MEA Jet Fuel Industry Revenue Million Forecast, by Country 2019 & 2032
- Table 12: Global MEA Jet Fuel Industry Volume Litre Forecast, by Country 2019 & 2032
- Table 13: United States MEA Jet Fuel Industry Revenue (Million) Forecast, by Application 2019 & 2032
- Table 14: United States MEA Jet Fuel Industry Volume (Litre) Forecast, by Application 2019 & 2032
- Table 15: Canada MEA Jet Fuel Industry Revenue (Million) Forecast, by Application 2019 & 2032
- Table 16: Canada MEA Jet Fuel Industry Volume (Litre) Forecast, by Application 2019 & 2032
- Table 17: Mexico MEA Jet Fuel Industry Revenue (Million) Forecast, by Application 2019 & 2032
- Table 18: Mexico MEA Jet Fuel Industry Volume (Litre) Forecast, by Application 2019 & 2032
- Table 19: Global MEA Jet Fuel Industry Revenue Million Forecast, by Country 2019 & 2032
- Table 20: Global MEA Jet Fuel Industry Volume Litre Forecast, by Country 2019 & 2032
- Table 21: Germany MEA Jet Fuel Industry Revenue (Million) Forecast, by Application 2019 & 2032
- Table 22: Germany MEA Jet Fuel Industry Volume (Litre) Forecast, by Application 2019 & 2032
- Table 23: United Kingdom MEA Jet Fuel Industry Revenue (Million) Forecast, by Application 2019 & 2032
- Table 24: United Kingdom MEA Jet Fuel Industry Volume (Litre) Forecast, by Application 2019 & 2032
- Table 25: France MEA Jet Fuel Industry Revenue (Million) Forecast, by Application 2019 & 2032
- Table 26: France MEA Jet Fuel Industry Volume (Litre) Forecast, by Application 2019 & 2032
- Table 27: Spain MEA Jet Fuel Industry Revenue (Million) Forecast, by Application 2019 & 2032
- Table 28: Spain MEA Jet Fuel Industry Volume (Litre) Forecast, by Application 2019 & 2032
- Table 29: Italy MEA Jet Fuel Industry Revenue (Million) Forecast, by Application 2019 & 2032
- Table 30: Italy MEA Jet Fuel Industry Volume (Litre) Forecast, by Application 2019 & 2032
- Table 31: Spain MEA Jet Fuel Industry Revenue (Million) Forecast, by Application 2019 & 2032
- Table 32: Spain MEA Jet Fuel Industry Volume (Litre) Forecast, by Application 2019 & 2032
- Table 33: Belgium MEA Jet Fuel Industry Revenue (Million) Forecast, by Application 2019 & 2032
- Table 34: Belgium MEA Jet Fuel Industry Volume (Litre) Forecast, by Application 2019 & 2032
- Table 35: Netherland MEA Jet Fuel Industry Revenue (Million) Forecast, by Application 2019 & 2032
- Table 36: Netherland MEA Jet Fuel Industry Volume (Litre) Forecast, by Application 2019 & 2032
- Table 37: Nordics MEA Jet Fuel Industry Revenue (Million) Forecast, by Application 2019 & 2032
- Table 38: Nordics MEA Jet Fuel Industry Volume (Litre) Forecast, by Application 2019 & 2032
- Table 39: Rest of Europe MEA Jet Fuel Industry Revenue (Million) Forecast, by Application 2019 & 2032
- Table 40: Rest of Europe MEA Jet Fuel Industry Volume (Litre) Forecast, by Application 2019 & 2032
- Table 41: Global MEA Jet Fuel Industry Revenue Million Forecast, by Country 2019 & 2032
- Table 42: Global MEA Jet Fuel Industry Volume Litre Forecast, by Country 2019 & 2032
- Table 43: China MEA Jet Fuel Industry Revenue (Million) Forecast, by Application 2019 & 2032
- Table 44: China MEA Jet Fuel Industry Volume (Litre) Forecast, by Application 2019 & 2032
- Table 45: Japan MEA Jet Fuel Industry Revenue (Million) Forecast, by Application 2019 & 2032
- Table 46: Japan MEA Jet Fuel Industry Volume (Litre) Forecast, by Application 2019 & 2032
- Table 47: India MEA Jet Fuel Industry Revenue (Million) Forecast, by Application 2019 & 2032
- Table 48: India MEA Jet Fuel Industry Volume (Litre) Forecast, by Application 2019 & 2032
- Table 49: South Korea MEA Jet Fuel Industry Revenue (Million) Forecast, by Application 2019 & 2032
- Table 50: South Korea MEA Jet Fuel Industry Volume (Litre) Forecast, by Application 2019 & 2032
- Table 51: Southeast Asia MEA Jet Fuel Industry Revenue (Million) Forecast, by Application 2019 & 2032
- Table 52: Southeast Asia MEA Jet Fuel Industry Volume (Litre) Forecast, by Application 2019 & 2032
- Table 53: Australia MEA Jet Fuel Industry Revenue (Million) Forecast, by Application 2019 & 2032
- Table 54: Australia MEA Jet Fuel Industry Volume (Litre) Forecast, by Application 2019 & 2032
- Table 55: Indonesia MEA Jet Fuel Industry Revenue (Million) Forecast, by Application 2019 & 2032
- Table 56: Indonesia MEA Jet Fuel Industry Volume (Litre) Forecast, by Application 2019 & 2032
- Table 57: Phillipes MEA Jet Fuel Industry Revenue (Million) Forecast, by Application 2019 & 2032
- Table 58: Phillipes MEA Jet Fuel Industry Volume (Litre) Forecast, by Application 2019 & 2032
- Table 59: Singapore MEA Jet Fuel Industry Revenue (Million) Forecast, by Application 2019 & 2032
- Table 60: Singapore MEA Jet Fuel Industry Volume (Litre) Forecast, by Application 2019 & 2032
- Table 61: Thailandc MEA Jet Fuel Industry Revenue (Million) Forecast, by Application 2019 & 2032
- Table 62: Thailandc MEA Jet Fuel Industry Volume (Litre) Forecast, by Application 2019 & 2032
- Table 63: Rest of Asia Pacific MEA Jet Fuel Industry Revenue (Million) Forecast, by Application 2019 & 2032
- Table 64: Rest of Asia Pacific MEA Jet Fuel Industry Volume (Litre) Forecast, by Application 2019 & 2032
- Table 65: Global MEA Jet Fuel Industry Revenue Million Forecast, by Country 2019 & 2032
- Table 66: Global MEA Jet Fuel Industry Volume Litre Forecast, by Country 2019 & 2032
- Table 67: Brazil MEA Jet Fuel Industry Revenue (Million) Forecast, by Application 2019 & 2032
- Table 68: Brazil MEA Jet Fuel Industry Volume (Litre) Forecast, by Application 2019 & 2032
- Table 69: Argentina MEA Jet Fuel Industry Revenue (Million) Forecast, by Application 2019 & 2032
- Table 70: Argentina MEA Jet Fuel Industry Volume (Litre) Forecast, by Application 2019 & 2032
- Table 71: Peru MEA Jet Fuel Industry Revenue (Million) Forecast, by Application 2019 & 2032
- Table 72: Peru MEA Jet Fuel Industry Volume (Litre) Forecast, by Application 2019 & 2032
- Table 73: Chile MEA Jet Fuel Industry Revenue (Million) Forecast, by Application 2019 & 2032
- Table 74: Chile MEA Jet Fuel Industry Volume (Litre) Forecast, by Application 2019 & 2032
- Table 75: Colombia MEA Jet Fuel Industry Revenue (Million) Forecast, by Application 2019 & 2032
- Table 76: Colombia MEA Jet Fuel Industry Volume (Litre) Forecast, by Application 2019 & 2032
- Table 77: Ecuador MEA Jet Fuel Industry Revenue (Million) Forecast, by Application 2019 & 2032
- Table 78: Ecuador MEA Jet Fuel Industry Volume (Litre) Forecast, by Application 2019 & 2032
- Table 79: Venezuela MEA Jet Fuel Industry Revenue (Million) Forecast, by Application 2019 & 2032
- Table 80: Venezuela MEA Jet Fuel Industry Volume (Litre) Forecast, by Application 2019 & 2032
- Table 81: Rest of South America MEA Jet Fuel Industry Revenue (Million) Forecast, by Application 2019 & 2032
- Table 82: Rest of South America MEA Jet Fuel Industry Volume (Litre) Forecast, by Application 2019 & 2032
- Table 83: Global MEA Jet Fuel Industry Revenue Million Forecast, by Country 2019 & 2032
- Table 84: Global MEA Jet Fuel Industry Volume Litre Forecast, by Country 2019 & 2032
- Table 85: United States MEA Jet Fuel Industry Revenue (Million) Forecast, by Application 2019 & 2032
- Table 86: United States MEA Jet Fuel Industry Volume (Litre) Forecast, by Application 2019 & 2032
- Table 87: Canada MEA Jet Fuel Industry Revenue (Million) Forecast, by Application 2019 & 2032
- Table 88: Canada MEA Jet Fuel Industry Volume (Litre) Forecast, by Application 2019 & 2032
- Table 89: Mexico MEA Jet Fuel Industry Revenue (Million) Forecast, by Application 2019 & 2032
- Table 90: Mexico MEA Jet Fuel Industry Volume (Litre) Forecast, by Application 2019 & 2032
- Table 91: Global MEA Jet Fuel Industry Revenue Million Forecast, by Country 2019 & 2032
- Table 92: Global MEA Jet Fuel Industry Volume Litre Forecast, by Country 2019 & 2032
- Table 93: United Arab Emirates MEA Jet Fuel Industry Revenue (Million) Forecast, by Application 2019 & 2032
- Table 94: United Arab Emirates MEA Jet Fuel Industry Volume (Litre) Forecast, by Application 2019 & 2032
- Table 95: Saudi Arabia MEA Jet Fuel Industry Revenue (Million) Forecast, by Application 2019 & 2032
- Table 96: Saudi Arabia MEA Jet Fuel Industry Volume (Litre) Forecast, by Application 2019 & 2032
- Table 97: South Africa MEA Jet Fuel Industry Revenue (Million) Forecast, by Application 2019 & 2032
- Table 98: South Africa MEA Jet Fuel Industry Volume (Litre) Forecast, by Application 2019 & 2032
- Table 99: Rest of Middle East and Africa MEA Jet Fuel Industry Revenue (Million) Forecast, by Application 2019 & 2032
- Table 100: Rest of Middle East and Africa MEA Jet Fuel Industry Volume (Litre) Forecast, by Application 2019 & 2032
- Table 101: Global MEA Jet Fuel Industry Revenue Million Forecast, by Fuel Type 2019 & 2032
- Table 102: Global MEA Jet Fuel Industry Volume Litre Forecast, by Fuel Type 2019 & 2032
- Table 103: Global MEA Jet Fuel Industry Revenue Million Forecast, by Application 2019 & 2032
- Table 104: Global MEA Jet Fuel Industry Volume Litre Forecast, by Application 2019 & 2032
- Table 105: Global MEA Jet Fuel Industry Revenue Million Forecast, by Geography 2019 & 2032
- Table 106: Global MEA Jet Fuel Industry Volume Litre Forecast, by Geography 2019 & 2032
- Table 107: Global MEA Jet Fuel Industry Revenue Million Forecast, by Country 2019 & 2032
- Table 108: Global MEA Jet Fuel Industry Volume Litre Forecast, by Country 2019 & 2032
- Table 109: Global MEA Jet Fuel Industry Revenue Million Forecast, by Fuel Type 2019 & 2032
- Table 110: Global MEA Jet Fuel Industry Volume Litre Forecast, by Fuel Type 2019 & 2032
- Table 111: Global MEA Jet Fuel Industry Revenue Million Forecast, by Application 2019 & 2032
- Table 112: Global MEA Jet Fuel Industry Volume Litre Forecast, by Application 2019 & 2032
- Table 113: Global MEA Jet Fuel Industry Revenue Million Forecast, by Geography 2019 & 2032
- Table 114: Global MEA Jet Fuel Industry Volume Litre Forecast, by Geography 2019 & 2032
- Table 115: Global MEA Jet Fuel Industry Revenue Million Forecast, by Country 2019 & 2032
- Table 116: Global MEA Jet Fuel Industry Volume Litre Forecast, by Country 2019 & 2032
- Table 117: Global MEA Jet Fuel Industry Revenue Million Forecast, by Fuel Type 2019 & 2032
- Table 118: Global MEA Jet Fuel Industry Volume Litre Forecast, by Fuel Type 2019 & 2032
- Table 119: Global MEA Jet Fuel Industry Revenue Million Forecast, by Application 2019 & 2032
- Table 120: Global MEA Jet Fuel Industry Volume Litre Forecast, by Application 2019 & 2032
- Table 121: Global MEA Jet Fuel Industry Revenue Million Forecast, by Geography 2019 & 2032
- Table 122: Global MEA Jet Fuel Industry Volume Litre Forecast, by Geography 2019 & 2032
- Table 123: Global MEA Jet Fuel Industry Revenue Million Forecast, by Country 2019 & 2032
- Table 124: Global MEA Jet Fuel Industry Volume Litre Forecast, by Country 2019 & 2032
- Table 125: Global MEA Jet Fuel Industry Revenue Million Forecast, by Fuel Type 2019 & 2032
- Table 126: Global MEA Jet Fuel Industry Volume Litre Forecast, by Fuel Type 2019 & 2032
- Table 127: Global MEA Jet Fuel Industry Revenue Million Forecast, by Application 2019 & 2032
- Table 128: Global MEA Jet Fuel Industry Volume Litre Forecast, by Application 2019 & 2032
- Table 129: Global MEA Jet Fuel Industry Revenue Million Forecast, by Geography 2019 & 2032
- Table 130: Global MEA Jet Fuel Industry Volume Litre Forecast, by Geography 2019 & 2032
- Table 131: Global MEA Jet Fuel Industry Revenue Million Forecast, by Country 2019 & 2032
- Table 132: Global MEA Jet Fuel Industry Volume Litre Forecast, by Country 2019 & 2032
- Table 133: Global MEA Jet Fuel Industry Revenue Million Forecast, by Fuel Type 2019 & 2032
- Table 134: Global MEA Jet Fuel Industry Volume Litre Forecast, by Fuel Type 2019 & 2032
- Table 135: Global MEA Jet Fuel Industry Revenue Million Forecast, by Application 2019 & 2032
- Table 136: Global MEA Jet Fuel Industry Volume Litre Forecast, by Application 2019 & 2032
- Table 137: Global MEA Jet Fuel Industry Revenue Million Forecast, by Geography 2019 & 2032
- Table 138: Global MEA Jet Fuel Industry Volume Litre Forecast, by Geography 2019 & 2032
- Table 139: Global MEA Jet Fuel Industry Revenue Million Forecast, by Country 2019 & 2032
- Table 140: Global MEA Jet Fuel Industry Volume Litre Forecast, by Country 2019 & 2032
- Table 141: Global MEA Jet Fuel Industry Revenue Million Forecast, by Fuel Type 2019 & 2032
- Table 142: Global MEA Jet Fuel Industry Volume Litre Forecast, by Fuel Type 2019 & 2032
- Table 143: Global MEA Jet Fuel Industry Revenue Million Forecast, by Application 2019 & 2032
- Table 144: Global MEA Jet Fuel Industry Volume Litre Forecast, by Application 2019 & 2032
- Table 145: Global MEA Jet Fuel Industry Revenue Million Forecast, by Geography 2019 & 2032
- Table 146: Global MEA Jet Fuel Industry Volume Litre Forecast, by Geography 2019 & 2032
- Table 147: Global MEA Jet Fuel Industry Revenue Million Forecast, by Country 2019 & 2032
- Table 148: Global MEA Jet Fuel Industry Volume Litre Forecast, by Country 2019 & 2032
Frequently Asked Questions
1. What is the projected Compound Annual Growth Rate (CAGR) of the MEA Jet Fuel Industry?
The projected CAGR is approximately > 13.00%.
2. Which companies are prominent players in the MEA Jet Fuel Industry?
Key companies in the market include Shell PLC, Abu Dhabi National Oil Company*List Not Exhaustive, Exxon Mobil Corporation, Emirates National Oil Company, Chevron Corporation, TotalENergies SE, BP PLC, Repsol SA.
3. What are the main segments of the MEA Jet Fuel Industry?
The market segments include Fuel Type, Application, Geography.
4. Can you provide details about the market size?
The market size is estimated to be USD XX Million as of 2022.
5. What are some drivers contributing to market growth?
Increasing Renewables Capacity in Thailand4.; Rising Modernization of Existing Transmission and Distribution Infrastructure.
6. What are the notable trends driving market growth?
Commercial Sector to Dominate the Market.
7. Are there any restraints impacting market growth?
Huge Capital Expenditure Required for Carrying out Modernization of Existing Facilities.
8. Can you provide examples of recent developments in the market?
January 2022: Masdar, Siemens Energy, and TotalEnergies signed a partnership agreement focused on green hydrogen to produce sustainable aviation fuel (SAF).
9. What pricing options are available for accessing the report?
Pricing options include single-user, multi-user, and enterprise licenses priced at USD 4750, USD 5250, and USD 8750 respectively.
10. Is the market size provided in terms of value or volume?
The market size is provided in terms of value, measured in Million and volume, measured in Litre.
11. Are there any specific market keywords associated with the report?
Yes, the market keyword associated with the report is "MEA Jet Fuel Industry," which aids in identifying and referencing the specific market segment covered.
12. How do I determine which pricing option suits my needs best?
The pricing options vary based on user requirements and access needs. Individual users may opt for single-user licenses, while businesses requiring broader access may choose multi-user or enterprise licenses for cost-effective access to the report.
13. Are there any additional resources or data provided in the MEA Jet Fuel Industry report?
While the report offers comprehensive insights, it's advisable to review the specific contents or supplementary materials provided to ascertain if additional resources or data are available.
14. How can I stay updated on further developments or reports in the MEA Jet Fuel Industry?
To stay informed about further developments, trends, and reports in the MEA Jet Fuel Industry, consider subscribing to industry newsletters, following relevant companies and organizations, or regularly checking reputable industry news sources and publications.
Methodology
Step 1 - Identification of Relevant Samples Size from Population Database


Step 2 - Approaches for Defining Global Market Size (Value, Volume* & Price*)

Note*: In applicable scenarios
Step 3 - Data Sources
Primary Research
- Web Analytics
- Survey Reports
- Research Institute
- Latest Research Reports
- Opinion Leaders
Secondary Research
- Annual Reports
- White Paper
- Latest Press Release
- Industry Association
- Paid Database
- Investor Presentations

Step 4 - Data Triangulation
Involves using different sources of information in order to increase the validity of a study
These sources are likely to be stakeholders in a program - participants, other researchers, program staff, other community members, and so on.
Then we put all data in single framework & apply various statistical tools to find out the dynamic on the market.
During the analysis stage, feedback from the stakeholder groups would be compared to determine areas of agreement as well as areas of divergence


