
Key Insights
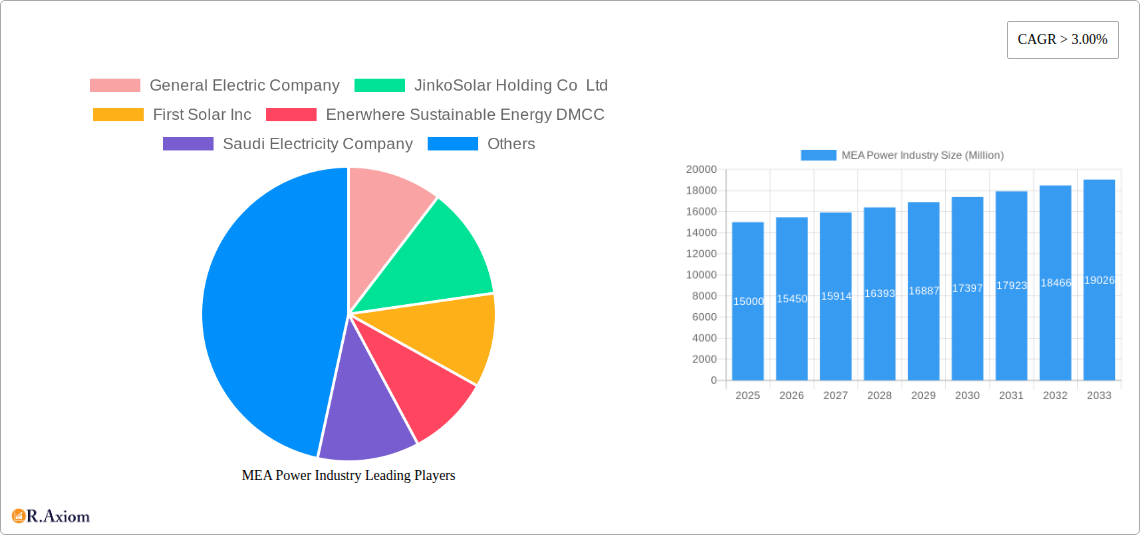
The Middle East and Africa (MEA) power industry is experiencing robust growth, driven by increasing energy demand fueled by population growth, urbanization, and industrial expansion. A compound annual growth rate (CAGR) exceeding 3.00% indicates a significant upward trajectory, with the market size expected to reach substantial figures by 2033. Key drivers include government initiatives promoting renewable energy sources to diversify energy portfolios and reduce reliance on fossil fuels, alongside large-scale infrastructure projects across the region. The transition towards renewable energy is particularly prominent, with solar and wind power witnessing significant investments and capacity additions. This shift is further fueled by decreasing renewable energy technology costs and increasing awareness of environmental sustainability. However, the industry faces certain restraints, including the high initial investment costs associated with renewable energy infrastructure and the ongoing geopolitical uncertainties impacting project development and funding in some regions.
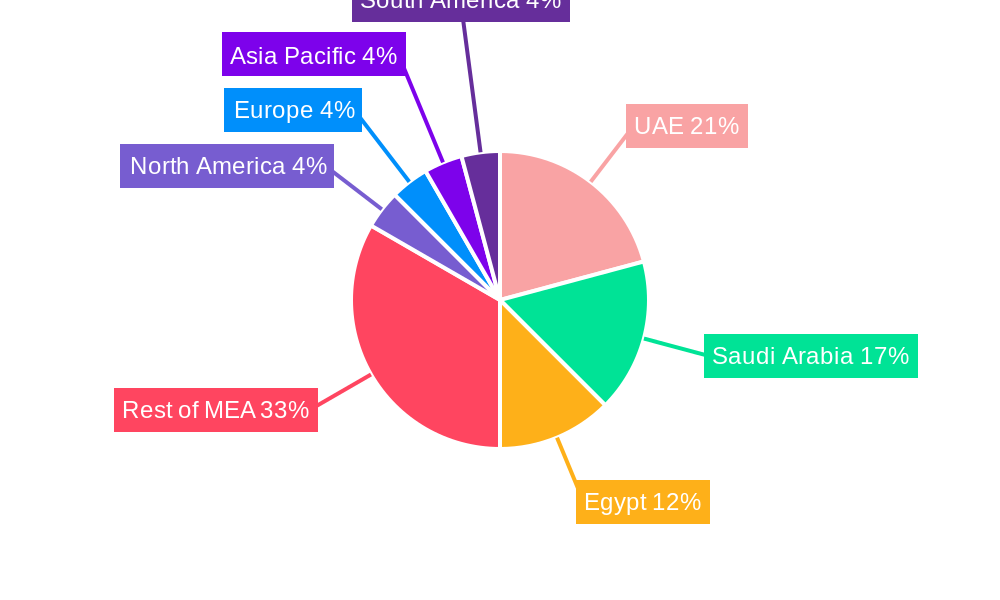
Market segmentation reveals a diverse landscape. Geographically, the United Arab Emirates (UAE), Saudi Arabia, and Egypt represent the largest markets within the MEA region, owing to their advanced economies and substantial energy consumption. In terms of generation sources, thermal power remains dominant, but the share of renewable sources, including solar, hydro, and wind, is steadily increasing, reflecting proactive governmental policies and private sector investments. Major players such as General Electric, JinkoSolar, and ACWA Power are actively shaping the market, contributing to both traditional and renewable energy segments. The forecast period (2025-2033) will be critical in witnessing the extent to which renewable energy sources displace traditional thermal power, shaping the long-term outlook of the MEA power industry and its contribution to sustainable development goals.
MEA Power Industry: Market Analysis and Forecast (2019-2033)
This comprehensive report provides an in-depth analysis of the Middle East and Africa (MEA) power industry, offering valuable insights for stakeholders across the value chain. The report covers the period from 2019 to 2033, with 2025 as the base and estimated year. It examines market dynamics, key players, emerging trends, and future growth prospects, providing a crucial foundation for informed decision-making. The study segments the market by generation source (Thermal, Renewable, Hydro, Others), and geography (United Arab Emirates, Saudi Arabia, Egypt, Jordan, Rest of Middle East and Africa). Projected market size values are given in millions.
MEA Power Industry Market Concentration & Innovation
This section analyzes the MEA power industry's competitive landscape, encompassing market concentration, innovation drivers, regulatory frameworks, and key trends. The market is characterized by a mix of established players and emerging entrants, leading to a moderately concentrated market. Major players such as General Electric Company, JinkoSolar Holding Co Ltd, and First Solar Inc hold significant market share, while regional players like Enerwhere Sustainable Energy DMCC, Saudi Electricity Company, and Dubai Electricity & Water Authority also contribute substantially.
- Market Share: GE holds approximately xx% market share in the thermal segment, while JinkoSolar and First Solar dominate the renewable segment with xx% and xx% respectively. The combined market share of the top 5 players is estimated at xx% in 2025.
- M&A Activity: The MEA power sector witnessed xx Billion USD in M&A transactions during the historical period (2019-2024), with a significant focus on renewable energy acquisitions. This trend is expected to continue, driven by the increasing demand for renewable energy solutions.
- Innovation Drivers: Technological advancements in renewable energy technologies, such as solar PV and wind power, are driving innovation. Stringent environmental regulations and government support for renewable energy are further stimulating the development of innovative solutions.
- Regulatory Frameworks: Varying regulatory frameworks across MEA countries influence market dynamics. Some countries have implemented supportive policies to promote renewable energy adoption, while others are still developing their regulatory frameworks.
- Product Substitutes: Natural gas and other fossil fuels are major substitutes for renewable energy sources in power generation. However, increasing environmental concerns and cost competitiveness are driving a shift towards renewables.
- End-User Trends: The increasing demand for reliable and affordable electricity from residential, commercial, and industrial sectors is driving growth in the MEA power industry.
MEA Power Industry Industry Trends & Insights
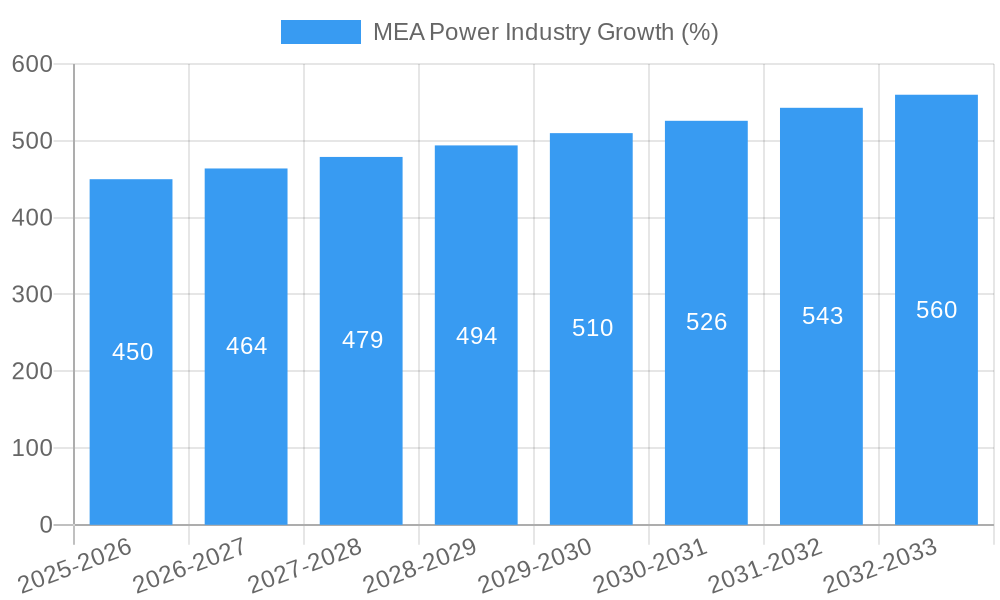
The MEA power industry is experiencing significant transformation driven by several key factors. The region's rapidly growing population and economy are fueling increased electricity demand, creating substantial opportunities for power producers. Government initiatives aimed at diversifying energy sources and enhancing energy security are pushing the transition towards renewable energy. Technological advancements, such as improved energy storage solutions and smart grids, are enhancing the efficiency and reliability of power systems. The industry is also witnessing the rise of decentralized generation, with distributed renewable energy sources becoming increasingly prevalent. The projected Compound Annual Growth Rate (CAGR) for the MEA power industry during the forecast period (2025-2033) is estimated to be xx%. Market penetration of renewable energy is projected to reach xx% by 2033. Competitive dynamics are characterized by intense competition amongst established players and the emergence of new entrants, particularly in the renewable energy sector.
Dominant Markets & Segments in MEA Power Industry
The United Arab Emirates (UAE) and Saudi Arabia are currently the dominant markets in the MEA power industry, driven by significant investments in infrastructure development and economic diversification efforts. Egypt and Jordan also show considerable growth potential due to rising energy demand and government initiatives.
- UAE: High economic growth and government investments in renewable energy projects are key drivers.
- Saudi Arabia: Significant investments in renewable energy capacity expansion through projects like Vision 2030 are major growth factors.
- Egypt: Growing population and industrialization are driving increased electricity demand.
- Jordan: Focus on energy diversification and renewable energy adoption is supporting growth.
- Rest of MEA: A mix of factors—from economic development to government policies—influences growth within individual nations of the "Rest of MEA" category. Development is uneven across these countries.
- Dominant Segment: The thermal segment currently holds the largest market share, but the renewable energy segment is anticipated to experience the fastest growth in the forecast period due to increased investment and government support.
Key Drivers:
- Economic Policies: Government incentives and investment plans are significantly bolstering growth in both thermal and renewable segments.
- Infrastructure Development: Massive infrastructure projects in several MEA countries are creating a strong demand for power.
MEA Power Industry Product Developments
The MEA power industry is witnessing significant product innovation, primarily focused on enhancing the efficiency and cost-effectiveness of renewable energy technologies. Developments include advanced solar PV panels with higher efficiency rates, improved wind turbine designs with increased energy capture, and innovative energy storage solutions. These advancements are improving the competitiveness of renewable energy and driving its wider adoption. The integration of smart grid technologies is also enhancing the overall efficiency and reliability of power systems.
Report Scope & Segmentation Analysis
This report comprehensively segments the MEA power industry by generation source (Thermal, Renewable, Hydro, Others) and geography (United Arab Emirates, Saudi Arabia, Egypt, Jordan, Rest of Middle East and Africa). Each segment's analysis includes growth projections, market size estimations, and an assessment of competitive dynamics. For instance, the renewable segment is projected to experience significant growth driven by policy support and technological advancements, while the thermal segment is expected to maintain its relevance despite facing pressure to reduce emissions. The market size for each segment is given in millions and the report further details each geographical region's market based on its unique infrastructure and regulatory landscape.
Key Drivers of MEA Power Industry Growth
The MEA power industry's growth is driven by several key factors:
- Rising Energy Demand: Rapid economic growth and population increase fuel a surge in electricity demand.
- Government Initiatives: Increased investments in renewable energy and energy efficiency programs.
- Technological Advancements: Improved efficiency and cost-effectiveness of renewable energy technologies.
- Economic Diversification: Many MEA nations are diversifying economies and reducing reliance on oil and gas, investing heavily in power infrastructure.
Challenges in the MEA Power Industry Sector
The MEA power industry faces several challenges, including:
- Regulatory Hurdles: Inconsistent regulatory frameworks across the region can hinder investment and development.
- Supply Chain Issues: Difficulties in securing reliable supply chains for equipment and materials can impact project timelines and costs.
- Financing Constraints: Securing sufficient financing for large-scale power projects can be challenging.
- Transmission and Distribution Infrastructure: Inadequate transmission and distribution infrastructure in some countries limits the effectiveness of new power generation capacity.
Emerging Opportunities in MEA Power Industry
The MEA power industry presents several opportunities:
- Renewable Energy Integration: Significant potential for growth in renewable energy technologies like solar, wind, and hydro.
- Smart Grid Technologies: Adoption of smart grid solutions to improve efficiency and grid stability.
- Energy Storage Solutions: Increased demand for energy storage systems to address the intermittency of renewable energy sources.
- Demand-Side Management: Implementing demand-side management programs to optimize energy consumption.
Leading Players in the MEA Power Industry Market
- General Electric Company
- JinkoSolar Holding Co Ltd
- First Solar Inc
- Enerwhere Sustainable Energy DMCC
- Saudi Electricity Company
- Juwi Solar Inc
- Eskom Holdings SOC Ltd
- Wuxi Suntech Power Co Ltd
- Dubai Electricity & Water Authority
- ACWA POWER BARKA SAOG
- Siemens AG
- Canadian Solar Inc
- AGE Technologies JHB (Pty) Limited
Key Developments in MEA Power Industry Industry
- 2022-Q4: UAE announces a significant investment in offshore wind power projects.
- 2023-Q1: Saudi Arabia launches a new initiative to support the development of green hydrogen projects.
- 2023-Q2: Egypt signs several agreements with international companies to expand its renewable energy capacity.
- 2023-Q3: Major M&A activity occurs in the renewable sector within the Rest of MEA region, consolidating market players.
Strategic Outlook for MEA Power Industry Market
The MEA power industry is poised for substantial growth over the next decade. Continued investment in renewable energy infrastructure, coupled with supportive government policies and technological advancements, will drive market expansion. The increasing demand for electricity, combined with opportunities in smart grid technologies and energy storage, will create a favorable environment for market players. The focus on regional energy independence will also drive substantial growth across different segments, presenting significant opportunities for companies to invest in and benefit from the region's dynamic power sector.
MEA Power Industry Segmentation
-
1. Generation - Source
- 1.1. Thermal
- 1.2. Renewable
- 1.3. Hydro
- 1.4. Others
- 2. Transmission and Distribution
-
3. Geogrpahy
- 3.1. United Arab Emirates
- 3.2. Saudi Arabia
- 3.3. Egypt
- 3.4. Jordan
- 3.5. Rest of Middle-East and Africa
MEA Power Industry Segmentation By Geography
-
1. North America
- 1.1. United States
- 1.2. Canada
- 1.3. Mexico
-
2. South America
- 2.1. Brazil
- 2.2. Argentina
- 2.3. Rest of South America
-
3. Europe
- 3.1. United Kingdom
- 3.2. Germany
- 3.3. France
- 3.4. Italy
- 3.5. Spain
- 3.6. Russia
- 3.7. Benelux
- 3.8. Nordics
- 3.9. Rest of Europe
-
4. Middle East & Africa
- 4.1. Turkey
- 4.2. Israel
- 4.3. GCC
- 4.4. North Africa
- 4.5. South Africa
- 4.6. Rest of Middle East & Africa
-
5. Asia Pacific
- 5.1. China
- 5.2. India
- 5.3. Japan
- 5.4. South Korea
- 5.5. ASEAN
- 5.6. Oceania
- 5.7. Rest of Asia Pacific
MEA Power Industry REPORT HIGHLIGHTS
| Aspects | Details |
|---|---|
| Study Period | 2019-2033 |
| Base Year | 2024 |
| Estimated Year | 2025 |
| Forecast Period | 2025-2033 |
| Historical Period | 2019-2024 |
| Growth Rate | CAGR of > 3.00% from 2019-2033 |
| Segmentation |
|
Table of Contents
- 1. Introduction
- 1.1. Research Scope
- 1.2. Market Segmentation
- 1.3. Research Methodology
- 1.4. Definitions and Assumptions
- 2. Executive Summary
- 2.1. Introduction
- 3. Market Dynamics
- 3.1. Introduction
- 3.2. Market Drivers
- 3.2.1. 4.; Demand for Solar Photovoltaic Installations4.; Growing Investments
- 3.3. Market Restrains
- 3.3.1. 4.; Increasing Wind Energy Installations
- 3.4. Market Trends
- 3.4.1. Thermal Sources to Dominate the Market
- 4. Market Factor Analysis
- 4.1. Porters Five Forces
- 4.2. Supply/Value Chain
- 4.3. PESTEL analysis
- 4.4. Market Entropy
- 4.5. Patent/Trademark Analysis
- 5. Global MEA Power Industry Analysis, Insights and Forecast, 2019-2031
- 5.1. Market Analysis, Insights and Forecast - by Generation - Source
- 5.1.1. Thermal
- 5.1.2. Renewable
- 5.1.3. Hydro
- 5.1.4. Others
- 5.2. Market Analysis, Insights and Forecast - by Transmission and Distribution
- 5.3. Market Analysis, Insights and Forecast - by Geogrpahy
- 5.3.1. United Arab Emirates
- 5.3.2. Saudi Arabia
- 5.3.3. Egypt
- 5.3.4. Jordan
- 5.3.5. Rest of Middle-East and Africa
- 5.4. Market Analysis, Insights and Forecast - by Region
- 5.4.1. North America
- 5.4.2. South America
- 5.4.3. Europe
- 5.4.4. Middle East & Africa
- 5.4.5. Asia Pacific
- 5.1. Market Analysis, Insights and Forecast - by Generation - Source
- 6. North America MEA Power Industry Analysis, Insights and Forecast, 2019-2031
- 6.1. Market Analysis, Insights and Forecast - by Generation - Source
- 6.1.1. Thermal
- 6.1.2. Renewable
- 6.1.3. Hydro
- 6.1.4. Others
- 6.2. Market Analysis, Insights and Forecast - by Transmission and Distribution
- 6.3. Market Analysis, Insights and Forecast - by Geogrpahy
- 6.3.1. United Arab Emirates
- 6.3.2. Saudi Arabia
- 6.3.3. Egypt
- 6.3.4. Jordan
- 6.3.5. Rest of Middle-East and Africa
- 6.1. Market Analysis, Insights and Forecast - by Generation - Source
- 7. South America MEA Power Industry Analysis, Insights and Forecast, 2019-2031
- 7.1. Market Analysis, Insights and Forecast - by Generation - Source
- 7.1.1. Thermal
- 7.1.2. Renewable
- 7.1.3. Hydro
- 7.1.4. Others
- 7.2. Market Analysis, Insights and Forecast - by Transmission and Distribution
- 7.3. Market Analysis, Insights and Forecast - by Geogrpahy
- 7.3.1. United Arab Emirates
- 7.3.2. Saudi Arabia
- 7.3.3. Egypt
- 7.3.4. Jordan
- 7.3.5. Rest of Middle-East and Africa
- 7.1. Market Analysis, Insights and Forecast - by Generation - Source
- 8. Europe MEA Power Industry Analysis, Insights and Forecast, 2019-2031
- 8.1. Market Analysis, Insights and Forecast - by Generation - Source
- 8.1.1. Thermal
- 8.1.2. Renewable
- 8.1.3. Hydro
- 8.1.4. Others
- 8.2. Market Analysis, Insights and Forecast - by Transmission and Distribution
- 8.3. Market Analysis, Insights and Forecast - by Geogrpahy
- 8.3.1. United Arab Emirates
- 8.3.2. Saudi Arabia
- 8.3.3. Egypt
- 8.3.4. Jordan
- 8.3.5. Rest of Middle-East and Africa
- 8.1. Market Analysis, Insights and Forecast - by Generation - Source
- 9. Middle East & Africa MEA Power Industry Analysis, Insights and Forecast, 2019-2031
- 9.1. Market Analysis, Insights and Forecast - by Generation - Source
- 9.1.1. Thermal
- 9.1.2. Renewable
- 9.1.3. Hydro
- 9.1.4. Others
- 9.2. Market Analysis, Insights and Forecast - by Transmission and Distribution
- 9.3. Market Analysis, Insights and Forecast - by Geogrpahy
- 9.3.1. United Arab Emirates
- 9.3.2. Saudi Arabia
- 9.3.3. Egypt
- 9.3.4. Jordan
- 9.3.5. Rest of Middle-East and Africa
- 9.1. Market Analysis, Insights and Forecast - by Generation - Source
- 10. Asia Pacific MEA Power Industry Analysis, Insights and Forecast, 2019-2031
- 10.1. Market Analysis, Insights and Forecast - by Generation - Source
- 10.1.1. Thermal
- 10.1.2. Renewable
- 10.1.3. Hydro
- 10.1.4. Others
- 10.2. Market Analysis, Insights and Forecast - by Transmission and Distribution
- 10.3. Market Analysis, Insights and Forecast - by Geogrpahy
- 10.3.1. United Arab Emirates
- 10.3.2. Saudi Arabia
- 10.3.3. Egypt
- 10.3.4. Jordan
- 10.3.5. Rest of Middle-East and Africa
- 10.1. Market Analysis, Insights and Forecast - by Generation - Source
- 11. North America MEA Power Industry Analysis, Insights and Forecast, 2019-2031
- 11.1. Market Analysis, Insights and Forecast - By Country/Sub-region
- 11.1.1 United States
- 11.1.2 Canada
- 11.1.3 Mexico
- 12. Europe MEA Power Industry Analysis, Insights and Forecast, 2019-2031
- 12.1. Market Analysis, Insights and Forecast - By Country/Sub-region
- 12.1.1 Germany
- 12.1.2 United Kingdom
- 12.1.3 France
- 12.1.4 Spain
- 12.1.5 Italy
- 12.1.6 Spain
- 12.1.7 Belgium
- 12.1.8 Netherland
- 12.1.9 Nordics
- 12.1.10 Rest of Europe
- 13. Asia Pacific MEA Power Industry Analysis, Insights and Forecast, 2019-2031
- 13.1. Market Analysis, Insights and Forecast - By Country/Sub-region
- 13.1.1 China
- 13.1.2 Japan
- 13.1.3 India
- 13.1.4 South Korea
- 13.1.5 Southeast Asia
- 13.1.6 Australia
- 13.1.7 Indonesia
- 13.1.8 Phillipes
- 13.1.9 Singapore
- 13.1.10 Thailandc
- 13.1.11 Rest of Asia Pacific
- 14. South America MEA Power Industry Analysis, Insights and Forecast, 2019-2031
- 14.1. Market Analysis, Insights and Forecast - By Country/Sub-region
- 14.1.1 Brazil
- 14.1.2 Argentina
- 14.1.3 Peru
- 14.1.4 Chile
- 14.1.5 Colombia
- 14.1.6 Ecuador
- 14.1.7 Venezuela
- 14.1.8 Rest of South America
- 15. MEA MEA Power Industry Analysis, Insights and Forecast, 2019-2031
- 15.1. Market Analysis, Insights and Forecast - By Country/Sub-region
- 15.1.1 United Arab Emirates
- 15.1.2 Saudi Arabia
- 15.1.3 South Africa
- 15.1.4 Rest of Middle East and Africa
- 16. Competitive Analysis
- 16.1. Global Market Share Analysis 2024
- 16.2. Company Profiles
- 16.2.1 General Electric Company
- 16.2.1.1. Overview
- 16.2.1.2. Products
- 16.2.1.3. SWOT Analysis
- 16.2.1.4. Recent Developments
- 16.2.1.5. Financials (Based on Availability)
- 16.2.2 JinkoSolar Holding Co Ltd
- 16.2.2.1. Overview
- 16.2.2.2. Products
- 16.2.2.3. SWOT Analysis
- 16.2.2.4. Recent Developments
- 16.2.2.5. Financials (Based on Availability)
- 16.2.3 First Solar Inc
- 16.2.3.1. Overview
- 16.2.3.2. Products
- 16.2.3.3. SWOT Analysis
- 16.2.3.4. Recent Developments
- 16.2.3.5. Financials (Based on Availability)
- 16.2.4 Enerwhere Sustainable Energy DMCC
- 16.2.4.1. Overview
- 16.2.4.2. Products
- 16.2.4.3. SWOT Analysis
- 16.2.4.4. Recent Developments
- 16.2.4.5. Financials (Based on Availability)
- 16.2.5 Saudi Electricity Company
- 16.2.5.1. Overview
- 16.2.5.2. Products
- 16.2.5.3. SWOT Analysis
- 16.2.5.4. Recent Developments
- 16.2.5.5. Financials (Based on Availability)
- 16.2.6 Juwi Solar Inc
- 16.2.6.1. Overview
- 16.2.6.2. Products
- 16.2.6.3. SWOT Analysis
- 16.2.6.4. Recent Developments
- 16.2.6.5. Financials (Based on Availability)
- 16.2.7 Eskom Holdings SOC Ltd
- 16.2.7.1. Overview
- 16.2.7.2. Products
- 16.2.7.3. SWOT Analysis
- 16.2.7.4. Recent Developments
- 16.2.7.5. Financials (Based on Availability)
- 16.2.8 Wuxi Suntech Power Co Ltd
- 16.2.8.1. Overview
- 16.2.8.2. Products
- 16.2.8.3. SWOT Analysis
- 16.2.8.4. Recent Developments
- 16.2.8.5. Financials (Based on Availability)
- 16.2.9 Dubai Electricity & Water Authority
- 16.2.9.1. Overview
- 16.2.9.2. Products
- 16.2.9.3. SWOT Analysis
- 16.2.9.4. Recent Developments
- 16.2.9.5. Financials (Based on Availability)
- 16.2.10 ACWA POWER BARKA SAOG
- 16.2.10.1. Overview
- 16.2.10.2. Products
- 16.2.10.3. SWOT Analysis
- 16.2.10.4. Recent Developments
- 16.2.10.5. Financials (Based on Availability)
- 16.2.11 Siemens AG
- 16.2.11.1. Overview
- 16.2.11.2. Products
- 16.2.11.3. SWOT Analysis
- 16.2.11.4. Recent Developments
- 16.2.11.5. Financials (Based on Availability)
- 16.2.12 Canadian Solar Inc
- 16.2.12.1. Overview
- 16.2.12.2. Products
- 16.2.12.3. SWOT Analysis
- 16.2.12.4. Recent Developments
- 16.2.12.5. Financials (Based on Availability)
- 16.2.13 AGE Technologies JHB (Pty) Limited
- 16.2.13.1. Overview
- 16.2.13.2. Products
- 16.2.13.3. SWOT Analysis
- 16.2.13.4. Recent Developments
- 16.2.13.5. Financials (Based on Availability)
- 16.2.1 General Electric Company
List of Figures
- Figure 1: Global MEA Power Industry Revenue Breakdown (Million, %) by Region 2024 & 2032
- Figure 2: Global MEA Power Industry Volume Breakdown (Gigawatte, %) by Region 2024 & 2032
- Figure 3: North America MEA Power Industry Revenue (Million), by Country 2024 & 2032
- Figure 4: North America MEA Power Industry Volume (Gigawatte), by Country 2024 & 2032
- Figure 5: North America MEA Power Industry Revenue Share (%), by Country 2024 & 2032
- Figure 6: North America MEA Power Industry Volume Share (%), by Country 2024 & 2032
- Figure 7: Europe MEA Power Industry Revenue (Million), by Country 2024 & 2032
- Figure 8: Europe MEA Power Industry Volume (Gigawatte), by Country 2024 & 2032
- Figure 9: Europe MEA Power Industry Revenue Share (%), by Country 2024 & 2032
- Figure 10: Europe MEA Power Industry Volume Share (%), by Country 2024 & 2032
- Figure 11: Asia Pacific MEA Power Industry Revenue (Million), by Country 2024 & 2032
- Figure 12: Asia Pacific MEA Power Industry Volume (Gigawatte), by Country 2024 & 2032
- Figure 13: Asia Pacific MEA Power Industry Revenue Share (%), by Country 2024 & 2032
- Figure 14: Asia Pacific MEA Power Industry Volume Share (%), by Country 2024 & 2032
- Figure 15: South America MEA Power Industry Revenue (Million), by Country 2024 & 2032
- Figure 16: South America MEA Power Industry Volume (Gigawatte), by Country 2024 & 2032
- Figure 17: South America MEA Power Industry Revenue Share (%), by Country 2024 & 2032
- Figure 18: South America MEA Power Industry Volume Share (%), by Country 2024 & 2032
- Figure 19: MEA MEA Power Industry Revenue (Million), by Country 2024 & 2032
- Figure 20: MEA MEA Power Industry Volume (Gigawatte), by Country 2024 & 2032
- Figure 21: MEA MEA Power Industry Revenue Share (%), by Country 2024 & 2032
- Figure 22: MEA MEA Power Industry Volume Share (%), by Country 2024 & 2032
- Figure 23: North America MEA Power Industry Revenue (Million), by Generation - Source 2024 & 2032
- Figure 24: North America MEA Power Industry Volume (Gigawatte), by Generation - Source 2024 & 2032
- Figure 25: North America MEA Power Industry Revenue Share (%), by Generation - Source 2024 & 2032
- Figure 26: North America MEA Power Industry Volume Share (%), by Generation - Source 2024 & 2032
- Figure 27: North America MEA Power Industry Revenue (Million), by Transmission and Distribution 2024 & 2032
- Figure 28: North America MEA Power Industry Volume (Gigawatte), by Transmission and Distribution 2024 & 2032
- Figure 29: North America MEA Power Industry Revenue Share (%), by Transmission and Distribution 2024 & 2032
- Figure 30: North America MEA Power Industry Volume Share (%), by Transmission and Distribution 2024 & 2032
- Figure 31: North America MEA Power Industry Revenue (Million), by Geogrpahy 2024 & 2032
- Figure 32: North America MEA Power Industry Volume (Gigawatte), by Geogrpahy 2024 & 2032
- Figure 33: North America MEA Power Industry Revenue Share (%), by Geogrpahy 2024 & 2032
- Figure 34: North America MEA Power Industry Volume Share (%), by Geogrpahy 2024 & 2032
- Figure 35: North America MEA Power Industry Revenue (Million), by Country 2024 & 2032
- Figure 36: North America MEA Power Industry Volume (Gigawatte), by Country 2024 & 2032
- Figure 37: North America MEA Power Industry Revenue Share (%), by Country 2024 & 2032
- Figure 38: North America MEA Power Industry Volume Share (%), by Country 2024 & 2032
- Figure 39: South America MEA Power Industry Revenue (Million), by Generation - Source 2024 & 2032
- Figure 40: South America MEA Power Industry Volume (Gigawatte), by Generation - Source 2024 & 2032
- Figure 41: South America MEA Power Industry Revenue Share (%), by Generation - Source 2024 & 2032
- Figure 42: South America MEA Power Industry Volume Share (%), by Generation - Source 2024 & 2032
- Figure 43: South America MEA Power Industry Revenue (Million), by Transmission and Distribution 2024 & 2032
- Figure 44: South America MEA Power Industry Volume (Gigawatte), by Transmission and Distribution 2024 & 2032
- Figure 45: South America MEA Power Industry Revenue Share (%), by Transmission and Distribution 2024 & 2032
- Figure 46: South America MEA Power Industry Volume Share (%), by Transmission and Distribution 2024 & 2032
- Figure 47: South America MEA Power Industry Revenue (Million), by Geogrpahy 2024 & 2032
- Figure 48: South America MEA Power Industry Volume (Gigawatte), by Geogrpahy 2024 & 2032
- Figure 49: South America MEA Power Industry Revenue Share (%), by Geogrpahy 2024 & 2032
- Figure 50: South America MEA Power Industry Volume Share (%), by Geogrpahy 2024 & 2032
- Figure 51: South America MEA Power Industry Revenue (Million), by Country 2024 & 2032
- Figure 52: South America MEA Power Industry Volume (Gigawatte), by Country 2024 & 2032
- Figure 53: South America MEA Power Industry Revenue Share (%), by Country 2024 & 2032
- Figure 54: South America MEA Power Industry Volume Share (%), by Country 2024 & 2032
- Figure 55: Europe MEA Power Industry Revenue (Million), by Generation - Source 2024 & 2032
- Figure 56: Europe MEA Power Industry Volume (Gigawatte), by Generation - Source 2024 & 2032
- Figure 57: Europe MEA Power Industry Revenue Share (%), by Generation - Source 2024 & 2032
- Figure 58: Europe MEA Power Industry Volume Share (%), by Generation - Source 2024 & 2032
- Figure 59: Europe MEA Power Industry Revenue (Million), by Transmission and Distribution 2024 & 2032
- Figure 60: Europe MEA Power Industry Volume (Gigawatte), by Transmission and Distribution 2024 & 2032
- Figure 61: Europe MEA Power Industry Revenue Share (%), by Transmission and Distribution 2024 & 2032
- Figure 62: Europe MEA Power Industry Volume Share (%), by Transmission and Distribution 2024 & 2032
- Figure 63: Europe MEA Power Industry Revenue (Million), by Geogrpahy 2024 & 2032
- Figure 64: Europe MEA Power Industry Volume (Gigawatte), by Geogrpahy 2024 & 2032
- Figure 65: Europe MEA Power Industry Revenue Share (%), by Geogrpahy 2024 & 2032
- Figure 66: Europe MEA Power Industry Volume Share (%), by Geogrpahy 2024 & 2032
- Figure 67: Europe MEA Power Industry Revenue (Million), by Country 2024 & 2032
- Figure 68: Europe MEA Power Industry Volume (Gigawatte), by Country 2024 & 2032
- Figure 69: Europe MEA Power Industry Revenue Share (%), by Country 2024 & 2032
- Figure 70: Europe MEA Power Industry Volume Share (%), by Country 2024 & 2032
- Figure 71: Middle East & Africa MEA Power Industry Revenue (Million), by Generation - Source 2024 & 2032
- Figure 72: Middle East & Africa MEA Power Industry Volume (Gigawatte), by Generation - Source 2024 & 2032
- Figure 73: Middle East & Africa MEA Power Industry Revenue Share (%), by Generation - Source 2024 & 2032
- Figure 74: Middle East & Africa MEA Power Industry Volume Share (%), by Generation - Source 2024 & 2032
- Figure 75: Middle East & Africa MEA Power Industry Revenue (Million), by Transmission and Distribution 2024 & 2032
- Figure 76: Middle East & Africa MEA Power Industry Volume (Gigawatte), by Transmission and Distribution 2024 & 2032
- Figure 77: Middle East & Africa MEA Power Industry Revenue Share (%), by Transmission and Distribution 2024 & 2032
- Figure 78: Middle East & Africa MEA Power Industry Volume Share (%), by Transmission and Distribution 2024 & 2032
- Figure 79: Middle East & Africa MEA Power Industry Revenue (Million), by Geogrpahy 2024 & 2032
- Figure 80: Middle East & Africa MEA Power Industry Volume (Gigawatte), by Geogrpahy 2024 & 2032
- Figure 81: Middle East & Africa MEA Power Industry Revenue Share (%), by Geogrpahy 2024 & 2032
- Figure 82: Middle East & Africa MEA Power Industry Volume Share (%), by Geogrpahy 2024 & 2032
- Figure 83: Middle East & Africa MEA Power Industry Revenue (Million), by Country 2024 & 2032
- Figure 84: Middle East & Africa MEA Power Industry Volume (Gigawatte), by Country 2024 & 2032
- Figure 85: Middle East & Africa MEA Power Industry Revenue Share (%), by Country 2024 & 2032
- Figure 86: Middle East & Africa MEA Power Industry Volume Share (%), by Country 2024 & 2032
- Figure 87: Asia Pacific MEA Power Industry Revenue (Million), by Generation - Source 2024 & 2032
- Figure 88: Asia Pacific MEA Power Industry Volume (Gigawatte), by Generation - Source 2024 & 2032
- Figure 89: Asia Pacific MEA Power Industry Revenue Share (%), by Generation - Source 2024 & 2032
- Figure 90: Asia Pacific MEA Power Industry Volume Share (%), by Generation - Source 2024 & 2032
- Figure 91: Asia Pacific MEA Power Industry Revenue (Million), by Transmission and Distribution 2024 & 2032
- Figure 92: Asia Pacific MEA Power Industry Volume (Gigawatte), by Transmission and Distribution 2024 & 2032
- Figure 93: Asia Pacific MEA Power Industry Revenue Share (%), by Transmission and Distribution 2024 & 2032
- Figure 94: Asia Pacific MEA Power Industry Volume Share (%), by Transmission and Distribution 2024 & 2032
- Figure 95: Asia Pacific MEA Power Industry Revenue (Million), by Geogrpahy 2024 & 2032
- Figure 96: Asia Pacific MEA Power Industry Volume (Gigawatte), by Geogrpahy 2024 & 2032
- Figure 97: Asia Pacific MEA Power Industry Revenue Share (%), by Geogrpahy 2024 & 2032
- Figure 98: Asia Pacific MEA Power Industry Volume Share (%), by Geogrpahy 2024 & 2032
- Figure 99: Asia Pacific MEA Power Industry Revenue (Million), by Country 2024 & 2032
- Figure 100: Asia Pacific MEA Power Industry Volume (Gigawatte), by Country 2024 & 2032
- Figure 101: Asia Pacific MEA Power Industry Revenue Share (%), by Country 2024 & 2032
- Figure 102: Asia Pacific MEA Power Industry Volume Share (%), by Country 2024 & 2032
List of Tables
- Table 1: Global MEA Power Industry Revenue Million Forecast, by Region 2019 & 2032
- Table 2: Global MEA Power Industry Volume Gigawatte Forecast, by Region 2019 & 2032
- Table 3: Global MEA Power Industry Revenue Million Forecast, by Generation - Source 2019 & 2032
- Table 4: Global MEA Power Industry Volume Gigawatte Forecast, by Generation - Source 2019 & 2032
- Table 5: Global MEA Power Industry Revenue Million Forecast, by Transmission and Distribution 2019 & 2032
- Table 6: Global MEA Power Industry Volume Gigawatte Forecast, by Transmission and Distribution 2019 & 2032
- Table 7: Global MEA Power Industry Revenue Million Forecast, by Geogrpahy 2019 & 2032
- Table 8: Global MEA Power Industry Volume Gigawatte Forecast, by Geogrpahy 2019 & 2032
- Table 9: Global MEA Power Industry Revenue Million Forecast, by Region 2019 & 2032
- Table 10: Global MEA Power Industry Volume Gigawatte Forecast, by Region 2019 & 2032
- Table 11: Global MEA Power Industry Revenue Million Forecast, by Country 2019 & 2032
- Table 12: Global MEA Power Industry Volume Gigawatte Forecast, by Country 2019 & 2032
- Table 13: United States MEA Power Industry Revenue (Million) Forecast, by Application 2019 & 2032
- Table 14: United States MEA Power Industry Volume (Gigawatte) Forecast, by Application 2019 & 2032
- Table 15: Canada MEA Power Industry Revenue (Million) Forecast, by Application 2019 & 2032
- Table 16: Canada MEA Power Industry Volume (Gigawatte) Forecast, by Application 2019 & 2032
- Table 17: Mexico MEA Power Industry Revenue (Million) Forecast, by Application 2019 & 2032
- Table 18: Mexico MEA Power Industry Volume (Gigawatte) Forecast, by Application 2019 & 2032
- Table 19: Global MEA Power Industry Revenue Million Forecast, by Country 2019 & 2032
- Table 20: Global MEA Power Industry Volume Gigawatte Forecast, by Country 2019 & 2032
- Table 21: Germany MEA Power Industry Revenue (Million) Forecast, by Application 2019 & 2032
- Table 22: Germany MEA Power Industry Volume (Gigawatte) Forecast, by Application 2019 & 2032
- Table 23: United Kingdom MEA Power Industry Revenue (Million) Forecast, by Application 2019 & 2032
- Table 24: United Kingdom MEA Power Industry Volume (Gigawatte) Forecast, by Application 2019 & 2032
- Table 25: France MEA Power Industry Revenue (Million) Forecast, by Application 2019 & 2032
- Table 26: France MEA Power Industry Volume (Gigawatte) Forecast, by Application 2019 & 2032
- Table 27: Spain MEA Power Industry Revenue (Million) Forecast, by Application 2019 & 2032
- Table 28: Spain MEA Power Industry Volume (Gigawatte) Forecast, by Application 2019 & 2032
- Table 29: Italy MEA Power Industry Revenue (Million) Forecast, by Application 2019 & 2032
- Table 30: Italy MEA Power Industry Volume (Gigawatte) Forecast, by Application 2019 & 2032
- Table 31: Spain MEA Power Industry Revenue (Million) Forecast, by Application 2019 & 2032
- Table 32: Spain MEA Power Industry Volume (Gigawatte) Forecast, by Application 2019 & 2032
- Table 33: Belgium MEA Power Industry Revenue (Million) Forecast, by Application 2019 & 2032
- Table 34: Belgium MEA Power Industry Volume (Gigawatte) Forecast, by Application 2019 & 2032
- Table 35: Netherland MEA Power Industry Revenue (Million) Forecast, by Application 2019 & 2032
- Table 36: Netherland MEA Power Industry Volume (Gigawatte) Forecast, by Application 2019 & 2032
- Table 37: Nordics MEA Power Industry Revenue (Million) Forecast, by Application 2019 & 2032
- Table 38: Nordics MEA Power Industry Volume (Gigawatte) Forecast, by Application 2019 & 2032
- Table 39: Rest of Europe MEA Power Industry Revenue (Million) Forecast, by Application 2019 & 2032
- Table 40: Rest of Europe MEA Power Industry Volume (Gigawatte) Forecast, by Application 2019 & 2032
- Table 41: Global MEA Power Industry Revenue Million Forecast, by Country 2019 & 2032
- Table 42: Global MEA Power Industry Volume Gigawatte Forecast, by Country 2019 & 2032
- Table 43: China MEA Power Industry Revenue (Million) Forecast, by Application 2019 & 2032
- Table 44: China MEA Power Industry Volume (Gigawatte) Forecast, by Application 2019 & 2032
- Table 45: Japan MEA Power Industry Revenue (Million) Forecast, by Application 2019 & 2032
- Table 46: Japan MEA Power Industry Volume (Gigawatte) Forecast, by Application 2019 & 2032
- Table 47: India MEA Power Industry Revenue (Million) Forecast, by Application 2019 & 2032
- Table 48: India MEA Power Industry Volume (Gigawatte) Forecast, by Application 2019 & 2032
- Table 49: South Korea MEA Power Industry Revenue (Million) Forecast, by Application 2019 & 2032
- Table 50: South Korea MEA Power Industry Volume (Gigawatte) Forecast, by Application 2019 & 2032
- Table 51: Southeast Asia MEA Power Industry Revenue (Million) Forecast, by Application 2019 & 2032
- Table 52: Southeast Asia MEA Power Industry Volume (Gigawatte) Forecast, by Application 2019 & 2032
- Table 53: Australia MEA Power Industry Revenue (Million) Forecast, by Application 2019 & 2032
- Table 54: Australia MEA Power Industry Volume (Gigawatte) Forecast, by Application 2019 & 2032
- Table 55: Indonesia MEA Power Industry Revenue (Million) Forecast, by Application 2019 & 2032
- Table 56: Indonesia MEA Power Industry Volume (Gigawatte) Forecast, by Application 2019 & 2032
- Table 57: Phillipes MEA Power Industry Revenue (Million) Forecast, by Application 2019 & 2032
- Table 58: Phillipes MEA Power Industry Volume (Gigawatte) Forecast, by Application 2019 & 2032
- Table 59: Singapore MEA Power Industry Revenue (Million) Forecast, by Application 2019 & 2032
- Table 60: Singapore MEA Power Industry Volume (Gigawatte) Forecast, by Application 2019 & 2032
- Table 61: Thailandc MEA Power Industry Revenue (Million) Forecast, by Application 2019 & 2032
- Table 62: Thailandc MEA Power Industry Volume (Gigawatte) Forecast, by Application 2019 & 2032
- Table 63: Rest of Asia Pacific MEA Power Industry Revenue (Million) Forecast, by Application 2019 & 2032
- Table 64: Rest of Asia Pacific MEA Power Industry Volume (Gigawatte) Forecast, by Application 2019 & 2032
- Table 65: Global MEA Power Industry Revenue Million Forecast, by Country 2019 & 2032
- Table 66: Global MEA Power Industry Volume Gigawatte Forecast, by Country 2019 & 2032
- Table 67: Brazil MEA Power Industry Revenue (Million) Forecast, by Application 2019 & 2032
- Table 68: Brazil MEA Power Industry Volume (Gigawatte) Forecast, by Application 2019 & 2032
- Table 69: Argentina MEA Power Industry Revenue (Million) Forecast, by Application 2019 & 2032
- Table 70: Argentina MEA Power Industry Volume (Gigawatte) Forecast, by Application 2019 & 2032
- Table 71: Peru MEA Power Industry Revenue (Million) Forecast, by Application 2019 & 2032
- Table 72: Peru MEA Power Industry Volume (Gigawatte) Forecast, by Application 2019 & 2032
- Table 73: Chile MEA Power Industry Revenue (Million) Forecast, by Application 2019 & 2032
- Table 74: Chile MEA Power Industry Volume (Gigawatte) Forecast, by Application 2019 & 2032
- Table 75: Colombia MEA Power Industry Revenue (Million) Forecast, by Application 2019 & 2032
- Table 76: Colombia MEA Power Industry Volume (Gigawatte) Forecast, by Application 2019 & 2032
- Table 77: Ecuador MEA Power Industry Revenue (Million) Forecast, by Application 2019 & 2032
- Table 78: Ecuador MEA Power Industry Volume (Gigawatte) Forecast, by Application 2019 & 2032
- Table 79: Venezuela MEA Power Industry Revenue (Million) Forecast, by Application 2019 & 2032
- Table 80: Venezuela MEA Power Industry Volume (Gigawatte) Forecast, by Application 2019 & 2032
- Table 81: Rest of South America MEA Power Industry Revenue (Million) Forecast, by Application 2019 & 2032
- Table 82: Rest of South America MEA Power Industry Volume (Gigawatte) Forecast, by Application 2019 & 2032
- Table 83: Global MEA Power Industry Revenue Million Forecast, by Country 2019 & 2032
- Table 84: Global MEA Power Industry Volume Gigawatte Forecast, by Country 2019 & 2032
- Table 85: United Arab Emirates MEA Power Industry Revenue (Million) Forecast, by Application 2019 & 2032
- Table 86: United Arab Emirates MEA Power Industry Volume (Gigawatte) Forecast, by Application 2019 & 2032
- Table 87: Saudi Arabia MEA Power Industry Revenue (Million) Forecast, by Application 2019 & 2032
- Table 88: Saudi Arabia MEA Power Industry Volume (Gigawatte) Forecast, by Application 2019 & 2032
- Table 89: South Africa MEA Power Industry Revenue (Million) Forecast, by Application 2019 & 2032
- Table 90: South Africa MEA Power Industry Volume (Gigawatte) Forecast, by Application 2019 & 2032
- Table 91: Rest of Middle East and Africa MEA Power Industry Revenue (Million) Forecast, by Application 2019 & 2032
- Table 92: Rest of Middle East and Africa MEA Power Industry Volume (Gigawatte) Forecast, by Application 2019 & 2032
- Table 93: Global MEA Power Industry Revenue Million Forecast, by Generation - Source 2019 & 2032
- Table 94: Global MEA Power Industry Volume Gigawatte Forecast, by Generation - Source 2019 & 2032
- Table 95: Global MEA Power Industry Revenue Million Forecast, by Transmission and Distribution 2019 & 2032
- Table 96: Global MEA Power Industry Volume Gigawatte Forecast, by Transmission and Distribution 2019 & 2032
- Table 97: Global MEA Power Industry Revenue Million Forecast, by Geogrpahy 2019 & 2032
- Table 98: Global MEA Power Industry Volume Gigawatte Forecast, by Geogrpahy 2019 & 2032
- Table 99: Global MEA Power Industry Revenue Million Forecast, by Country 2019 & 2032
- Table 100: Global MEA Power Industry Volume Gigawatte Forecast, by Country 2019 & 2032
- Table 101: United States MEA Power Industry Revenue (Million) Forecast, by Application 2019 & 2032
- Table 102: United States MEA Power Industry Volume (Gigawatte) Forecast, by Application 2019 & 2032
- Table 103: Canada MEA Power Industry Revenue (Million) Forecast, by Application 2019 & 2032
- Table 104: Canada MEA Power Industry Volume (Gigawatte) Forecast, by Application 2019 & 2032
- Table 105: Mexico MEA Power Industry Revenue (Million) Forecast, by Application 2019 & 2032
- Table 106: Mexico MEA Power Industry Volume (Gigawatte) Forecast, by Application 2019 & 2032
- Table 107: Global MEA Power Industry Revenue Million Forecast, by Generation - Source 2019 & 2032
- Table 108: Global MEA Power Industry Volume Gigawatte Forecast, by Generation - Source 2019 & 2032
- Table 109: Global MEA Power Industry Revenue Million Forecast, by Transmission and Distribution 2019 & 2032
- Table 110: Global MEA Power Industry Volume Gigawatte Forecast, by Transmission and Distribution 2019 & 2032
- Table 111: Global MEA Power Industry Revenue Million Forecast, by Geogrpahy 2019 & 2032
- Table 112: Global MEA Power Industry Volume Gigawatte Forecast, by Geogrpahy 2019 & 2032
- Table 113: Global MEA Power Industry Revenue Million Forecast, by Country 2019 & 2032
- Table 114: Global MEA Power Industry Volume Gigawatte Forecast, by Country 2019 & 2032
- Table 115: Brazil MEA Power Industry Revenue (Million) Forecast, by Application 2019 & 2032
- Table 116: Brazil MEA Power Industry Volume (Gigawatte) Forecast, by Application 2019 & 2032
- Table 117: Argentina MEA Power Industry Revenue (Million) Forecast, by Application 2019 & 2032
- Table 118: Argentina MEA Power Industry Volume (Gigawatte) Forecast, by Application 2019 & 2032
- Table 119: Rest of South America MEA Power Industry Revenue (Million) Forecast, by Application 2019 & 2032
- Table 120: Rest of South America MEA Power Industry Volume (Gigawatte) Forecast, by Application 2019 & 2032
- Table 121: Global MEA Power Industry Revenue Million Forecast, by Generation - Source 2019 & 2032
- Table 122: Global MEA Power Industry Volume Gigawatte Forecast, by Generation - Source 2019 & 2032
- Table 123: Global MEA Power Industry Revenue Million Forecast, by Transmission and Distribution 2019 & 2032
- Table 124: Global MEA Power Industry Volume Gigawatte Forecast, by Transmission and Distribution 2019 & 2032
- Table 125: Global MEA Power Industry Revenue Million Forecast, by Geogrpahy 2019 & 2032
- Table 126: Global MEA Power Industry Volume Gigawatte Forecast, by Geogrpahy 2019 & 2032
- Table 127: Global MEA Power Industry Revenue Million Forecast, by Country 2019 & 2032
- Table 128: Global MEA Power Industry Volume Gigawatte Forecast, by Country 2019 & 2032
- Table 129: United Kingdom MEA Power Industry Revenue (Million) Forecast, by Application 2019 & 2032
- Table 130: United Kingdom MEA Power Industry Volume (Gigawatte) Forecast, by Application 2019 & 2032
- Table 131: Germany MEA Power Industry Revenue (Million) Forecast, by Application 2019 & 2032
- Table 132: Germany MEA Power Industry Volume (Gigawatte) Forecast, by Application 2019 & 2032
- Table 133: France MEA Power Industry Revenue (Million) Forecast, by Application 2019 & 2032
- Table 134: France MEA Power Industry Volume (Gigawatte) Forecast, by Application 2019 & 2032
- Table 135: Italy MEA Power Industry Revenue (Million) Forecast, by Application 2019 & 2032
- Table 136: Italy MEA Power Industry Volume (Gigawatte) Forecast, by Application 2019 & 2032
- Table 137: Spain MEA Power Industry Revenue (Million) Forecast, by Application 2019 & 2032
- Table 138: Spain MEA Power Industry Volume (Gigawatte) Forecast, by Application 2019 & 2032
- Table 139: Russia MEA Power Industry Revenue (Million) Forecast, by Application 2019 & 2032
- Table 140: Russia MEA Power Industry Volume (Gigawatte) Forecast, by Application 2019 & 2032
- Table 141: Benelux MEA Power Industry Revenue (Million) Forecast, by Application 2019 & 2032
- Table 142: Benelux MEA Power Industry Volume (Gigawatte) Forecast, by Application 2019 & 2032
- Table 143: Nordics MEA Power Industry Revenue (Million) Forecast, by Application 2019 & 2032
- Table 144: Nordics MEA Power Industry Volume (Gigawatte) Forecast, by Application 2019 & 2032
- Table 145: Rest of Europe MEA Power Industry Revenue (Million) Forecast, by Application 2019 & 2032
- Table 146: Rest of Europe MEA Power Industry Volume (Gigawatte) Forecast, by Application 2019 & 2032
- Table 147: Global MEA Power Industry Revenue Million Forecast, by Generation - Source 2019 & 2032
- Table 148: Global MEA Power Industry Volume Gigawatte Forecast, by Generation - Source 2019 & 2032
- Table 149: Global MEA Power Industry Revenue Million Forecast, by Transmission and Distribution 2019 & 2032
- Table 150: Global MEA Power Industry Volume Gigawatte Forecast, by Transmission and Distribution 2019 & 2032
- Table 151: Global MEA Power Industry Revenue Million Forecast, by Geogrpahy 2019 & 2032
- Table 152: Global MEA Power Industry Volume Gigawatte Forecast, by Geogrpahy 2019 & 2032
- Table 153: Global MEA Power Industry Revenue Million Forecast, by Country 2019 & 2032
- Table 154: Global MEA Power Industry Volume Gigawatte Forecast, by Country 2019 & 2032
- Table 155: Turkey MEA Power Industry Revenue (Million) Forecast, by Application 2019 & 2032
- Table 156: Turkey MEA Power Industry Volume (Gigawatte) Forecast, by Application 2019 & 2032
- Table 157: Israel MEA Power Industry Revenue (Million) Forecast, by Application 2019 & 2032
- Table 158: Israel MEA Power Industry Volume (Gigawatte) Forecast, by Application 2019 & 2032
- Table 159: GCC MEA Power Industry Revenue (Million) Forecast, by Application 2019 & 2032
- Table 160: GCC MEA Power Industry Volume (Gigawatte) Forecast, by Application 2019 & 2032
- Table 161: North Africa MEA Power Industry Revenue (Million) Forecast, by Application 2019 & 2032
- Table 162: North Africa MEA Power Industry Volume (Gigawatte) Forecast, by Application 2019 & 2032
- Table 163: South Africa MEA Power Industry Revenue (Million) Forecast, by Application 2019 & 2032
- Table 164: South Africa MEA Power Industry Volume (Gigawatte) Forecast, by Application 2019 & 2032
- Table 165: Rest of Middle East & Africa MEA Power Industry Revenue (Million) Forecast, by Application 2019 & 2032
- Table 166: Rest of Middle East & Africa MEA Power Industry Volume (Gigawatte) Forecast, by Application 2019 & 2032
- Table 167: Global MEA Power Industry Revenue Million Forecast, by Generation - Source 2019 & 2032
- Table 168: Global MEA Power Industry Volume Gigawatte Forecast, by Generation - Source 2019 & 2032
- Table 169: Global MEA Power Industry Revenue Million Forecast, by Transmission and Distribution 2019 & 2032
- Table 170: Global MEA Power Industry Volume Gigawatte Forecast, by Transmission and Distribution 2019 & 2032
- Table 171: Global MEA Power Industry Revenue Million Forecast, by Geogrpahy 2019 & 2032
- Table 172: Global MEA Power Industry Volume Gigawatte Forecast, by Geogrpahy 2019 & 2032
- Table 173: Global MEA Power Industry Revenue Million Forecast, by Country 2019 & 2032
- Table 174: Global MEA Power Industry Volume Gigawatte Forecast, by Country 2019 & 2032
- Table 175: China MEA Power Industry Revenue (Million) Forecast, by Application 2019 & 2032
- Table 176: China MEA Power Industry Volume (Gigawatte) Forecast, by Application 2019 & 2032
- Table 177: India MEA Power Industry Revenue (Million) Forecast, by Application 2019 & 2032
- Table 178: India MEA Power Industry Volume (Gigawatte) Forecast, by Application 2019 & 2032
- Table 179: Japan MEA Power Industry Revenue (Million) Forecast, by Application 2019 & 2032
- Table 180: Japan MEA Power Industry Volume (Gigawatte) Forecast, by Application 2019 & 2032
- Table 181: South Korea MEA Power Industry Revenue (Million) Forecast, by Application 2019 & 2032
- Table 182: South Korea MEA Power Industry Volume (Gigawatte) Forecast, by Application 2019 & 2032
- Table 183: ASEAN MEA Power Industry Revenue (Million) Forecast, by Application 2019 & 2032
- Table 184: ASEAN MEA Power Industry Volume (Gigawatte) Forecast, by Application 2019 & 2032
- Table 185: Oceania MEA Power Industry Revenue (Million) Forecast, by Application 2019 & 2032
- Table 186: Oceania MEA Power Industry Volume (Gigawatte) Forecast, by Application 2019 & 2032
- Table 187: Rest of Asia Pacific MEA Power Industry Revenue (Million) Forecast, by Application 2019 & 2032
- Table 188: Rest of Asia Pacific MEA Power Industry Volume (Gigawatte) Forecast, by Application 2019 & 2032
Frequently Asked Questions
1. What is the projected Compound Annual Growth Rate (CAGR) of the MEA Power Industry?
The projected CAGR is approximately > 3.00%.
2. Which companies are prominent players in the MEA Power Industry?
Key companies in the market include General Electric Company, JinkoSolar Holding Co Ltd, First Solar Inc, Enerwhere Sustainable Energy DMCC, Saudi Electricity Company, Juwi Solar Inc, Eskom Holdings SOC Ltd, Wuxi Suntech Power Co Ltd, Dubai Electricity & Water Authority, ACWA POWER BARKA SAOG, Siemens AG, Canadian Solar Inc, AGE Technologies JHB (Pty) Limited.
3. What are the main segments of the MEA Power Industry?
The market segments include Generation - Source, Transmission and Distribution, Geogrpahy.
4. Can you provide details about the market size?
The market size is estimated to be USD XX Million as of 2022.
5. What are some drivers contributing to market growth?
4.; Demand for Solar Photovoltaic Installations4.; Growing Investments.
6. What are the notable trends driving market growth?
Thermal Sources to Dominate the Market.
7. Are there any restraints impacting market growth?
4.; Increasing Wind Energy Installations.
8. Can you provide examples of recent developments in the market?
N/A
9. What pricing options are available for accessing the report?
Pricing options include single-user, multi-user, and enterprise licenses priced at USD 4750, USD 5250, and USD 8750 respectively.
10. Is the market size provided in terms of value or volume?
The market size is provided in terms of value, measured in Million and volume, measured in Gigawatte.
11. Are there any specific market keywords associated with the report?
Yes, the market keyword associated with the report is "MEA Power Industry," which aids in identifying and referencing the specific market segment covered.
12. How do I determine which pricing option suits my needs best?
The pricing options vary based on user requirements and access needs. Individual users may opt for single-user licenses, while businesses requiring broader access may choose multi-user or enterprise licenses for cost-effective access to the report.
13. Are there any additional resources or data provided in the MEA Power Industry report?
While the report offers comprehensive insights, it's advisable to review the specific contents or supplementary materials provided to ascertain if additional resources or data are available.
14. How can I stay updated on further developments or reports in the MEA Power Industry?
To stay informed about further developments, trends, and reports in the MEA Power Industry, consider subscribing to industry newsletters, following relevant companies and organizations, or regularly checking reputable industry news sources and publications.
Methodology
Step 1 - Identification of Relevant Samples Size from Population Database


Step 2 - Approaches for Defining Global Market Size (Value, Volume* & Price*)

Note*: In applicable scenarios
Step 3 - Data Sources
Primary Research
- Web Analytics
- Survey Reports
- Research Institute
- Latest Research Reports
- Opinion Leaders
Secondary Research
- Annual Reports
- White Paper
- Latest Press Release
- Industry Association
- Paid Database
- Investor Presentations

Step 4 - Data Triangulation
Involves using different sources of information in order to increase the validity of a study
These sources are likely to be stakeholders in a program - participants, other researchers, program staff, other community members, and so on.
Then we put all data in single framework & apply various statistical tools to find out the dynamic on the market.
During the analysis stage, feedback from the stakeholder groups would be compared to determine areas of agreement as well as areas of divergence


