
Key Insights
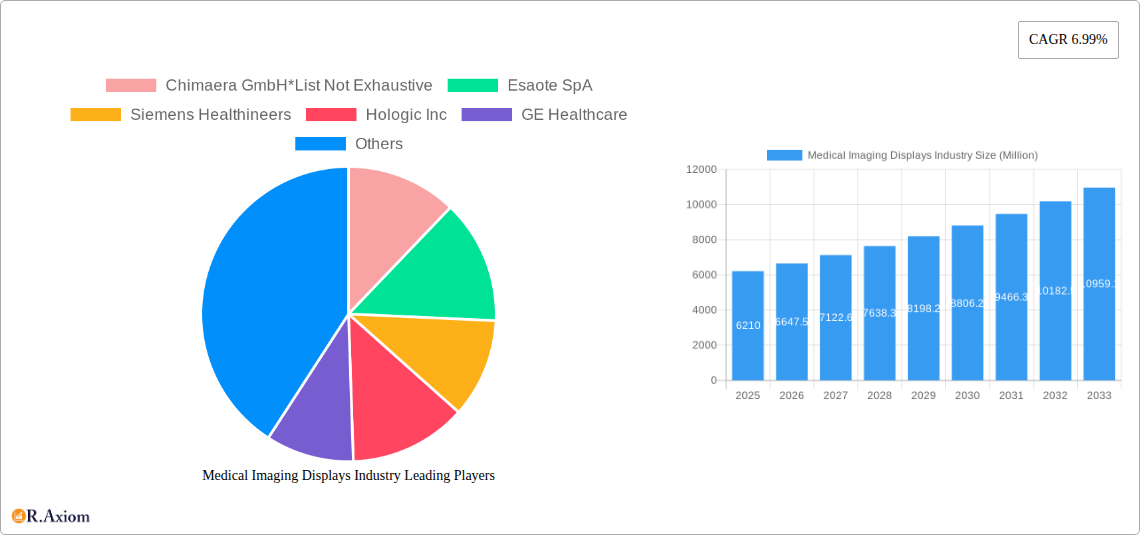
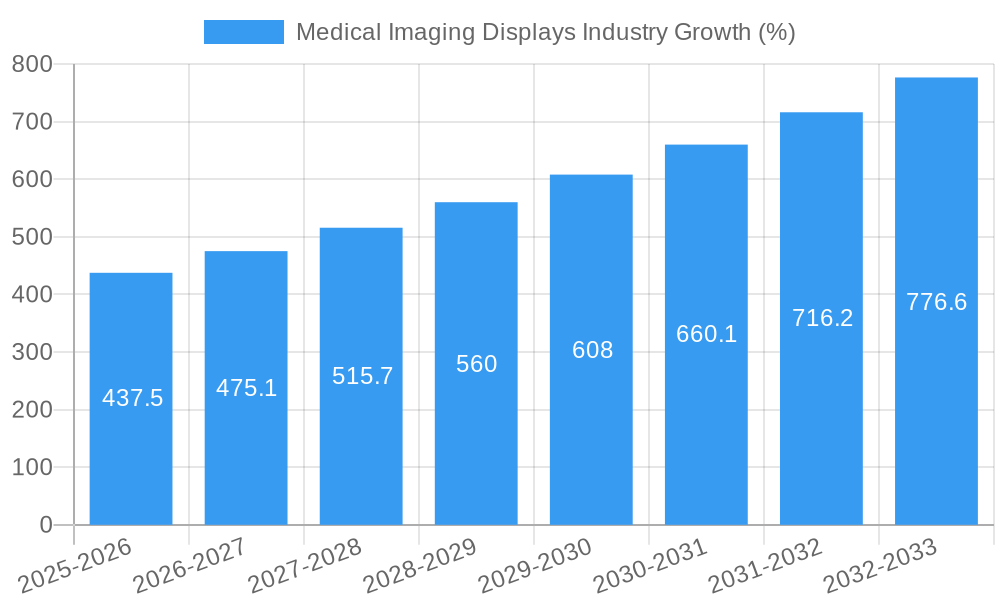
The Medical Imaging Displays market, valued at $6.21 billion in 2025, is projected to experience robust growth, driven by several key factors. Technological advancements in display technologies, such as higher resolutions and improved color accuracy, are enhancing diagnostic capabilities and driving demand. The increasing prevalence of chronic diseases, an aging global population, and the rising adoption of minimally invasive surgical procedures are significantly boosting the need for advanced medical imaging. Furthermore, the ongoing shift towards digitalization within healthcare systems is fueling the demand for efficient and reliable image display solutions, particularly in radiology departments and surgical suites. The market is segmented by component (visualization software, display units, and others), modality (CT, MRI, ultrasound, mammography, and others), and usage mode (thick and thin client workstations), offering diverse growth opportunities across different segments. While the initial investment in advanced display systems might act as a restraint for some smaller healthcare providers, the long-term benefits in terms of improved diagnostic accuracy and operational efficiency are expected to outweigh these costs. Geographic expansion, particularly in developing economies experiencing rapid healthcare infrastructure development, presents significant potential for growth. Competition among established players like Siemens Healthineers, GE Healthcare, and Philips is driving innovation and price competitiveness, benefiting end-users.
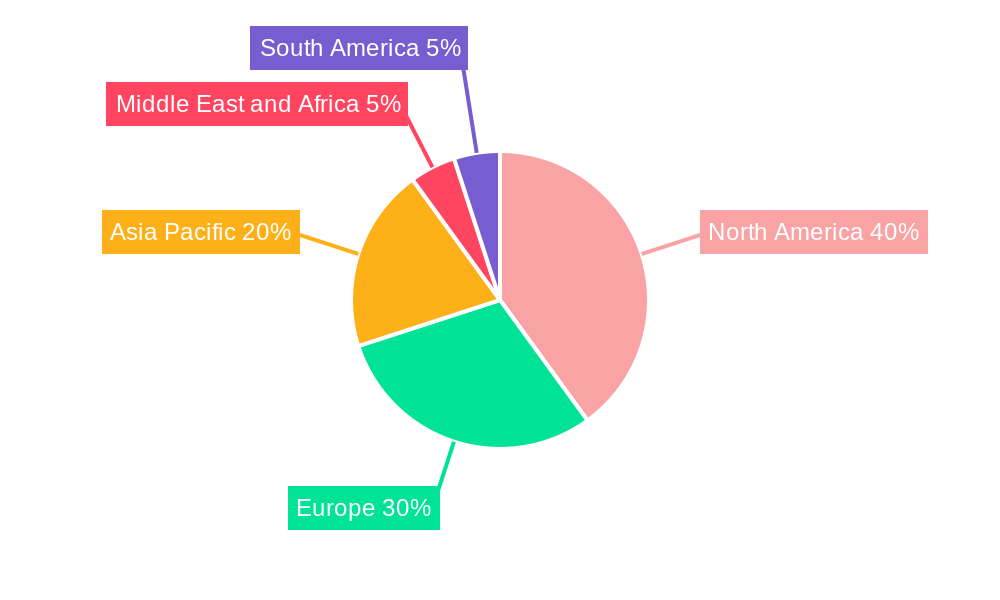
The North American region currently holds a significant market share due to advanced healthcare infrastructure and higher adoption rates of advanced imaging technologies. However, the Asia-Pacific region is poised for significant growth, fueled by expanding healthcare spending and rising demand for improved healthcare services in rapidly developing economies like China and India. Europe continues to be a substantial market, with strong demand across various countries. The market's growth is also influenced by factors such as government initiatives promoting healthcare infrastructure development, increasing investment in research and development of new medical imaging technologies, and the growing adoption of telehealth and remote diagnostics. The forecast period (2025-2033) anticipates sustained growth, primarily driven by the factors mentioned above and the continuous integration of AI and machine learning capabilities into medical imaging systems, further improving diagnostic accuracy and workflow efficiency.
This comprehensive report provides an in-depth analysis of the Medical Imaging Displays industry, offering invaluable insights for stakeholders, investors, and industry professionals. Covering the period 2019-2033, with a focus on 2025, this report meticulously examines market trends, competitive dynamics, and future growth prospects. The report segments the market by component (Visualization Software, Display Units, Others), modality (Computed Tomography (CT), Magnetic Resonance Imaging, Ultrasound, Mammography, Others), and usage mode (Thick Client Workstation, Thin Client Workstation). The report projects a market value of xx Million by 2033, with a CAGR of xx% during the forecast period (2025-2033).
Medical Imaging Displays Industry Market Concentration & Innovation
The Medical Imaging Displays market exhibits a moderately concentrated landscape, with key players holding significant market share. In 2025, the top five companies—Siemens Healthineers, GE Healthcare, Koninklijke Philips N V, Esaote SpA, and Hologic Inc—are estimated to collectively control approximately xx% of the global market. However, the presence of smaller, specialized players like Chimaera GmbH and PaxeraHealth indicates ongoing competition and innovation.
Market concentration is influenced by factors such as R&D investments, technological advancements, and strategic acquisitions. Significant M&A activity in recent years, with deal values totaling approximately xx Million, has further shaped the competitive landscape. These transactions have primarily focused on expanding product portfolios, enhancing technological capabilities, and gaining access to new markets. Regulatory frameworks, including those related to medical device approvals and data privacy, significantly influence market dynamics. The increasing adoption of digital imaging and the emergence of advanced visualization software are key innovation drivers. Furthermore, the market experiences competition from substitute technologies, such as cloud-based image management systems. End-user trends toward improved image quality, workflow efficiency, and cost-effectiveness continue to shape market demands.
- Market Share (2025, Estimated): Top 5 players: xx%
- M&A Deal Value (2019-2024): Approximately xx Million
Medical Imaging Displays Industry Industry Trends & Insights
The Medical Imaging Displays market is experiencing robust growth, driven by several key factors. The rising prevalence of chronic diseases, coupled with an aging global population, is fueling the demand for advanced medical imaging techniques. Technological advancements, such as the development of high-resolution displays with improved ergonomics, are enhancing the quality and efficiency of medical diagnoses. The integration of Artificial Intelligence (AI) and machine learning algorithms into medical imaging workflows is improving diagnostic accuracy and streamlining processes. Furthermore, increasing investments in healthcare infrastructure, particularly in developing economies, are expanding market opportunities. However, the market faces challenges such as the high cost of advanced display systems and the need for continuous technological upgrades to maintain competitiveness. The market penetration of AI-powered image analysis tools is expected to increase from xx% in 2025 to xx% by 2033. This translates to a CAGR of xx%. Consumer preferences are shifting towards higher resolution, larger displays, and integrated software solutions that optimize workflow efficiency. Competitive dynamics are characterized by intense competition among established players and the emergence of innovative startups offering specialized solutions.
Dominant Markets & Segments in Medical Imaging Displays Industry
North America currently dominates the Medical Imaging Displays market, driven by high healthcare expenditure, advanced healthcare infrastructure, and the early adoption of new technologies. However, the Asia-Pacific region is poised for significant growth due to rising healthcare expenditure, increasing prevalence of chronic diseases, and government initiatives promoting healthcare infrastructure development.
By Component:
- Display Units: This segment holds the largest market share due to the fundamental role of display units in medical imaging. Key drivers include the increasing demand for high-resolution displays and the adoption of advanced display technologies.
- Visualization Software: This segment is experiencing rapid growth driven by the increasing demand for advanced image processing and analysis capabilities. Improved diagnostic accuracy and workflow efficiency are key drivers.
- Others: This segment encompasses ancillary components and services.
By Modality:
- Computed Tomography (CT): This segment is a major contributor due to the widespread use of CT scans in various medical applications.
- Magnetic Resonance Imaging (MRI): This segment is characterized by high image quality and detailed anatomical information.
- Ultrasound: This segment is driven by its portability and cost-effectiveness.
- Mammography: This segment is driven by the need for early detection and diagnosis of breast cancer.
By Usage Mode:
- Thick Client Workstation: This segment dominates currently due to its processing power and capacity for handling complex imaging data.
- Thin Client Workstation: This segment shows potential for growth, driven by the increasing adoption of cloud-based solutions and remote diagnostics.
Medical Imaging Displays Industry Product Developments
Recent product innovations focus on improved image quality, increased resolution, enhanced ergonomics, and seamless integration with existing medical imaging workflows. Manufacturers are incorporating advanced features such as AI-powered image analysis, HDR, and advanced color calibration to optimize diagnostic accuracy and efficiency. These developments enhance the clinical workflow, reduce diagnostic time, and improve overall patient care. The market fit of these innovations is strong, driven by the growing demand for sophisticated and efficient medical imaging solutions.
Report Scope & Segmentation Analysis
This report provides a comprehensive analysis of the Medical Imaging Displays market, segmented by component, modality, and usage mode. Each segment is analyzed in detail, providing insights into growth projections, market size, and competitive dynamics.
By Component: The report analyzes the market size and growth potential of visualization software, display units, and other components.
By Modality: The report provides a detailed analysis of the market for each imaging modality, including CT, MRI, ultrasound, and mammography.
By Usage Mode: The report explores the market for thick and thin client workstations, analyzing their growth trends and adoption rates.
Key Drivers of Medical Imaging Displays Industry Growth
The Medical Imaging Displays market's growth is propelled by several factors: the rising prevalence of chronic diseases demanding advanced diagnostics, increasing healthcare expenditure globally, technological advancements leading to higher-resolution displays and AI integration, and government initiatives promoting healthcare infrastructure development. These factors collectively fuel substantial market expansion.
Challenges in the Medical Imaging Displays Industry Sector
The Medical Imaging Displays sector faces challenges including high initial investment costs for advanced systems, stringent regulatory approvals impacting market entry, and supply chain vulnerabilities affecting the availability of critical components. Furthermore, intense competition from established and emerging players puts pressure on profit margins and necessitates continuous innovation. These factors, if not addressed effectively, can hinder market growth.
Emerging Opportunities in Medical Imaging Displays Industry
Emerging opportunities lie in the integration of AI and machine learning for improved diagnostic accuracy, the growing adoption of cloud-based imaging solutions enabling remote diagnostics, and the expansion into developing markets with increasing healthcare infrastructure investments. These trends present significant growth potential for the industry.
Leading Players in the Medical Imaging Displays Industry Market
- Chimaera GmbH
- Esaote SpA
- Siemens Healthineers
- Hologic Inc
- GE Healthcare
- Koninklijke Philips N V
- PaxeraHealth
- Carestream Health
- NGI Group
- Medicor Imaging
- Carl Zeiss AG
- Capsa Healthcare
Key Developments in Medical Imaging Displays Industry Industry
- 2022 Q4: Siemens Healthineers launched a new line of high-resolution medical displays.
- 2023 Q1: GE Healthcare announced a strategic partnership to integrate AI-powered image analysis into its display systems.
- 2023 Q3: Esaote SpA acquired a smaller medical display company, expanding its product portfolio. (Further specific developments with dates will be added in the final report)
Strategic Outlook for Medical Imaging Displays Industry Market
The Medical Imaging Displays market is poised for continued growth, driven by technological advancements, increasing healthcare spending, and the rising prevalence of chronic diseases. Future opportunities lie in the integration of innovative technologies such as AI and cloud computing, expanding market penetration in developing economies, and focusing on delivering cost-effective and efficient solutions to meet evolving market demands. The market's strategic outlook remains positive, with substantial potential for further expansion and innovation in the coming years.
Medical Imaging Displays Industry Segmentation
-
1. Component
- 1.1. Visualization Software
- 1.2. Display Units
- 1.3. Others
-
2. Modality
- 2.1. Computed Tomography (CT)
- 2.2. Magnetic Resonance Imaging
- 2.3. Ultrasound
- 2.4. Mammography
- 2.5. Others
-
3. Usage Mode
- 3.1. Thick Client Workstation
- 3.2. Thin Client Workstation
Medical Imaging Displays Industry Segmentation By Geography
-
1. North America
- 1.1. United States
- 1.2. Canada
- 1.3. Mexico
-
2. Europe
- 2.1. Germany
- 2.2. United Kingdom
- 2.3. France
- 2.4. Italy
- 2.5. Spain
- 2.6. Rest of Europe
-
3. Asia Pacific
- 3.1. China
- 3.2. Japan
- 3.3. India
- 3.4. Australia
- 3.5. South Korea
- 3.6. Rest of Asia Pacific
-
4. Middle East and Africa
- 4.1. GCC
- 4.2. South Africa
- 4.3. Rest of Middle East and Africa
-
5. South America
- 5.1. Brazil
- 5.2. Argentina
- 5.3. Rest of South America
Medical Imaging Displays Industry REPORT HIGHLIGHTS
| Aspects | Details |
|---|---|
| Study Period | 2019-2033 |
| Base Year | 2024 |
| Estimated Year | 2025 |
| Forecast Period | 2025-2033 |
| Historical Period | 2019-2024 |
| Growth Rate | CAGR of 6.99% from 2019-2033 |
| Segmentation |
|
Table of Contents
- 1. Introduction
- 1.1. Research Scope
- 1.2. Market Segmentation
- 1.3. Research Methodology
- 1.4. Definitions and Assumptions
- 2. Executive Summary
- 2.1. Introduction
- 3. Market Dynamics
- 3.1. Introduction
- 3.2. Market Drivers
- 3.2.1. Technological Advancements in The Imaging Technologies and Use of Artificial Intelligence; Rising Healthcare Expenditure Coupled with Rising Disease Burden
- 3.3. Market Restrains
- 3.3.1. High Cost of Medical Imaging Equipment; Lack of Skilled Professionals
- 3.4. Market Trends
- 3.4.1. Ultrasound is Expected to Hold the Major Market Share in the Medical Imaging Workstation Market
- 4. Market Factor Analysis
- 4.1. Porters Five Forces
- 4.2. Supply/Value Chain
- 4.3. PESTEL analysis
- 4.4. Market Entropy
- 4.5. Patent/Trademark Analysis
- 5. Global Medical Imaging Displays Industry Analysis, Insights and Forecast, 2019-2031
- 5.1. Market Analysis, Insights and Forecast - by Component
- 5.1.1. Visualization Software
- 5.1.2. Display Units
- 5.1.3. Others
- 5.2. Market Analysis, Insights and Forecast - by Modality
- 5.2.1. Computed Tomography (CT)
- 5.2.2. Magnetic Resonance Imaging
- 5.2.3. Ultrasound
- 5.2.4. Mammography
- 5.2.5. Others
- 5.3. Market Analysis, Insights and Forecast - by Usage Mode
- 5.3.1. Thick Client Workstation
- 5.3.2. Thin Client Workstation
- 5.4. Market Analysis, Insights and Forecast - by Region
- 5.4.1. North America
- 5.4.2. Europe
- 5.4.3. Asia Pacific
- 5.4.4. Middle East and Africa
- 5.4.5. South America
- 5.1. Market Analysis, Insights and Forecast - by Component
- 6. North America Medical Imaging Displays Industry Analysis, Insights and Forecast, 2019-2031
- 6.1. Market Analysis, Insights and Forecast - by Component
- 6.1.1. Visualization Software
- 6.1.2. Display Units
- 6.1.3. Others
- 6.2. Market Analysis, Insights and Forecast - by Modality
- 6.2.1. Computed Tomography (CT)
- 6.2.2. Magnetic Resonance Imaging
- 6.2.3. Ultrasound
- 6.2.4. Mammography
- 6.2.5. Others
- 6.3. Market Analysis, Insights and Forecast - by Usage Mode
- 6.3.1. Thick Client Workstation
- 6.3.2. Thin Client Workstation
- 6.1. Market Analysis, Insights and Forecast - by Component
- 7. Europe Medical Imaging Displays Industry Analysis, Insights and Forecast, 2019-2031
- 7.1. Market Analysis, Insights and Forecast - by Component
- 7.1.1. Visualization Software
- 7.1.2. Display Units
- 7.1.3. Others
- 7.2. Market Analysis, Insights and Forecast - by Modality
- 7.2.1. Computed Tomography (CT)
- 7.2.2. Magnetic Resonance Imaging
- 7.2.3. Ultrasound
- 7.2.4. Mammography
- 7.2.5. Others
- 7.3. Market Analysis, Insights and Forecast - by Usage Mode
- 7.3.1. Thick Client Workstation
- 7.3.2. Thin Client Workstation
- 7.1. Market Analysis, Insights and Forecast - by Component
- 8. Asia Pacific Medical Imaging Displays Industry Analysis, Insights and Forecast, 2019-2031
- 8.1. Market Analysis, Insights and Forecast - by Component
- 8.1.1. Visualization Software
- 8.1.2. Display Units
- 8.1.3. Others
- 8.2. Market Analysis, Insights and Forecast - by Modality
- 8.2.1. Computed Tomography (CT)
- 8.2.2. Magnetic Resonance Imaging
- 8.2.3. Ultrasound
- 8.2.4. Mammography
- 8.2.5. Others
- 8.3. Market Analysis, Insights and Forecast - by Usage Mode
- 8.3.1. Thick Client Workstation
- 8.3.2. Thin Client Workstation
- 8.1. Market Analysis, Insights and Forecast - by Component
- 9. Middle East and Africa Medical Imaging Displays Industry Analysis, Insights and Forecast, 2019-2031
- 9.1. Market Analysis, Insights and Forecast - by Component
- 9.1.1. Visualization Software
- 9.1.2. Display Units
- 9.1.3. Others
- 9.2. Market Analysis, Insights and Forecast - by Modality
- 9.2.1. Computed Tomography (CT)
- 9.2.2. Magnetic Resonance Imaging
- 9.2.3. Ultrasound
- 9.2.4. Mammography
- 9.2.5. Others
- 9.3. Market Analysis, Insights and Forecast - by Usage Mode
- 9.3.1. Thick Client Workstation
- 9.3.2. Thin Client Workstation
- 9.1. Market Analysis, Insights and Forecast - by Component
- 10. South America Medical Imaging Displays Industry Analysis, Insights and Forecast, 2019-2031
- 10.1. Market Analysis, Insights and Forecast - by Component
- 10.1.1. Visualization Software
- 10.1.2. Display Units
- 10.1.3. Others
- 10.2. Market Analysis, Insights and Forecast - by Modality
- 10.2.1. Computed Tomography (CT)
- 10.2.2. Magnetic Resonance Imaging
- 10.2.3. Ultrasound
- 10.2.4. Mammography
- 10.2.5. Others
- 10.3. Market Analysis, Insights and Forecast - by Usage Mode
- 10.3.1. Thick Client Workstation
- 10.3.2. Thin Client Workstation
- 10.1. Market Analysis, Insights and Forecast - by Component
- 11. North America Medical Imaging Displays Industry Analysis, Insights and Forecast, 2019-2031
- 11.1. Market Analysis, Insights and Forecast - By Country/Sub-region
- 11.1.1 United States
- 11.1.2 Canada
- 11.1.3 Mexico
- 12. Europe Medical Imaging Displays Industry Analysis, Insights and Forecast, 2019-2031
- 12.1. Market Analysis, Insights and Forecast - By Country/Sub-region
- 12.1.1 Germany
- 12.1.2 United Kingdom
- 12.1.3 France
- 12.1.4 Italy
- 12.1.5 Spain
- 12.1.6 Rest of Europe
- 13. Asia Pacific Medical Imaging Displays Industry Analysis, Insights and Forecast, 2019-2031
- 13.1. Market Analysis, Insights and Forecast - By Country/Sub-region
- 13.1.1 China
- 13.1.2 Japan
- 13.1.3 India
- 13.1.4 Australia
- 13.1.5 South Korea
- 13.1.6 Rest of Asia Pacific
- 14. Middle East and Africa Medical Imaging Displays Industry Analysis, Insights and Forecast, 2019-2031
- 14.1. Market Analysis, Insights and Forecast - By Country/Sub-region
- 14.1.1 GCC
- 14.1.2 South Africa
- 14.1.3 Rest of Middle East and Africa
- 15. South America Medical Imaging Displays Industry Analysis, Insights and Forecast, 2019-2031
- 15.1. Market Analysis, Insights and Forecast - By Country/Sub-region
- 15.1.1 Brazil
- 15.1.2 Argentina
- 15.1.3 Rest of South America
- 16. Competitive Analysis
- 16.1. Global Market Share Analysis 2024
- 16.2. Company Profiles
- 16.2.1 Chimaera GmbH*List Not Exhaustive
- 16.2.1.1. Overview
- 16.2.1.2. Products
- 16.2.1.3. SWOT Analysis
- 16.2.1.4. Recent Developments
- 16.2.1.5. Financials (Based on Availability)
- 16.2.2 Esaote SpA
- 16.2.2.1. Overview
- 16.2.2.2. Products
- 16.2.2.3. SWOT Analysis
- 16.2.2.4. Recent Developments
- 16.2.2.5. Financials (Based on Availability)
- 16.2.3 Siemens Healthineers
- 16.2.3.1. Overview
- 16.2.3.2. Products
- 16.2.3.3. SWOT Analysis
- 16.2.3.4. Recent Developments
- 16.2.3.5. Financials (Based on Availability)
- 16.2.4 Hologic Inc
- 16.2.4.1. Overview
- 16.2.4.2. Products
- 16.2.4.3. SWOT Analysis
- 16.2.4.4. Recent Developments
- 16.2.4.5. Financials (Based on Availability)
- 16.2.5 GE Healthcare
- 16.2.5.1. Overview
- 16.2.5.2. Products
- 16.2.5.3. SWOT Analysis
- 16.2.5.4. Recent Developments
- 16.2.5.5. Financials (Based on Availability)
- 16.2.6 Koninklijke Philips N V
- 16.2.6.1. Overview
- 16.2.6.2. Products
- 16.2.6.3. SWOT Analysis
- 16.2.6.4. Recent Developments
- 16.2.6.5. Financials (Based on Availability)
- 16.2.7 PaxeraHealth
- 16.2.7.1. Overview
- 16.2.7.2. Products
- 16.2.7.3. SWOT Analysis
- 16.2.7.4. Recent Developments
- 16.2.7.5. Financials (Based on Availability)
- 16.2.8 Carestream Health
- 16.2.8.1. Overview
- 16.2.8.2. Products
- 16.2.8.3. SWOT Analysis
- 16.2.8.4. Recent Developments
- 16.2.8.5. Financials (Based on Availability)
- 16.2.9 NGI Group
- 16.2.9.1. Overview
- 16.2.9.2. Products
- 16.2.9.3. SWOT Analysis
- 16.2.9.4. Recent Developments
- 16.2.9.5. Financials (Based on Availability)
- 16.2.10 Medicor Imaging
- 16.2.10.1. Overview
- 16.2.10.2. Products
- 16.2.10.3. SWOT Analysis
- 16.2.10.4. Recent Developments
- 16.2.10.5. Financials (Based on Availability)
- 16.2.11 Carl Zeiss AG
- 16.2.11.1. Overview
- 16.2.11.2. Products
- 16.2.11.3. SWOT Analysis
- 16.2.11.4. Recent Developments
- 16.2.11.5. Financials (Based on Availability)
- 16.2.12 Capsa Healthcare
- 16.2.12.1. Overview
- 16.2.12.2. Products
- 16.2.12.3. SWOT Analysis
- 16.2.12.4. Recent Developments
- 16.2.12.5. Financials (Based on Availability)
- 16.2.1 Chimaera GmbH*List Not Exhaustive
List of Figures
- Figure 1: Global Medical Imaging Displays Industry Revenue Breakdown (Million, %) by Region 2024 & 2032
- Figure 2: North America Medical Imaging Displays Industry Revenue (Million), by Country 2024 & 2032
- Figure 3: North America Medical Imaging Displays Industry Revenue Share (%), by Country 2024 & 2032
- Figure 4: Europe Medical Imaging Displays Industry Revenue (Million), by Country 2024 & 2032
- Figure 5: Europe Medical Imaging Displays Industry Revenue Share (%), by Country 2024 & 2032
- Figure 6: Asia Pacific Medical Imaging Displays Industry Revenue (Million), by Country 2024 & 2032
- Figure 7: Asia Pacific Medical Imaging Displays Industry Revenue Share (%), by Country 2024 & 2032
- Figure 8: Middle East and Africa Medical Imaging Displays Industry Revenue (Million), by Country 2024 & 2032
- Figure 9: Middle East and Africa Medical Imaging Displays Industry Revenue Share (%), by Country 2024 & 2032
- Figure 10: South America Medical Imaging Displays Industry Revenue (Million), by Country 2024 & 2032
- Figure 11: South America Medical Imaging Displays Industry Revenue Share (%), by Country 2024 & 2032
- Figure 12: North America Medical Imaging Displays Industry Revenue (Million), by Component 2024 & 2032
- Figure 13: North America Medical Imaging Displays Industry Revenue Share (%), by Component 2024 & 2032
- Figure 14: North America Medical Imaging Displays Industry Revenue (Million), by Modality 2024 & 2032
- Figure 15: North America Medical Imaging Displays Industry Revenue Share (%), by Modality 2024 & 2032
- Figure 16: North America Medical Imaging Displays Industry Revenue (Million), by Usage Mode 2024 & 2032
- Figure 17: North America Medical Imaging Displays Industry Revenue Share (%), by Usage Mode 2024 & 2032
- Figure 18: North America Medical Imaging Displays Industry Revenue (Million), by Country 2024 & 2032
- Figure 19: North America Medical Imaging Displays Industry Revenue Share (%), by Country 2024 & 2032
- Figure 20: Europe Medical Imaging Displays Industry Revenue (Million), by Component 2024 & 2032
- Figure 21: Europe Medical Imaging Displays Industry Revenue Share (%), by Component 2024 & 2032
- Figure 22: Europe Medical Imaging Displays Industry Revenue (Million), by Modality 2024 & 2032
- Figure 23: Europe Medical Imaging Displays Industry Revenue Share (%), by Modality 2024 & 2032
- Figure 24: Europe Medical Imaging Displays Industry Revenue (Million), by Usage Mode 2024 & 2032
- Figure 25: Europe Medical Imaging Displays Industry Revenue Share (%), by Usage Mode 2024 & 2032
- Figure 26: Europe Medical Imaging Displays Industry Revenue (Million), by Country 2024 & 2032
- Figure 27: Europe Medical Imaging Displays Industry Revenue Share (%), by Country 2024 & 2032
- Figure 28: Asia Pacific Medical Imaging Displays Industry Revenue (Million), by Component 2024 & 2032
- Figure 29: Asia Pacific Medical Imaging Displays Industry Revenue Share (%), by Component 2024 & 2032
- Figure 30: Asia Pacific Medical Imaging Displays Industry Revenue (Million), by Modality 2024 & 2032
- Figure 31: Asia Pacific Medical Imaging Displays Industry Revenue Share (%), by Modality 2024 & 2032
- Figure 32: Asia Pacific Medical Imaging Displays Industry Revenue (Million), by Usage Mode 2024 & 2032
- Figure 33: Asia Pacific Medical Imaging Displays Industry Revenue Share (%), by Usage Mode 2024 & 2032
- Figure 34: Asia Pacific Medical Imaging Displays Industry Revenue (Million), by Country 2024 & 2032
- Figure 35: Asia Pacific Medical Imaging Displays Industry Revenue Share (%), by Country 2024 & 2032
- Figure 36: Middle East and Africa Medical Imaging Displays Industry Revenue (Million), by Component 2024 & 2032
- Figure 37: Middle East and Africa Medical Imaging Displays Industry Revenue Share (%), by Component 2024 & 2032
- Figure 38: Middle East and Africa Medical Imaging Displays Industry Revenue (Million), by Modality 2024 & 2032
- Figure 39: Middle East and Africa Medical Imaging Displays Industry Revenue Share (%), by Modality 2024 & 2032
- Figure 40: Middle East and Africa Medical Imaging Displays Industry Revenue (Million), by Usage Mode 2024 & 2032
- Figure 41: Middle East and Africa Medical Imaging Displays Industry Revenue Share (%), by Usage Mode 2024 & 2032
- Figure 42: Middle East and Africa Medical Imaging Displays Industry Revenue (Million), by Country 2024 & 2032
- Figure 43: Middle East and Africa Medical Imaging Displays Industry Revenue Share (%), by Country 2024 & 2032
- Figure 44: South America Medical Imaging Displays Industry Revenue (Million), by Component 2024 & 2032
- Figure 45: South America Medical Imaging Displays Industry Revenue Share (%), by Component 2024 & 2032
- Figure 46: South America Medical Imaging Displays Industry Revenue (Million), by Modality 2024 & 2032
- Figure 47: South America Medical Imaging Displays Industry Revenue Share (%), by Modality 2024 & 2032
- Figure 48: South America Medical Imaging Displays Industry Revenue (Million), by Usage Mode 2024 & 2032
- Figure 49: South America Medical Imaging Displays Industry Revenue Share (%), by Usage Mode 2024 & 2032
- Figure 50: South America Medical Imaging Displays Industry Revenue (Million), by Country 2024 & 2032
- Figure 51: South America Medical Imaging Displays Industry Revenue Share (%), by Country 2024 & 2032
List of Tables
- Table 1: Global Medical Imaging Displays Industry Revenue Million Forecast, by Region 2019 & 2032
- Table 2: Global Medical Imaging Displays Industry Revenue Million Forecast, by Component 2019 & 2032
- Table 3: Global Medical Imaging Displays Industry Revenue Million Forecast, by Modality 2019 & 2032
- Table 4: Global Medical Imaging Displays Industry Revenue Million Forecast, by Usage Mode 2019 & 2032
- Table 5: Global Medical Imaging Displays Industry Revenue Million Forecast, by Region 2019 & 2032
- Table 6: Global Medical Imaging Displays Industry Revenue Million Forecast, by Country 2019 & 2032
- Table 7: United States Medical Imaging Displays Industry Revenue (Million) Forecast, by Application 2019 & 2032
- Table 8: Canada Medical Imaging Displays Industry Revenue (Million) Forecast, by Application 2019 & 2032
- Table 9: Mexico Medical Imaging Displays Industry Revenue (Million) Forecast, by Application 2019 & 2032
- Table 10: Global Medical Imaging Displays Industry Revenue Million Forecast, by Country 2019 & 2032
- Table 11: Germany Medical Imaging Displays Industry Revenue (Million) Forecast, by Application 2019 & 2032
- Table 12: United Kingdom Medical Imaging Displays Industry Revenue (Million) Forecast, by Application 2019 & 2032
- Table 13: France Medical Imaging Displays Industry Revenue (Million) Forecast, by Application 2019 & 2032
- Table 14: Italy Medical Imaging Displays Industry Revenue (Million) Forecast, by Application 2019 & 2032
- Table 15: Spain Medical Imaging Displays Industry Revenue (Million) Forecast, by Application 2019 & 2032
- Table 16: Rest of Europe Medical Imaging Displays Industry Revenue (Million) Forecast, by Application 2019 & 2032
- Table 17: Global Medical Imaging Displays Industry Revenue Million Forecast, by Country 2019 & 2032
- Table 18: China Medical Imaging Displays Industry Revenue (Million) Forecast, by Application 2019 & 2032
- Table 19: Japan Medical Imaging Displays Industry Revenue (Million) Forecast, by Application 2019 & 2032
- Table 20: India Medical Imaging Displays Industry Revenue (Million) Forecast, by Application 2019 & 2032
- Table 21: Australia Medical Imaging Displays Industry Revenue (Million) Forecast, by Application 2019 & 2032
- Table 22: South Korea Medical Imaging Displays Industry Revenue (Million) Forecast, by Application 2019 & 2032
- Table 23: Rest of Asia Pacific Medical Imaging Displays Industry Revenue (Million) Forecast, by Application 2019 & 2032
- Table 24: Global Medical Imaging Displays Industry Revenue Million Forecast, by Country 2019 & 2032
- Table 25: GCC Medical Imaging Displays Industry Revenue (Million) Forecast, by Application 2019 & 2032
- Table 26: South Africa Medical Imaging Displays Industry Revenue (Million) Forecast, by Application 2019 & 2032
- Table 27: Rest of Middle East and Africa Medical Imaging Displays Industry Revenue (Million) Forecast, by Application 2019 & 2032
- Table 28: Global Medical Imaging Displays Industry Revenue Million Forecast, by Country 2019 & 2032
- Table 29: Brazil Medical Imaging Displays Industry Revenue (Million) Forecast, by Application 2019 & 2032
- Table 30: Argentina Medical Imaging Displays Industry Revenue (Million) Forecast, by Application 2019 & 2032
- Table 31: Rest of South America Medical Imaging Displays Industry Revenue (Million) Forecast, by Application 2019 & 2032
- Table 32: Global Medical Imaging Displays Industry Revenue Million Forecast, by Component 2019 & 2032
- Table 33: Global Medical Imaging Displays Industry Revenue Million Forecast, by Modality 2019 & 2032
- Table 34: Global Medical Imaging Displays Industry Revenue Million Forecast, by Usage Mode 2019 & 2032
- Table 35: Global Medical Imaging Displays Industry Revenue Million Forecast, by Country 2019 & 2032
- Table 36: United States Medical Imaging Displays Industry Revenue (Million) Forecast, by Application 2019 & 2032
- Table 37: Canada Medical Imaging Displays Industry Revenue (Million) Forecast, by Application 2019 & 2032
- Table 38: Mexico Medical Imaging Displays Industry Revenue (Million) Forecast, by Application 2019 & 2032
- Table 39: Global Medical Imaging Displays Industry Revenue Million Forecast, by Component 2019 & 2032
- Table 40: Global Medical Imaging Displays Industry Revenue Million Forecast, by Modality 2019 & 2032
- Table 41: Global Medical Imaging Displays Industry Revenue Million Forecast, by Usage Mode 2019 & 2032
- Table 42: Global Medical Imaging Displays Industry Revenue Million Forecast, by Country 2019 & 2032
- Table 43: Germany Medical Imaging Displays Industry Revenue (Million) Forecast, by Application 2019 & 2032
- Table 44: United Kingdom Medical Imaging Displays Industry Revenue (Million) Forecast, by Application 2019 & 2032
- Table 45: France Medical Imaging Displays Industry Revenue (Million) Forecast, by Application 2019 & 2032
- Table 46: Italy Medical Imaging Displays Industry Revenue (Million) Forecast, by Application 2019 & 2032
- Table 47: Spain Medical Imaging Displays Industry Revenue (Million) Forecast, by Application 2019 & 2032
- Table 48: Rest of Europe Medical Imaging Displays Industry Revenue (Million) Forecast, by Application 2019 & 2032
- Table 49: Global Medical Imaging Displays Industry Revenue Million Forecast, by Component 2019 & 2032
- Table 50: Global Medical Imaging Displays Industry Revenue Million Forecast, by Modality 2019 & 2032
- Table 51: Global Medical Imaging Displays Industry Revenue Million Forecast, by Usage Mode 2019 & 2032
- Table 52: Global Medical Imaging Displays Industry Revenue Million Forecast, by Country 2019 & 2032
- Table 53: China Medical Imaging Displays Industry Revenue (Million) Forecast, by Application 2019 & 2032
- Table 54: Japan Medical Imaging Displays Industry Revenue (Million) Forecast, by Application 2019 & 2032
- Table 55: India Medical Imaging Displays Industry Revenue (Million) Forecast, by Application 2019 & 2032
- Table 56: Australia Medical Imaging Displays Industry Revenue (Million) Forecast, by Application 2019 & 2032
- Table 57: South Korea Medical Imaging Displays Industry Revenue (Million) Forecast, by Application 2019 & 2032
- Table 58: Rest of Asia Pacific Medical Imaging Displays Industry Revenue (Million) Forecast, by Application 2019 & 2032
- Table 59: Global Medical Imaging Displays Industry Revenue Million Forecast, by Component 2019 & 2032
- Table 60: Global Medical Imaging Displays Industry Revenue Million Forecast, by Modality 2019 & 2032
- Table 61: Global Medical Imaging Displays Industry Revenue Million Forecast, by Usage Mode 2019 & 2032
- Table 62: Global Medical Imaging Displays Industry Revenue Million Forecast, by Country 2019 & 2032
- Table 63: GCC Medical Imaging Displays Industry Revenue (Million) Forecast, by Application 2019 & 2032
- Table 64: South Africa Medical Imaging Displays Industry Revenue (Million) Forecast, by Application 2019 & 2032
- Table 65: Rest of Middle East and Africa Medical Imaging Displays Industry Revenue (Million) Forecast, by Application 2019 & 2032
- Table 66: Global Medical Imaging Displays Industry Revenue Million Forecast, by Component 2019 & 2032
- Table 67: Global Medical Imaging Displays Industry Revenue Million Forecast, by Modality 2019 & 2032
- Table 68: Global Medical Imaging Displays Industry Revenue Million Forecast, by Usage Mode 2019 & 2032
- Table 69: Global Medical Imaging Displays Industry Revenue Million Forecast, by Country 2019 & 2032
- Table 70: Brazil Medical Imaging Displays Industry Revenue (Million) Forecast, by Application 2019 & 2032
- Table 71: Argentina Medical Imaging Displays Industry Revenue (Million) Forecast, by Application 2019 & 2032
- Table 72: Rest of South America Medical Imaging Displays Industry Revenue (Million) Forecast, by Application 2019 & 2032
Frequently Asked Questions
1. What is the projected Compound Annual Growth Rate (CAGR) of the Medical Imaging Displays Industry?
The projected CAGR is approximately 6.99%.
2. Which companies are prominent players in the Medical Imaging Displays Industry?
Key companies in the market include Chimaera GmbH*List Not Exhaustive, Esaote SpA, Siemens Healthineers, Hologic Inc, GE Healthcare, Koninklijke Philips N V, PaxeraHealth, Carestream Health, NGI Group, Medicor Imaging, Carl Zeiss AG, Capsa Healthcare.
3. What are the main segments of the Medical Imaging Displays Industry?
The market segments include Component, Modality, Usage Mode.
4. Can you provide details about the market size?
The market size is estimated to be USD 6.21 Million as of 2022.
5. What are some drivers contributing to market growth?
Technological Advancements in The Imaging Technologies and Use of Artificial Intelligence; Rising Healthcare Expenditure Coupled with Rising Disease Burden.
6. What are the notable trends driving market growth?
Ultrasound is Expected to Hold the Major Market Share in the Medical Imaging Workstation Market.
7. Are there any restraints impacting market growth?
High Cost of Medical Imaging Equipment; Lack of Skilled Professionals.
8. Can you provide examples of recent developments in the market?
N/A
9. What pricing options are available for accessing the report?
Pricing options include single-user, multi-user, and enterprise licenses priced at USD 4750, USD 5250, and USD 8750 respectively.
10. Is the market size provided in terms of value or volume?
The market size is provided in terms of value, measured in Million.
11. Are there any specific market keywords associated with the report?
Yes, the market keyword associated with the report is "Medical Imaging Displays Industry," which aids in identifying and referencing the specific market segment covered.
12. How do I determine which pricing option suits my needs best?
The pricing options vary based on user requirements and access needs. Individual users may opt for single-user licenses, while businesses requiring broader access may choose multi-user or enterprise licenses for cost-effective access to the report.
13. Are there any additional resources or data provided in the Medical Imaging Displays Industry report?
While the report offers comprehensive insights, it's advisable to review the specific contents or supplementary materials provided to ascertain if additional resources or data are available.
14. How can I stay updated on further developments or reports in the Medical Imaging Displays Industry?
To stay informed about further developments, trends, and reports in the Medical Imaging Displays Industry, consider subscribing to industry newsletters, following relevant companies and organizations, or regularly checking reputable industry news sources and publications.
Methodology
Step 1 - Identification of Relevant Samples Size from Population Database


Step 2 - Approaches for Defining Global Market Size (Value, Volume* & Price*)

Note*: In applicable scenarios
Step 3 - Data Sources
Primary Research
- Web Analytics
- Survey Reports
- Research Institute
- Latest Research Reports
- Opinion Leaders
Secondary Research
- Annual Reports
- White Paper
- Latest Press Release
- Industry Association
- Paid Database
- Investor Presentations

Step 4 - Data Triangulation
Involves using different sources of information in order to increase the validity of a study
These sources are likely to be stakeholders in a program - participants, other researchers, program staff, other community members, and so on.
Then we put all data in single framework & apply various statistical tools to find out the dynamic on the market.
During the analysis stage, feedback from the stakeholder groups would be compared to determine areas of agreement as well as areas of divergence


