
Key Insights
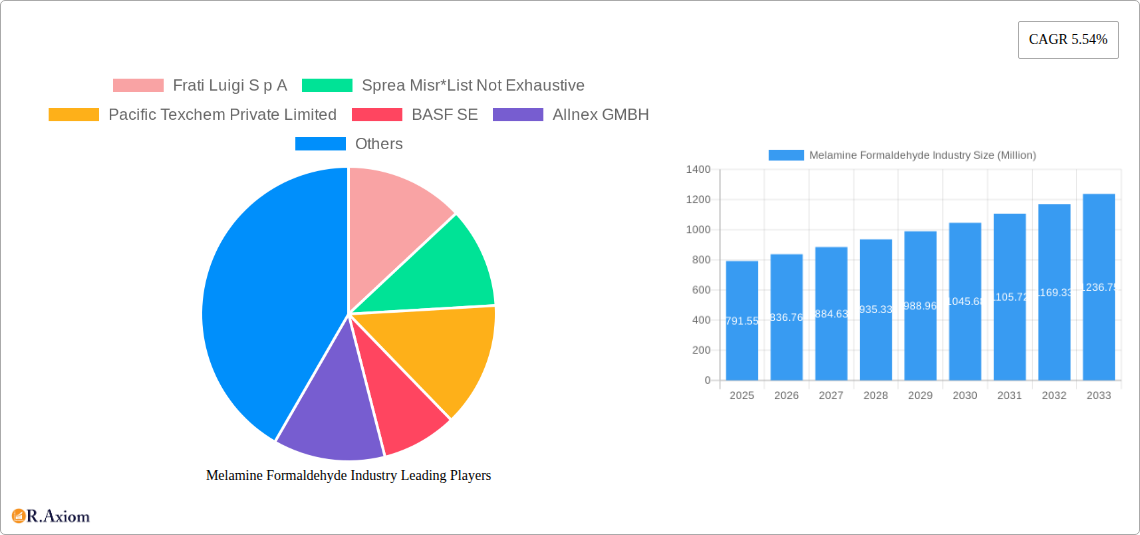
The global Melamine Formaldehyde Resin (MFR) market, valued at $791.55 million in 2025, is projected to experience robust growth, driven by increasing demand across diverse applications. The compound annual growth rate (CAGR) of 5.54% from 2025 to 2033 indicates a significant expansion potential. Key drivers include the burgeoning construction industry, particularly in developing economies, fueling demand for laminates and wood adhesives. The growing automotive sector also contributes significantly, with MFRs utilized in molding compounds and paints. Furthermore, advancements in resin formulations, focusing on enhanced performance characteristics like durability and water resistance, are driving market expansion. While fluctuating raw material prices pose a challenge, the industry is adapting through efficient sourcing and innovative manufacturing processes. The Iso-butylated Melamine Formaldehyde Resin segment currently holds a dominant market share, attributable to its superior properties. However, the n-butylated segment is projected to witness faster growth due to its cost-effectiveness and suitability for specific applications. Geographically, Asia-Pacific is expected to be a major growth engine, fueled by robust infrastructure development and rising disposable incomes, while North America and Europe maintain significant market presence due to established industrial bases.
The competitive landscape is characterized by both large multinational corporations and specialized regional players. Key players like BASF SE, Hexion, and AkzoNobel NV are leveraging their technological expertise and global distribution networks to maintain their market leadership. However, smaller companies are focusing on niche applications and regional markets to carve out their position. The forecast period will likely see increased strategic partnerships and mergers & acquisitions as companies seek to expand their product portfolios and geographic reach. Sustainability concerns are also emerging, prompting research into bio-based alternatives and environmentally friendly production processes. This focus on sustainability will further shape the future trajectory of the MFR market, encouraging innovation and potentially leading to a shift in market dynamics.
Melamine Formaldehyde Industry: A Comprehensive Market Analysis (2019-2033)
This in-depth report provides a comprehensive analysis of the Melamine Formaldehyde industry, covering market size, growth drivers, challenges, opportunities, and key players. The study period spans from 2019 to 2033, with 2025 serving as the base and estimated year. The report leverages extensive primary and secondary research to offer actionable insights for industry stakeholders, including manufacturers, suppliers, distributors, and investors. The global Melamine Formaldehyde market is projected to reach xx Million by 2033, exhibiting a CAGR of xx% during the forecast period (2025-2033).
Melamine Formaldehyde Industry Market Concentration & Innovation
This section analyzes the competitive landscape of the Melamine Formaldehyde industry, evaluating market concentration, innovation drivers, regulatory frameworks, and strategic activities. The report examines the market share of key players such as BASF SE, Allnex GMBH, Hexion, and AkzoNobel NV, highlighting their competitive strategies and market positioning. The analysis also delves into the impact of mergers and acquisitions (M&A) activities on market consolidation, with estimated deal values exceeding xx Million in recent years.
- Market Concentration: The industry exhibits a moderately concentrated structure, with the top five players holding approximately xx% of the global market share in 2024.
- Innovation Drivers: Ongoing research and development in resin formulations, focusing on improved performance characteristics (e.g., enhanced durability, reduced formaldehyde emissions), drive innovation.
- Regulatory Frameworks: Stringent environmental regulations concerning formaldehyde emissions significantly influence product development and manufacturing processes.
- Product Substitutes: The industry faces competition from alternative materials such as phenolic resins and polyurethane, necessitating continuous innovation to maintain market share.
- End-User Trends: Growing demand from the construction and automotive industries, particularly in emerging economies, fuels market expansion.
- M&A Activities: Consolidation through M&A activities is expected to continue, driven by the need for economies of scale and access to new technologies. Recent deals have involved companies like xx, with values ranging from xx Million to xx Million.
Melamine Formaldehyde Industry Industry Trends & Insights
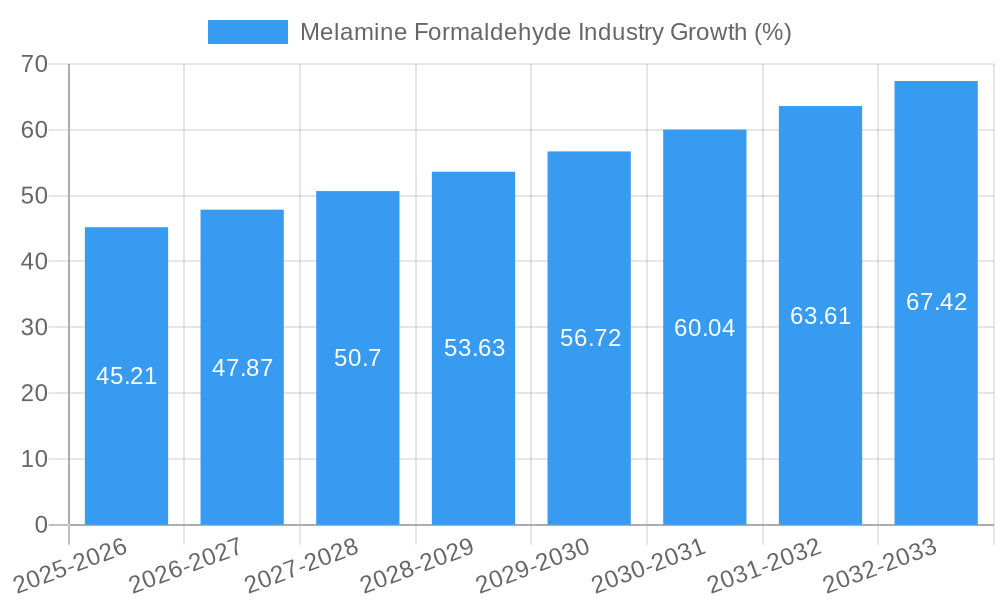
The Melamine Formaldehyde market is experiencing dynamic growth, shaped by several key trends. The increasing demand for durable and cost-effective materials in diverse applications, coupled with technological advancements in resin formulations, drives market expansion. Consumer preferences are shifting towards eco-friendly and sustainable products, impacting product development and marketing strategies. Competitive dynamics are characterized by intense rivalry, necessitating continuous innovation and strategic partnerships. The market's expansion is further propelled by infrastructural development and favorable economic policies in key regions. This section provides detailed insights into these trends and their impact on market growth. The global market witnessed a CAGR of xx% during the historical period (2019-2024) and is projected to maintain a robust growth trajectory in the coming years, penetrating xx% of the overall resin market by 2033.
Dominant Markets & Segments in Melamine Formaldehyde Industry
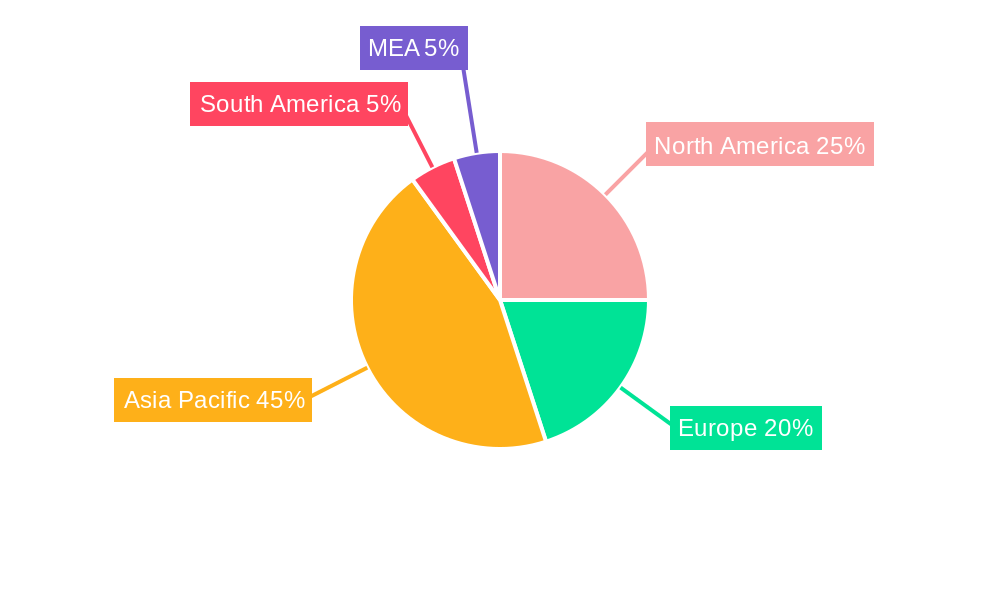
This section identifies the dominant regions, countries, and segments within the Melamine Formaldehyde market. Asia-Pacific is the leading region, driven by robust construction activities and industrialization. Within this region, China and India represent significant markets. In terms of application, laminates and wood adhesives constitute major segments, owing to their widespread use in furniture manufacturing and construction. The Iso-butylated Melamine Formaldehyde Resin segment is witnessing significant growth due to its superior performance characteristics compared to n-butylated counterparts.
Key Drivers:
- Asia-Pacific Dominance: Rapid infrastructure development, increasing urbanization, and booming construction sectors in China and India are key drivers.
- Laminates and Wood Adhesives: High demand from the furniture, construction, and flooring industries fuels segment growth.
- Iso-butylated Melamine Formaldehyde Resin: Superior properties (e.g., higher resistance to heat and moisture) lead to higher demand and pricing.
Dominance Analysis: The dominance of Asia-Pacific stems from the region's rapid economic growth, substantial infrastructural investments, and the rising demand for wood-based products. China's dominance within Asia-Pacific is largely due to its vast construction and furniture industries, leading to high consumption of melamine formaldehyde resins. The laminates segment is projected to continue its dominance due to the wide-ranging applications in various sectors.
Melamine Formaldehyde Industry Product Developments
Recent product developments focus on enhanced performance characteristics, improved durability, and reduced formaldehyde emissions. Manufacturers are actively investing in research and development to produce resins with improved water resistance, heat resistance, and chemical resistance. These innovations cater to the growing demand for sustainable and environmentally friendly products, meeting stricter regulatory standards. The emphasis is on developing customized resin formulations to meet the specific needs of different applications.
Report Scope & Segmentation Analysis
This report segments the Melamine Formaldehyde market based on type and application.
By Type:
- Iso-butylated Melamine Formaldehyde Resin: This segment is projected to experience significant growth due to its superior performance and is expected to reach xx Million by 2033. Competition is moderate, with several key players vying for market share.
- n-butylated Melamine Formaldehyde Resin: This segment represents a substantial portion of the market, with projected growth reaching xx Million by 2033. Competitive dynamics are characterized by price competition and product differentiation.
- Other Types: This segment comprises various specialized resins, with growth projections reaching xx Million by 2033. The market is characterized by niche players and specialized applications.
By Application:
- Laminates: This is a major application segment, with projected growth of xx Million by 2033, driven by the construction and furniture industries. Competitive intensity is high, with numerous suppliers offering diverse products.
- Wood Adhesives: This segment is expected to reach xx Million by 2033, driven by the growing demand for wood-based products. The competitive landscape is moderate, with both large and small players.
- Molding Compounds: This segment is expected to reach xx Million by 2033, exhibiting moderate growth. The competitive landscape is characterized by specialized players.
- Paints and Coatings: This segment is expected to reach xx Million by 2033. The market is characterized by high competition and innovation.
- Other Applications: This segment encompasses diverse applications, with projected growth of xx Million by 2033. The market involves various specialized players.
Key Drivers of Melamine Formaldehyde Industry Growth
Several factors drive the growth of the Melamine Formaldehyde industry. Firstly, the booming construction industry in developing economies fuels demand for laminates and wood adhesives. Secondly, technological advancements lead to improved resin formulations with enhanced properties. Finally, supportive government policies and infrastructure development initiatives in many regions contribute to market expansion.
Challenges in the Melamine Formaldehyde Industry Sector
The industry faces challenges such as stringent environmental regulations concerning formaldehyde emissions, increasing raw material costs, and intense competition from substitute materials. These factors can lead to price pressures and reduced profit margins. Supply chain disruptions can also affect production and delivery timelines, impacting overall market stability. The estimated impact of these challenges on the overall market size is projected to be a reduction of xx Million by 2033.
Emerging Opportunities in Melamine Formaldehyde Industry
Emerging opportunities lie in developing bio-based and sustainable resin formulations to address environmental concerns. Expanding into new applications, such as in the automotive and aerospace industries, offers significant growth potential. Furthermore, focusing on customized resin solutions for specific end-user needs creates new market niches.
Leading Players in the Melamine Formaldehyde Industry Market
- Frati Luigi S p A
- Sprea Misr
- Pacific Texchem Private Limited
- BASF SE
- Allnex GMBH
- Hexion
- Metadynea Metafrax Group
- AkzoNobel NV
- Arclin Inc
- Cornerstone Chemical
Key Developments in Melamine Formaldehyde Industry Industry
- 2022 Q4: BASF SE announced a significant investment in expanding its melamine formaldehyde resin production capacity in Asia.
- 2023 Q1: Allnex GMBH launched a new range of low-formaldehyde emission resins targeting the furniture industry.
- 2023 Q3: Hexion acquired a smaller resin manufacturer, expanding its market reach and product portfolio. (Further details on specific acquisitions and partnerships will be included in the full report.)
Strategic Outlook for Melamine Formaldehyde Industry Market
The Melamine Formaldehyde industry is poised for continued growth, driven by robust demand from various sectors and technological advancements. Focusing on sustainability and innovation will be crucial for success. Expanding into new markets and applications, while adapting to evolving regulatory landscapes, will be key strategic imperatives for market players to capitalize on future opportunities. The market is projected to achieve significant growth, with further expansion opportunities in developing economies and emerging technological advancements shaping the future market landscape.
Melamine Formaldehyde Industry Segmentation
-
1. Type
- 1.1. Iso-butylated Melamine Formaldehyde Resin
- 1.2. n-butylated Melamine Formaldehyde Resin
- 1.3. Other Types
-
2. Application
- 2.1. Laminates
- 2.2. Wood Adhesives
- 2.3. Molding Compounds
- 2.4. Paints and Coatings
- 2.5. Other Applications
Melamine Formaldehyde Industry Segmentation By Geography
-
1. Asia Pacific
- 1.1. China
- 1.2. India
- 1.3. Japan
- 1.4. South Korea
- 1.5. Rest of Asia Pacific
-
2. North America
- 2.1. United States
- 2.2. Canada
- 2.3. Mexico
-
3. Europe
- 3.1. Germany
- 3.2. United Kingdom
- 3.3. France
- 3.4. Italy
- 3.5. Rest of Europe
-
4. South America
- 4.1. Brazil
- 4.2. Argentina
- 4.3. Rest of South America
-
5. Middle East and Africa
- 5.1. Saudi Arabia
- 5.2. South Africa
- 5.3. Rest of Middle East and Africa
Melamine Formaldehyde Industry REPORT HIGHLIGHTS
| Aspects | Details |
|---|---|
| Study Period | 2019-2033 |
| Base Year | 2024 |
| Estimated Year | 2025 |
| Forecast Period | 2025-2033 |
| Historical Period | 2019-2024 |
| Growth Rate | CAGR of 5.54% from 2019-2033 |
| Segmentation |
|
Table of Contents
- 1. Introduction
- 1.1. Research Scope
- 1.2. Market Segmentation
- 1.3. Research Methodology
- 1.4. Definitions and Assumptions
- 2. Executive Summary
- 2.1. Introduction
- 3. Market Dynamics
- 3.1. Introduction
- 3.2. Market Drivers
- 3.2.1. Growing Demand for Formica Laminated Furniture; Growth in the Construction Industry; Other Drivers
- 3.3. Market Restrains
- 3.3.1. Decline in the Automotive Industry; Other Restraints
- 3.4. Market Trends
- 3.4.1. Laminates Segment to Dominate the Market
- 4. Market Factor Analysis
- 4.1. Porters Five Forces
- 4.2. Supply/Value Chain
- 4.3. PESTEL analysis
- 4.4. Market Entropy
- 4.5. Patent/Trademark Analysis
- 5. Global Melamine Formaldehyde Industry Analysis, Insights and Forecast, 2019-2031
- 5.1. Market Analysis, Insights and Forecast - by Type
- 5.1.1. Iso-butylated Melamine Formaldehyde Resin
- 5.1.2. n-butylated Melamine Formaldehyde Resin
- 5.1.3. Other Types
- 5.2. Market Analysis, Insights and Forecast - by Application
- 5.2.1. Laminates
- 5.2.2. Wood Adhesives
- 5.2.3. Molding Compounds
- 5.2.4. Paints and Coatings
- 5.2.5. Other Applications
- 5.3. Market Analysis, Insights and Forecast - by Region
- 5.3.1. Asia Pacific
- 5.3.2. North America
- 5.3.3. Europe
- 5.3.4. South America
- 5.3.5. Middle East and Africa
- 5.1. Market Analysis, Insights and Forecast - by Type
- 6. Asia Pacific Melamine Formaldehyde Industry Analysis, Insights and Forecast, 2019-2031
- 6.1. Market Analysis, Insights and Forecast - by Type
- 6.1.1. Iso-butylated Melamine Formaldehyde Resin
- 6.1.2. n-butylated Melamine Formaldehyde Resin
- 6.1.3. Other Types
- 6.2. Market Analysis, Insights and Forecast - by Application
- 6.2.1. Laminates
- 6.2.2. Wood Adhesives
- 6.2.3. Molding Compounds
- 6.2.4. Paints and Coatings
- 6.2.5. Other Applications
- 6.1. Market Analysis, Insights and Forecast - by Type
- 7. North America Melamine Formaldehyde Industry Analysis, Insights and Forecast, 2019-2031
- 7.1. Market Analysis, Insights and Forecast - by Type
- 7.1.1. Iso-butylated Melamine Formaldehyde Resin
- 7.1.2. n-butylated Melamine Formaldehyde Resin
- 7.1.3. Other Types
- 7.2. Market Analysis, Insights and Forecast - by Application
- 7.2.1. Laminates
- 7.2.2. Wood Adhesives
- 7.2.3. Molding Compounds
- 7.2.4. Paints and Coatings
- 7.2.5. Other Applications
- 7.1. Market Analysis, Insights and Forecast - by Type
- 8. Europe Melamine Formaldehyde Industry Analysis, Insights and Forecast, 2019-2031
- 8.1. Market Analysis, Insights and Forecast - by Type
- 8.1.1. Iso-butylated Melamine Formaldehyde Resin
- 8.1.2. n-butylated Melamine Formaldehyde Resin
- 8.1.3. Other Types
- 8.2. Market Analysis, Insights and Forecast - by Application
- 8.2.1. Laminates
- 8.2.2. Wood Adhesives
- 8.2.3. Molding Compounds
- 8.2.4. Paints and Coatings
- 8.2.5. Other Applications
- 8.1. Market Analysis, Insights and Forecast - by Type
- 9. South America Melamine Formaldehyde Industry Analysis, Insights and Forecast, 2019-2031
- 9.1. Market Analysis, Insights and Forecast - by Type
- 9.1.1. Iso-butylated Melamine Formaldehyde Resin
- 9.1.2. n-butylated Melamine Formaldehyde Resin
- 9.1.3. Other Types
- 9.2. Market Analysis, Insights and Forecast - by Application
- 9.2.1. Laminates
- 9.2.2. Wood Adhesives
- 9.2.3. Molding Compounds
- 9.2.4. Paints and Coatings
- 9.2.5. Other Applications
- 9.1. Market Analysis, Insights and Forecast - by Type
- 10. Middle East and Africa Melamine Formaldehyde Industry Analysis, Insights and Forecast, 2019-2031
- 10.1. Market Analysis, Insights and Forecast - by Type
- 10.1.1. Iso-butylated Melamine Formaldehyde Resin
- 10.1.2. n-butylated Melamine Formaldehyde Resin
- 10.1.3. Other Types
- 10.2. Market Analysis, Insights and Forecast - by Application
- 10.2.1. Laminates
- 10.2.2. Wood Adhesives
- 10.2.3. Molding Compounds
- 10.2.4. Paints and Coatings
- 10.2.5. Other Applications
- 10.1. Market Analysis, Insights and Forecast - by Type
- 11. North America Melamine Formaldehyde Industry Analysis, Insights and Forecast, 2019-2031
- 11.1. Market Analysis, Insights and Forecast - By Country/Sub-region
- 11.1.1 United States
- 11.1.2 Canada
- 11.1.3 Mexico
- 12. Europe Melamine Formaldehyde Industry Analysis, Insights and Forecast, 2019-2031
- 12.1. Market Analysis, Insights and Forecast - By Country/Sub-region
- 12.1.1 Germany
- 12.1.2 France
- 12.1.3 Italy
- 12.1.4 United Kingdom
- 12.1.5 Netherlands
- 12.1.6 Rest of Europe
- 13. Asia Pacific Melamine Formaldehyde Industry Analysis, Insights and Forecast, 2019-2031
- 13.1. Market Analysis, Insights and Forecast - By Country/Sub-region
- 13.1.1 China
- 13.1.2 Japan
- 13.1.3 India
- 13.1.4 South Korea
- 13.1.5 Taiwan
- 13.1.6 Australia
- 13.1.7 Rest of Asia-Pacific
- 14. South America Melamine Formaldehyde Industry Analysis, Insights and Forecast, 2019-2031
- 14.1. Market Analysis, Insights and Forecast - By Country/Sub-region
- 14.1.1 Brazil
- 14.1.2 Argentina
- 14.1.3 Rest of South America
- 15. MEA Melamine Formaldehyde Industry Analysis, Insights and Forecast, 2019-2031
- 15.1. Market Analysis, Insights and Forecast - By Country/Sub-region
- 15.1.1 Middle East
- 15.1.2 Africa
- 16. Competitive Analysis
- 16.1. Global Market Share Analysis 2024
- 16.2. Company Profiles
- 16.2.1 Frati Luigi S p A
- 16.2.1.1. Overview
- 16.2.1.2. Products
- 16.2.1.3. SWOT Analysis
- 16.2.1.4. Recent Developments
- 16.2.1.5. Financials (Based on Availability)
- 16.2.2 Sprea Misr*List Not Exhaustive
- 16.2.2.1. Overview
- 16.2.2.2. Products
- 16.2.2.3. SWOT Analysis
- 16.2.2.4. Recent Developments
- 16.2.2.5. Financials (Based on Availability)
- 16.2.3 Pacific Texchem Private Limited
- 16.2.3.1. Overview
- 16.2.3.2. Products
- 16.2.3.3. SWOT Analysis
- 16.2.3.4. Recent Developments
- 16.2.3.5. Financials (Based on Availability)
- 16.2.4 BASF SE
- 16.2.4.1. Overview
- 16.2.4.2. Products
- 16.2.4.3. SWOT Analysis
- 16.2.4.4. Recent Developments
- 16.2.4.5. Financials (Based on Availability)
- 16.2.5 Allnex GMBH
- 16.2.5.1. Overview
- 16.2.5.2. Products
- 16.2.5.3. SWOT Analysis
- 16.2.5.4. Recent Developments
- 16.2.5.5. Financials (Based on Availability)
- 16.2.6 Hexion
- 16.2.6.1. Overview
- 16.2.6.2. Products
- 16.2.6.3. SWOT Analysis
- 16.2.6.4. Recent Developments
- 16.2.6.5. Financials (Based on Availability)
- 16.2.7 Metadynea Metafrax Group
- 16.2.7.1. Overview
- 16.2.7.2. Products
- 16.2.7.3. SWOT Analysis
- 16.2.7.4. Recent Developments
- 16.2.7.5. Financials (Based on Availability)
- 16.2.8 AkzoNobel NV
- 16.2.8.1. Overview
- 16.2.8.2. Products
- 16.2.8.3. SWOT Analysis
- 16.2.8.4. Recent Developments
- 16.2.8.5. Financials (Based on Availability)
- 16.2.9 Arclin Inc
- 16.2.9.1. Overview
- 16.2.9.2. Products
- 16.2.9.3. SWOT Analysis
- 16.2.9.4. Recent Developments
- 16.2.9.5. Financials (Based on Availability)
- 16.2.10 Cornerstone Chemical
- 16.2.10.1. Overview
- 16.2.10.2. Products
- 16.2.10.3. SWOT Analysis
- 16.2.10.4. Recent Developments
- 16.2.10.5. Financials (Based on Availability)
- 16.2.1 Frati Luigi S p A
List of Figures
- Figure 1: Global Melamine Formaldehyde Industry Revenue Breakdown (Million, %) by Region 2024 & 2032
- Figure 2: Global Melamine Formaldehyde Industry Volume Breakdown (K Tons, %) by Region 2024 & 2032
- Figure 3: North America Melamine Formaldehyde Industry Revenue (Million), by Country 2024 & 2032
- Figure 4: North America Melamine Formaldehyde Industry Volume (K Tons), by Country 2024 & 2032
- Figure 5: North America Melamine Formaldehyde Industry Revenue Share (%), by Country 2024 & 2032
- Figure 6: North America Melamine Formaldehyde Industry Volume Share (%), by Country 2024 & 2032
- Figure 7: Europe Melamine Formaldehyde Industry Revenue (Million), by Country 2024 & 2032
- Figure 8: Europe Melamine Formaldehyde Industry Volume (K Tons), by Country 2024 & 2032
- Figure 9: Europe Melamine Formaldehyde Industry Revenue Share (%), by Country 2024 & 2032
- Figure 10: Europe Melamine Formaldehyde Industry Volume Share (%), by Country 2024 & 2032
- Figure 11: Asia Pacific Melamine Formaldehyde Industry Revenue (Million), by Country 2024 & 2032
- Figure 12: Asia Pacific Melamine Formaldehyde Industry Volume (K Tons), by Country 2024 & 2032
- Figure 13: Asia Pacific Melamine Formaldehyde Industry Revenue Share (%), by Country 2024 & 2032
- Figure 14: Asia Pacific Melamine Formaldehyde Industry Volume Share (%), by Country 2024 & 2032
- Figure 15: South America Melamine Formaldehyde Industry Revenue (Million), by Country 2024 & 2032
- Figure 16: South America Melamine Formaldehyde Industry Volume (K Tons), by Country 2024 & 2032
- Figure 17: South America Melamine Formaldehyde Industry Revenue Share (%), by Country 2024 & 2032
- Figure 18: South America Melamine Formaldehyde Industry Volume Share (%), by Country 2024 & 2032
- Figure 19: MEA Melamine Formaldehyde Industry Revenue (Million), by Country 2024 & 2032
- Figure 20: MEA Melamine Formaldehyde Industry Volume (K Tons), by Country 2024 & 2032
- Figure 21: MEA Melamine Formaldehyde Industry Revenue Share (%), by Country 2024 & 2032
- Figure 22: MEA Melamine Formaldehyde Industry Volume Share (%), by Country 2024 & 2032
- Figure 23: Asia Pacific Melamine Formaldehyde Industry Revenue (Million), by Type 2024 & 2032
- Figure 24: Asia Pacific Melamine Formaldehyde Industry Volume (K Tons), by Type 2024 & 2032
- Figure 25: Asia Pacific Melamine Formaldehyde Industry Revenue Share (%), by Type 2024 & 2032
- Figure 26: Asia Pacific Melamine Formaldehyde Industry Volume Share (%), by Type 2024 & 2032
- Figure 27: Asia Pacific Melamine Formaldehyde Industry Revenue (Million), by Application 2024 & 2032
- Figure 28: Asia Pacific Melamine Formaldehyde Industry Volume (K Tons), by Application 2024 & 2032
- Figure 29: Asia Pacific Melamine Formaldehyde Industry Revenue Share (%), by Application 2024 & 2032
- Figure 30: Asia Pacific Melamine Formaldehyde Industry Volume Share (%), by Application 2024 & 2032
- Figure 31: Asia Pacific Melamine Formaldehyde Industry Revenue (Million), by Country 2024 & 2032
- Figure 32: Asia Pacific Melamine Formaldehyde Industry Volume (K Tons), by Country 2024 & 2032
- Figure 33: Asia Pacific Melamine Formaldehyde Industry Revenue Share (%), by Country 2024 & 2032
- Figure 34: Asia Pacific Melamine Formaldehyde Industry Volume Share (%), by Country 2024 & 2032
- Figure 35: North America Melamine Formaldehyde Industry Revenue (Million), by Type 2024 & 2032
- Figure 36: North America Melamine Formaldehyde Industry Volume (K Tons), by Type 2024 & 2032
- Figure 37: North America Melamine Formaldehyde Industry Revenue Share (%), by Type 2024 & 2032
- Figure 38: North America Melamine Formaldehyde Industry Volume Share (%), by Type 2024 & 2032
- Figure 39: North America Melamine Formaldehyde Industry Revenue (Million), by Application 2024 & 2032
- Figure 40: North America Melamine Formaldehyde Industry Volume (K Tons), by Application 2024 & 2032
- Figure 41: North America Melamine Formaldehyde Industry Revenue Share (%), by Application 2024 & 2032
- Figure 42: North America Melamine Formaldehyde Industry Volume Share (%), by Application 2024 & 2032
- Figure 43: North America Melamine Formaldehyde Industry Revenue (Million), by Country 2024 & 2032
- Figure 44: North America Melamine Formaldehyde Industry Volume (K Tons), by Country 2024 & 2032
- Figure 45: North America Melamine Formaldehyde Industry Revenue Share (%), by Country 2024 & 2032
- Figure 46: North America Melamine Formaldehyde Industry Volume Share (%), by Country 2024 & 2032
- Figure 47: Europe Melamine Formaldehyde Industry Revenue (Million), by Type 2024 & 2032
- Figure 48: Europe Melamine Formaldehyde Industry Volume (K Tons), by Type 2024 & 2032
- Figure 49: Europe Melamine Formaldehyde Industry Revenue Share (%), by Type 2024 & 2032
- Figure 50: Europe Melamine Formaldehyde Industry Volume Share (%), by Type 2024 & 2032
- Figure 51: Europe Melamine Formaldehyde Industry Revenue (Million), by Application 2024 & 2032
- Figure 52: Europe Melamine Formaldehyde Industry Volume (K Tons), by Application 2024 & 2032
- Figure 53: Europe Melamine Formaldehyde Industry Revenue Share (%), by Application 2024 & 2032
- Figure 54: Europe Melamine Formaldehyde Industry Volume Share (%), by Application 2024 & 2032
- Figure 55: Europe Melamine Formaldehyde Industry Revenue (Million), by Country 2024 & 2032
- Figure 56: Europe Melamine Formaldehyde Industry Volume (K Tons), by Country 2024 & 2032
- Figure 57: Europe Melamine Formaldehyde Industry Revenue Share (%), by Country 2024 & 2032
- Figure 58: Europe Melamine Formaldehyde Industry Volume Share (%), by Country 2024 & 2032
- Figure 59: South America Melamine Formaldehyde Industry Revenue (Million), by Type 2024 & 2032
- Figure 60: South America Melamine Formaldehyde Industry Volume (K Tons), by Type 2024 & 2032
- Figure 61: South America Melamine Formaldehyde Industry Revenue Share (%), by Type 2024 & 2032
- Figure 62: South America Melamine Formaldehyde Industry Volume Share (%), by Type 2024 & 2032
- Figure 63: South America Melamine Formaldehyde Industry Revenue (Million), by Application 2024 & 2032
- Figure 64: South America Melamine Formaldehyde Industry Volume (K Tons), by Application 2024 & 2032
- Figure 65: South America Melamine Formaldehyde Industry Revenue Share (%), by Application 2024 & 2032
- Figure 66: South America Melamine Formaldehyde Industry Volume Share (%), by Application 2024 & 2032
- Figure 67: South America Melamine Formaldehyde Industry Revenue (Million), by Country 2024 & 2032
- Figure 68: South America Melamine Formaldehyde Industry Volume (K Tons), by Country 2024 & 2032
- Figure 69: South America Melamine Formaldehyde Industry Revenue Share (%), by Country 2024 & 2032
- Figure 70: South America Melamine Formaldehyde Industry Volume Share (%), by Country 2024 & 2032
- Figure 71: Middle East and Africa Melamine Formaldehyde Industry Revenue (Million), by Type 2024 & 2032
- Figure 72: Middle East and Africa Melamine Formaldehyde Industry Volume (K Tons), by Type 2024 & 2032
- Figure 73: Middle East and Africa Melamine Formaldehyde Industry Revenue Share (%), by Type 2024 & 2032
- Figure 74: Middle East and Africa Melamine Formaldehyde Industry Volume Share (%), by Type 2024 & 2032
- Figure 75: Middle East and Africa Melamine Formaldehyde Industry Revenue (Million), by Application 2024 & 2032
- Figure 76: Middle East and Africa Melamine Formaldehyde Industry Volume (K Tons), by Application 2024 & 2032
- Figure 77: Middle East and Africa Melamine Formaldehyde Industry Revenue Share (%), by Application 2024 & 2032
- Figure 78: Middle East and Africa Melamine Formaldehyde Industry Volume Share (%), by Application 2024 & 2032
- Figure 79: Middle East and Africa Melamine Formaldehyde Industry Revenue (Million), by Country 2024 & 2032
- Figure 80: Middle East and Africa Melamine Formaldehyde Industry Volume (K Tons), by Country 2024 & 2032
- Figure 81: Middle East and Africa Melamine Formaldehyde Industry Revenue Share (%), by Country 2024 & 2032
- Figure 82: Middle East and Africa Melamine Formaldehyde Industry Volume Share (%), by Country 2024 & 2032
List of Tables
- Table 1: Global Melamine Formaldehyde Industry Revenue Million Forecast, by Region 2019 & 2032
- Table 2: Global Melamine Formaldehyde Industry Volume K Tons Forecast, by Region 2019 & 2032
- Table 3: Global Melamine Formaldehyde Industry Revenue Million Forecast, by Type 2019 & 2032
- Table 4: Global Melamine Formaldehyde Industry Volume K Tons Forecast, by Type 2019 & 2032
- Table 5: Global Melamine Formaldehyde Industry Revenue Million Forecast, by Application 2019 & 2032
- Table 6: Global Melamine Formaldehyde Industry Volume K Tons Forecast, by Application 2019 & 2032
- Table 7: Global Melamine Formaldehyde Industry Revenue Million Forecast, by Region 2019 & 2032
- Table 8: Global Melamine Formaldehyde Industry Volume K Tons Forecast, by Region 2019 & 2032
- Table 9: Global Melamine Formaldehyde Industry Revenue Million Forecast, by Country 2019 & 2032
- Table 10: Global Melamine Formaldehyde Industry Volume K Tons Forecast, by Country 2019 & 2032
- Table 11: United States Melamine Formaldehyde Industry Revenue (Million) Forecast, by Application 2019 & 2032
- Table 12: United States Melamine Formaldehyde Industry Volume (K Tons) Forecast, by Application 2019 & 2032
- Table 13: Canada Melamine Formaldehyde Industry Revenue (Million) Forecast, by Application 2019 & 2032
- Table 14: Canada Melamine Formaldehyde Industry Volume (K Tons) Forecast, by Application 2019 & 2032
- Table 15: Mexico Melamine Formaldehyde Industry Revenue (Million) Forecast, by Application 2019 & 2032
- Table 16: Mexico Melamine Formaldehyde Industry Volume (K Tons) Forecast, by Application 2019 & 2032
- Table 17: Global Melamine Formaldehyde Industry Revenue Million Forecast, by Country 2019 & 2032
- Table 18: Global Melamine Formaldehyde Industry Volume K Tons Forecast, by Country 2019 & 2032
- Table 19: Germany Melamine Formaldehyde Industry Revenue (Million) Forecast, by Application 2019 & 2032
- Table 20: Germany Melamine Formaldehyde Industry Volume (K Tons) Forecast, by Application 2019 & 2032
- Table 21: France Melamine Formaldehyde Industry Revenue (Million) Forecast, by Application 2019 & 2032
- Table 22: France Melamine Formaldehyde Industry Volume (K Tons) Forecast, by Application 2019 & 2032
- Table 23: Italy Melamine Formaldehyde Industry Revenue (Million) Forecast, by Application 2019 & 2032
- Table 24: Italy Melamine Formaldehyde Industry Volume (K Tons) Forecast, by Application 2019 & 2032
- Table 25: United Kingdom Melamine Formaldehyde Industry Revenue (Million) Forecast, by Application 2019 & 2032
- Table 26: United Kingdom Melamine Formaldehyde Industry Volume (K Tons) Forecast, by Application 2019 & 2032
- Table 27: Netherlands Melamine Formaldehyde Industry Revenue (Million) Forecast, by Application 2019 & 2032
- Table 28: Netherlands Melamine Formaldehyde Industry Volume (K Tons) Forecast, by Application 2019 & 2032
- Table 29: Rest of Europe Melamine Formaldehyde Industry Revenue (Million) Forecast, by Application 2019 & 2032
- Table 30: Rest of Europe Melamine Formaldehyde Industry Volume (K Tons) Forecast, by Application 2019 & 2032
- Table 31: Global Melamine Formaldehyde Industry Revenue Million Forecast, by Country 2019 & 2032
- Table 32: Global Melamine Formaldehyde Industry Volume K Tons Forecast, by Country 2019 & 2032
- Table 33: China Melamine Formaldehyde Industry Revenue (Million) Forecast, by Application 2019 & 2032
- Table 34: China Melamine Formaldehyde Industry Volume (K Tons) Forecast, by Application 2019 & 2032
- Table 35: Japan Melamine Formaldehyde Industry Revenue (Million) Forecast, by Application 2019 & 2032
- Table 36: Japan Melamine Formaldehyde Industry Volume (K Tons) Forecast, by Application 2019 & 2032
- Table 37: India Melamine Formaldehyde Industry Revenue (Million) Forecast, by Application 2019 & 2032
- Table 38: India Melamine Formaldehyde Industry Volume (K Tons) Forecast, by Application 2019 & 2032
- Table 39: South Korea Melamine Formaldehyde Industry Revenue (Million) Forecast, by Application 2019 & 2032
- Table 40: South Korea Melamine Formaldehyde Industry Volume (K Tons) Forecast, by Application 2019 & 2032
- Table 41: Taiwan Melamine Formaldehyde Industry Revenue (Million) Forecast, by Application 2019 & 2032
- Table 42: Taiwan Melamine Formaldehyde Industry Volume (K Tons) Forecast, by Application 2019 & 2032
- Table 43: Australia Melamine Formaldehyde Industry Revenue (Million) Forecast, by Application 2019 & 2032
- Table 44: Australia Melamine Formaldehyde Industry Volume (K Tons) Forecast, by Application 2019 & 2032
- Table 45: Rest of Asia-Pacific Melamine Formaldehyde Industry Revenue (Million) Forecast, by Application 2019 & 2032
- Table 46: Rest of Asia-Pacific Melamine Formaldehyde Industry Volume (K Tons) Forecast, by Application 2019 & 2032
- Table 47: Global Melamine Formaldehyde Industry Revenue Million Forecast, by Country 2019 & 2032
- Table 48: Global Melamine Formaldehyde Industry Volume K Tons Forecast, by Country 2019 & 2032
- Table 49: Brazil Melamine Formaldehyde Industry Revenue (Million) Forecast, by Application 2019 & 2032
- Table 50: Brazil Melamine Formaldehyde Industry Volume (K Tons) Forecast, by Application 2019 & 2032
- Table 51: Argentina Melamine Formaldehyde Industry Revenue (Million) Forecast, by Application 2019 & 2032
- Table 52: Argentina Melamine Formaldehyde Industry Volume (K Tons) Forecast, by Application 2019 & 2032
- Table 53: Rest of South America Melamine Formaldehyde Industry Revenue (Million) Forecast, by Application 2019 & 2032
- Table 54: Rest of South America Melamine Formaldehyde Industry Volume (K Tons) Forecast, by Application 2019 & 2032
- Table 55: Global Melamine Formaldehyde Industry Revenue Million Forecast, by Country 2019 & 2032
- Table 56: Global Melamine Formaldehyde Industry Volume K Tons Forecast, by Country 2019 & 2032
- Table 57: Middle East Melamine Formaldehyde Industry Revenue (Million) Forecast, by Application 2019 & 2032
- Table 58: Middle East Melamine Formaldehyde Industry Volume (K Tons) Forecast, by Application 2019 & 2032
- Table 59: Africa Melamine Formaldehyde Industry Revenue (Million) Forecast, by Application 2019 & 2032
- Table 60: Africa Melamine Formaldehyde Industry Volume (K Tons) Forecast, by Application 2019 & 2032
- Table 61: Global Melamine Formaldehyde Industry Revenue Million Forecast, by Type 2019 & 2032
- Table 62: Global Melamine Formaldehyde Industry Volume K Tons Forecast, by Type 2019 & 2032
- Table 63: Global Melamine Formaldehyde Industry Revenue Million Forecast, by Application 2019 & 2032
- Table 64: Global Melamine Formaldehyde Industry Volume K Tons Forecast, by Application 2019 & 2032
- Table 65: Global Melamine Formaldehyde Industry Revenue Million Forecast, by Country 2019 & 2032
- Table 66: Global Melamine Formaldehyde Industry Volume K Tons Forecast, by Country 2019 & 2032
- Table 67: China Melamine Formaldehyde Industry Revenue (Million) Forecast, by Application 2019 & 2032
- Table 68: China Melamine Formaldehyde Industry Volume (K Tons) Forecast, by Application 2019 & 2032
- Table 69: India Melamine Formaldehyde Industry Revenue (Million) Forecast, by Application 2019 & 2032
- Table 70: India Melamine Formaldehyde Industry Volume (K Tons) Forecast, by Application 2019 & 2032
- Table 71: Japan Melamine Formaldehyde Industry Revenue (Million) Forecast, by Application 2019 & 2032
- Table 72: Japan Melamine Formaldehyde Industry Volume (K Tons) Forecast, by Application 2019 & 2032
- Table 73: South Korea Melamine Formaldehyde Industry Revenue (Million) Forecast, by Application 2019 & 2032
- Table 74: South Korea Melamine Formaldehyde Industry Volume (K Tons) Forecast, by Application 2019 & 2032
- Table 75: Rest of Asia Pacific Melamine Formaldehyde Industry Revenue (Million) Forecast, by Application 2019 & 2032
- Table 76: Rest of Asia Pacific Melamine Formaldehyde Industry Volume (K Tons) Forecast, by Application 2019 & 2032
- Table 77: Global Melamine Formaldehyde Industry Revenue Million Forecast, by Type 2019 & 2032
- Table 78: Global Melamine Formaldehyde Industry Volume K Tons Forecast, by Type 2019 & 2032
- Table 79: Global Melamine Formaldehyde Industry Revenue Million Forecast, by Application 2019 & 2032
- Table 80: Global Melamine Formaldehyde Industry Volume K Tons Forecast, by Application 2019 & 2032
- Table 81: Global Melamine Formaldehyde Industry Revenue Million Forecast, by Country 2019 & 2032
- Table 82: Global Melamine Formaldehyde Industry Volume K Tons Forecast, by Country 2019 & 2032
- Table 83: United States Melamine Formaldehyde Industry Revenue (Million) Forecast, by Application 2019 & 2032
- Table 84: United States Melamine Formaldehyde Industry Volume (K Tons) Forecast, by Application 2019 & 2032
- Table 85: Canada Melamine Formaldehyde Industry Revenue (Million) Forecast, by Application 2019 & 2032
- Table 86: Canada Melamine Formaldehyde Industry Volume (K Tons) Forecast, by Application 2019 & 2032
- Table 87: Mexico Melamine Formaldehyde Industry Revenue (Million) Forecast, by Application 2019 & 2032
- Table 88: Mexico Melamine Formaldehyde Industry Volume (K Tons) Forecast, by Application 2019 & 2032
- Table 89: Global Melamine Formaldehyde Industry Revenue Million Forecast, by Type 2019 & 2032
- Table 90: Global Melamine Formaldehyde Industry Volume K Tons Forecast, by Type 2019 & 2032
- Table 91: Global Melamine Formaldehyde Industry Revenue Million Forecast, by Application 2019 & 2032
- Table 92: Global Melamine Formaldehyde Industry Volume K Tons Forecast, by Application 2019 & 2032
- Table 93: Global Melamine Formaldehyde Industry Revenue Million Forecast, by Country 2019 & 2032
- Table 94: Global Melamine Formaldehyde Industry Volume K Tons Forecast, by Country 2019 & 2032
- Table 95: Germany Melamine Formaldehyde Industry Revenue (Million) Forecast, by Application 2019 & 2032
- Table 96: Germany Melamine Formaldehyde Industry Volume (K Tons) Forecast, by Application 2019 & 2032
- Table 97: United Kingdom Melamine Formaldehyde Industry Revenue (Million) Forecast, by Application 2019 & 2032
- Table 98: United Kingdom Melamine Formaldehyde Industry Volume (K Tons) Forecast, by Application 2019 & 2032
- Table 99: France Melamine Formaldehyde Industry Revenue (Million) Forecast, by Application 2019 & 2032
- Table 100: France Melamine Formaldehyde Industry Volume (K Tons) Forecast, by Application 2019 & 2032
- Table 101: Italy Melamine Formaldehyde Industry Revenue (Million) Forecast, by Application 2019 & 2032
- Table 102: Italy Melamine Formaldehyde Industry Volume (K Tons) Forecast, by Application 2019 & 2032
- Table 103: Rest of Europe Melamine Formaldehyde Industry Revenue (Million) Forecast, by Application 2019 & 2032
- Table 104: Rest of Europe Melamine Formaldehyde Industry Volume (K Tons) Forecast, by Application 2019 & 2032
- Table 105: Global Melamine Formaldehyde Industry Revenue Million Forecast, by Type 2019 & 2032
- Table 106: Global Melamine Formaldehyde Industry Volume K Tons Forecast, by Type 2019 & 2032
- Table 107: Global Melamine Formaldehyde Industry Revenue Million Forecast, by Application 2019 & 2032
- Table 108: Global Melamine Formaldehyde Industry Volume K Tons Forecast, by Application 2019 & 2032
- Table 109: Global Melamine Formaldehyde Industry Revenue Million Forecast, by Country 2019 & 2032
- Table 110: Global Melamine Formaldehyde Industry Volume K Tons Forecast, by Country 2019 & 2032
- Table 111: Brazil Melamine Formaldehyde Industry Revenue (Million) Forecast, by Application 2019 & 2032
- Table 112: Brazil Melamine Formaldehyde Industry Volume (K Tons) Forecast, by Application 2019 & 2032
- Table 113: Argentina Melamine Formaldehyde Industry Revenue (Million) Forecast, by Application 2019 & 2032
- Table 114: Argentina Melamine Formaldehyde Industry Volume (K Tons) Forecast, by Application 2019 & 2032
- Table 115: Rest of South America Melamine Formaldehyde Industry Revenue (Million) Forecast, by Application 2019 & 2032
- Table 116: Rest of South America Melamine Formaldehyde Industry Volume (K Tons) Forecast, by Application 2019 & 2032
- Table 117: Global Melamine Formaldehyde Industry Revenue Million Forecast, by Type 2019 & 2032
- Table 118: Global Melamine Formaldehyde Industry Volume K Tons Forecast, by Type 2019 & 2032
- Table 119: Global Melamine Formaldehyde Industry Revenue Million Forecast, by Application 2019 & 2032
- Table 120: Global Melamine Formaldehyde Industry Volume K Tons Forecast, by Application 2019 & 2032
- Table 121: Global Melamine Formaldehyde Industry Revenue Million Forecast, by Country 2019 & 2032
- Table 122: Global Melamine Formaldehyde Industry Volume K Tons Forecast, by Country 2019 & 2032
- Table 123: Saudi Arabia Melamine Formaldehyde Industry Revenue (Million) Forecast, by Application 2019 & 2032
- Table 124: Saudi Arabia Melamine Formaldehyde Industry Volume (K Tons) Forecast, by Application 2019 & 2032
- Table 125: South Africa Melamine Formaldehyde Industry Revenue (Million) Forecast, by Application 2019 & 2032
- Table 126: South Africa Melamine Formaldehyde Industry Volume (K Tons) Forecast, by Application 2019 & 2032
- Table 127: Rest of Middle East and Africa Melamine Formaldehyde Industry Revenue (Million) Forecast, by Application 2019 & 2032
- Table 128: Rest of Middle East and Africa Melamine Formaldehyde Industry Volume (K Tons) Forecast, by Application 2019 & 2032
Frequently Asked Questions
1. What is the projected Compound Annual Growth Rate (CAGR) of the Melamine Formaldehyde Industry?
The projected CAGR is approximately 5.54%.
2. Which companies are prominent players in the Melamine Formaldehyde Industry?
Key companies in the market include Frati Luigi S p A, Sprea Misr*List Not Exhaustive, Pacific Texchem Private Limited, BASF SE, Allnex GMBH, Hexion, Metadynea Metafrax Group, AkzoNobel NV, Arclin Inc, Cornerstone Chemical.
3. What are the main segments of the Melamine Formaldehyde Industry?
The market segments include Type, Application.
4. Can you provide details about the market size?
The market size is estimated to be USD 791.55 Million as of 2022.
5. What are some drivers contributing to market growth?
Growing Demand for Formica Laminated Furniture; Growth in the Construction Industry; Other Drivers.
6. What are the notable trends driving market growth?
Laminates Segment to Dominate the Market.
7. Are there any restraints impacting market growth?
Decline in the Automotive Industry; Other Restraints.
8. Can you provide examples of recent developments in the market?
The recent developments about the major players in the market are being covered in the complete study.
9. What pricing options are available for accessing the report?
Pricing options include single-user, multi-user, and enterprise licenses priced at USD 3,950, USD 4,950, and USD 6,950 respectively.
10. Is the market size provided in terms of value or volume?
The market size is provided in terms of value, measured in Million and volume, measured in K Tons.
11. Are there any specific market keywords associated with the report?
Yes, the market keyword associated with the report is "Melamine Formaldehyde Industry," which aids in identifying and referencing the specific market segment covered.
12. How do I determine which pricing option suits my needs best?
The pricing options vary based on user requirements and access needs. Individual users may opt for single-user licenses, while businesses requiring broader access may choose multi-user or enterprise licenses for cost-effective access to the report.
13. Are there any additional resources or data provided in the Melamine Formaldehyde Industry report?
While the report offers comprehensive insights, it's advisable to review the specific contents or supplementary materials provided to ascertain if additional resources or data are available.
14. How can I stay updated on further developments or reports in the Melamine Formaldehyde Industry?
To stay informed about further developments, trends, and reports in the Melamine Formaldehyde Industry, consider subscribing to industry newsletters, following relevant companies and organizations, or regularly checking reputable industry news sources and publications.
Methodology
Step 1 - Identification of Relevant Samples Size from Population Database


Step 2 - Approaches for Defining Global Market Size (Value, Volume* & Price*)

Note*: In applicable scenarios
Step 3 - Data Sources
Primary Research
- Web Analytics
- Survey Reports
- Research Institute
- Latest Research Reports
- Opinion Leaders
Secondary Research
- Annual Reports
- White Paper
- Latest Press Release
- Industry Association
- Paid Database
- Investor Presentations

Step 4 - Data Triangulation
Involves using different sources of information in order to increase the validity of a study
These sources are likely to be stakeholders in a program - participants, other researchers, program staff, other community members, and so on.
Then we put all data in single framework & apply various statistical tools to find out the dynamic on the market.
During the analysis stage, feedback from the stakeholder groups would be compared to determine areas of agreement as well as areas of divergence


