
Key Insights
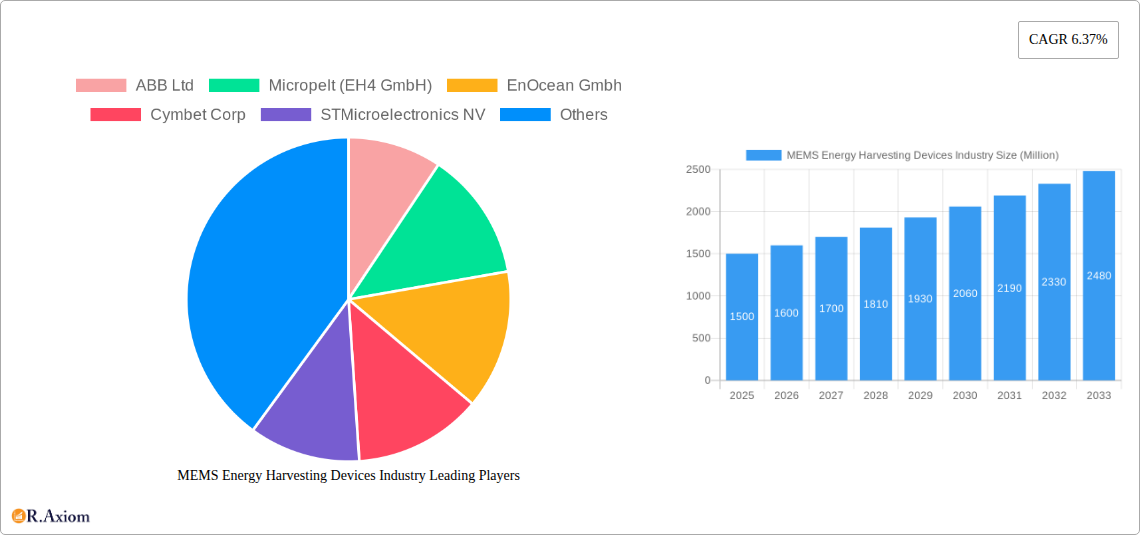
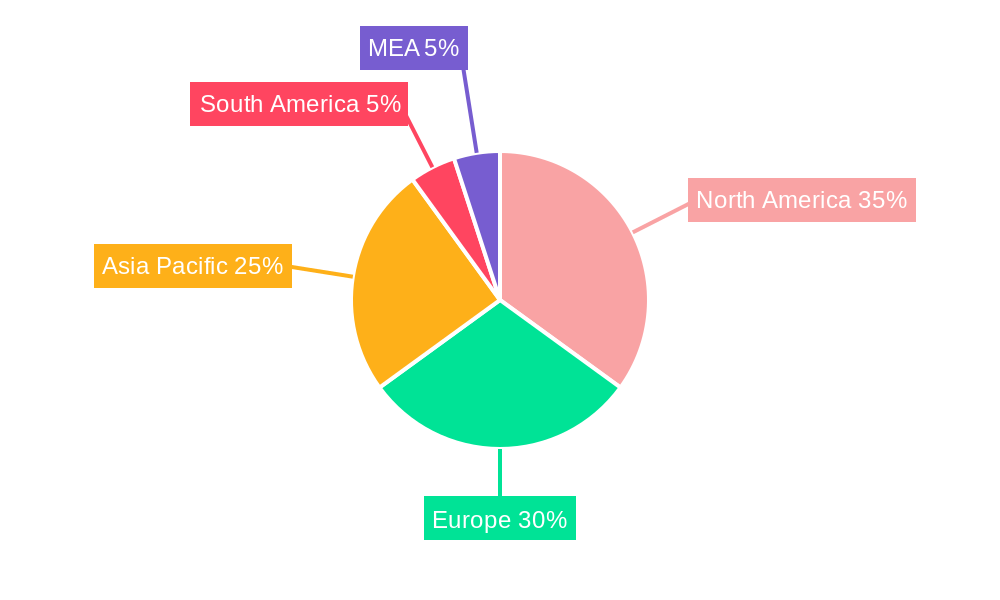
The MEMS Energy Harvesting Devices market is experiencing robust growth, driven by increasing demand for self-powered devices across diverse sectors. The market's Compound Annual Growth Rate (CAGR) of 6.37% from 2019-2024 indicates a significant upward trajectory, projected to continue through 2033. Several factors contribute to this expansion. Firstly, the automotive industry's push towards electrification and autonomous vehicles fuels the demand for miniature, efficient power sources for sensors and actuators. Secondly, the burgeoning Internet of Things (IoT) necessitates low-power, maintenance-free solutions, making MEMS energy harvesting a compelling choice for a wide range of smart devices in building automation, consumer electronics, and industrial applications. Finally, advancements in microfabrication technologies are continuously improving the energy conversion efficiency and reliability of these devices, further driving market adoption. While high initial costs associated with manufacturing and integration can pose a restraint, technological breakthroughs and economies of scale are expected to alleviate this concern over time. The market segmentation reveals that Vibration Energy Harvesting currently holds a dominant position, benefiting from its widespread applicability. However, other technologies like Thermal and RF Energy Harvesting are gaining traction, especially in niche applications. Geographically, North America and Europe are currently leading the market, however, the Asia-Pacific region, with its rapidly growing electronics manufacturing sector and increasing adoption of IoT, is poised for significant growth in the coming years.
The competitive landscape features both established players like ABB Ltd and STMicroelectronics, leveraging their expertise in semiconductor technology and industrial automation, as well as specialized companies focusing solely on MEMS energy harvesting. This competitive dynamism fosters innovation and drives down costs, further benefiting market growth. The forecast period (2025-2033) anticipates continued expansion, driven by sustained technological improvements, increasing demand from emerging markets, and the overall trend towards miniaturization and power efficiency in various electronic devices. This growth will be influenced by government initiatives promoting renewable energy and energy-efficient technologies, along with continued R&D efforts focused on improving the performance and cost-effectiveness of MEMS energy harvesting devices. The continued integration of these devices into diverse applications and improved energy storage solutions will be key drivers of future market expansion.
MEMS Energy Harvesting Devices Industry: A Comprehensive Market Report (2019-2033)
This comprehensive report provides an in-depth analysis of the MEMS Energy Harvesting Devices industry, covering market size, growth projections, competitive landscape, technological advancements, and key market trends from 2019 to 2033. The report leverages extensive primary and secondary research to offer actionable insights for industry stakeholders, investors, and businesses seeking to capitalize on the burgeoning opportunities within this dynamic sector. The study period spans 2019-2033, with 2025 serving as the base and estimated year. The forecast period covers 2025-2033, while the historical period encompasses 2019-2024. Market values are expressed in Millions.
MEMS Energy Harvesting Devices Industry Market Concentration & Innovation
This section analyzes the competitive landscape of the MEMS Energy Harvesting Devices market, examining market concentration, innovation drivers, regulatory influences, substitute products, end-user trends, and mergers and acquisitions (M&A) activity. The market is characterized by a moderately consolidated structure, with a few major players holding significant market share. However, the emergence of innovative startups is steadily increasing competition.
Market Concentration Metrics:
- Market Share of Top 5 Players: xx% (Estimated 2025)
- Herfindahl-Hirschman Index (HHI): xx (Estimated 2025)
Innovation Drivers:
- Advancements in MEMS technology leading to improved energy conversion efficiency.
- Growing demand for energy-autonomous devices in various applications.
- Increasing focus on miniaturization and low-power consumption electronics.
Regulatory Frameworks:
- Government regulations promoting energy efficiency and sustainability are driving adoption.
- Standardization efforts to enhance interoperability and market growth.
Product Substitutes:
- Traditional batteries remain a primary substitute, although MEMS energy harvesting offers advantages in specific applications.
End-User Trends:
- Growing demand for wireless sensors and IoT devices.
- Increased adoption of energy-efficient building automation systems.
M&A Activities:
- Recent M&A activity has focused on acquiring companies with specialized MEMS technologies and expanding market reach. Total M&A deal value in the last 5 years: $xx Million (estimated). Examples include strategic acquisitions to broaden product portfolios and strengthen technological capabilities.
MEMS Energy Harvesting Devices Industry Industry Trends & Insights
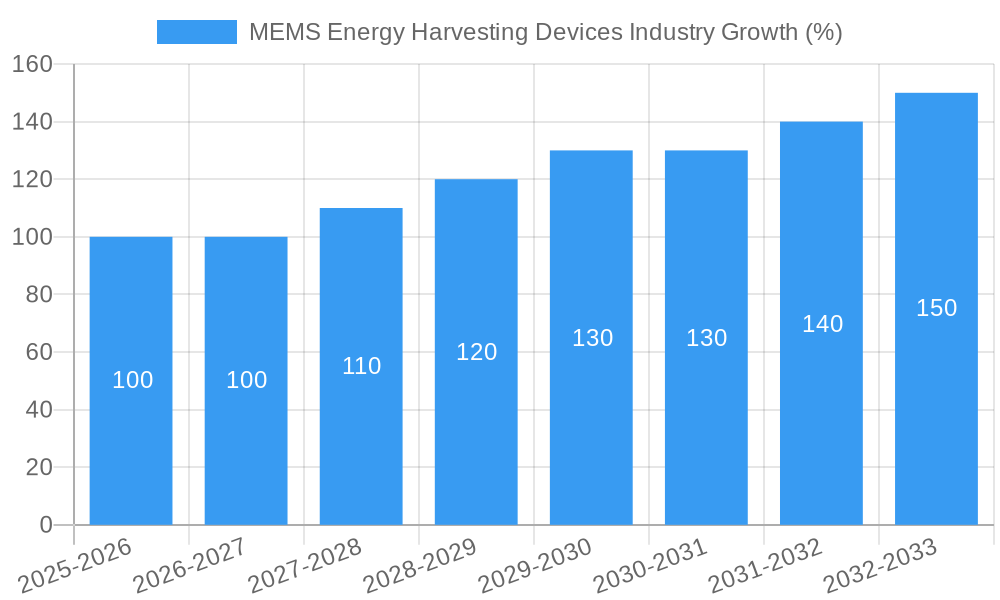
This section delves into the key trends and insights shaping the MEMS Energy Harvesting Devices market. Market growth is primarily driven by increasing demand for energy-autonomous devices across various applications, technological advancements improving energy conversion efficiency, and rising environmental concerns.
The compound annual growth rate (CAGR) is projected to be xx% during the forecast period (2025-2033). Market penetration in key end-user segments, such as automotive and industrial applications, is steadily increasing, owing to the advantages of reduced maintenance and extended device lifespan. Consumer preferences towards smaller, more energy-efficient devices are also contributing significantly to market growth. The competitive landscape is dynamic, with established players and innovative startups vying for market share. Technological disruptions, such as the development of novel energy harvesting materials and improved energy storage solutions, will further influence market dynamics.
Dominant Markets & Segments in MEMS Energy Harvesting Devices Industry
This section identifies the leading regions, countries, and segments within the MEMS Energy Harvesting Devices market.
By Technology:
- Vibration Energy Harvesting: This segment is expected to dominate due to the prevalence of vibration sources in various applications. Key drivers include advancements in piezoelectric and electromagnetic technologies.
- Thermal Energy Harvesting: This segment is showing steady growth, driven by increased adoption in waste heat recovery applications. Technological advancements in thermoelectric generators are expected to fuel further growth.
- RF Energy Harvesting: Growth in this segment is driven by the increasing demand for wireless sensor networks and IoT devices. However, challenges related to efficiency and range limitations need to be addressed.
- Other Types of Energy Harvesting: This segment includes technologies like solar energy harvesting, which are also experiencing growth.
By End-user Applications:
- Automotive: The automotive sector is a significant market driver, with applications ranging from tire pressure monitoring systems to advanced driver-assistance systems (ADAS). Stringent emission regulations are accelerating the adoption of energy-efficient solutions.
- Industrial: The industrial sector presents significant opportunities for MEMS energy harvesting, with applications in industrial automation, asset monitoring, and predictive maintenance.
- Military and Aerospace: This segment demands high reliability and robust performance, driving the development of advanced MEMS energy harvesting technologies.
- Building and Home Automation: Energy-efficient smart homes and buildings are driving the demand for MEMS energy harvesting in these applications.
- Consumer Electronics: Miniaturization and low-power consumption requirements are driving adoption in wearable electronics and other consumer devices.
- Other End-user Applications: This segment encompasses a variety of niche applications including medical devices and environmental monitoring.
North America is currently the leading region due to the high adoption rate of advanced technologies and the presence of key players. However, the Asia-Pacific region is expected to experience significant growth in the coming years.
MEMS Energy Harvesting Devices Industry Product Developments
Recent product innovations focus on enhancing energy conversion efficiency, miniaturization, and integration with other components. The integration of energy harvesting devices with sensors and wireless communication modules is gaining traction. Companies are focusing on developing devices with improved power density and longer operational lifespan. The market fit is strong in applications requiring self-powered operation in remote or hard-to-reach locations.
Report Scope & Segmentation Analysis
This report segments the MEMS Energy Harvesting Devices market by technology (Vibration, Thermal, RF, Other) and end-user application (Automotive, Industrial, Military & Aerospace, Building & Home Automation, Consumer Electronics, Other). Each segment's growth projections, market sizes (in Millions), and competitive dynamics are analyzed. For instance, the vibration energy harvesting segment is projected to grow at a CAGR of xx% due to high demand in automotive and industrial sectors, while the thermal energy harvesting segment is expected to have a CAGR of xx% driven by advancements in thermoelectric materials.
Key Drivers of MEMS Energy Harvesting Devices Industry Growth
The key drivers of market growth include:
- The increasing demand for wireless sensors and IoT devices.
- Advancements in MEMS technology leading to improved energy conversion efficiency.
- Government regulations and initiatives promoting energy efficiency and sustainability.
- Growing adoption in various end-user applications, such as automotive, industrial, and consumer electronics.
Challenges in the MEMS Energy Harvesting Devices Industry Sector
Challenges include:
- The relatively high initial cost of MEMS energy harvesting devices compared to traditional batteries.
- The need for further improvement in energy conversion efficiency to achieve wider adoption.
- The complexity of integrating MEMS energy harvesting devices with existing systems.
Emerging Opportunities in MEMS Energy Harvesting Devices Industry
Emerging opportunities include:
- The development of novel energy harvesting materials and technologies with enhanced efficiency.
- Integration of MEMS energy harvesting devices with energy storage solutions to enhance performance.
- Expansion into new applications, such as medical devices and environmental monitoring.
Leading Players in the MEMS Energy Harvesting Devices Industry Market
- ABB Ltd
- Micropelt (EH4 GmbH)
- EnOcean Gmbh
- Cymbet Corp
- STMicroelectronics NV
- Analog Devices Inc
- Coventor Inc (Lam Research Corporation)
Key Developments in MEMS Energy Harvesting Devices Industry Industry
- February 2023: Asahi Kasei Microdevices (AKM) launched a new DC-DC step-up converter for efficient energy harvesting applications, boosting low voltages for remote and battery-free operations.
- January 2023: WePower Technologies unveiled its Gemns Energy Harvesting Generator (EHG) product line, offering scalable and sustainable power solutions for wireless IoT devices.
Strategic Outlook for MEMS Energy Harvesting Devices Industry Market
The MEMS energy harvesting devices market is poised for significant growth, driven by continuous technological advancements, increasing demand for energy-autonomous devices, and expanding applications across various sectors. The focus on improving energy conversion efficiency, miniaturization, and cost reduction will be crucial for wider market penetration. New materials and integration strategies will further enhance the capabilities and market appeal of MEMS energy harvesting solutions.
MEMS Energy Harvesting Devices Industry Segmentation
-
1. Technology
- 1.1. Vibration Energy Harvesting
- 1.2. Thermal Energy Harvesting
- 1.3. RF Energy Harvesting
- 1.4. Other Types of Energy Harvesting
-
2. End-user Applications
- 2.1. Automotive
- 2.2. Industrial
- 2.3. Military and Aerospace
- 2.4. Building and Home Automation
- 2.5. Consumer Electronics
- 2.6. Other End-user Applications
MEMS Energy Harvesting Devices Industry Segmentation By Geography
- 1. North America
- 2. Europe
- 3. Asia Pacific
- 4. Rest of the World
MEMS Energy Harvesting Devices Industry REPORT HIGHLIGHTS
| Aspects | Details |
|---|---|
| Study Period | 2019-2033 |
| Base Year | 2024 |
| Estimated Year | 2025 |
| Forecast Period | 2025-2033 |
| Historical Period | 2019-2024 |
| Growth Rate | CAGR of 6.37% from 2019-2033 |
| Segmentation |
|
Table of Contents
- 1. Introduction
- 1.1. Research Scope
- 1.2. Market Segmentation
- 1.3. Research Methodology
- 1.4. Definitions and Assumptions
- 2. Executive Summary
- 2.1. Introduction
- 3. Market Dynamics
- 3.1. Introduction
- 3.2. Market Drivers
- 3.2.1. Growth of Smart Cities; Commercial Applications are Slowly Getting into the Market for Industrial Applications and Home Automation Appliances
- 3.3. Market Restrains
- 3.3.1. Ultra Low Power Electronics; Wireless Data Transmissions Rates and Standards
- 3.4. Market Trends
- 3.4.1. Building and Home Automation to Hold Major Share
- 4. Market Factor Analysis
- 4.1. Porters Five Forces
- 4.2. Supply/Value Chain
- 4.3. PESTEL analysis
- 4.4. Market Entropy
- 4.5. Patent/Trademark Analysis
- 5. MEMS Energy Harvesting Devices Industry Analysis, Insights and Forecast, 2019-2031
- 5.1. Market Analysis, Insights and Forecast - by Technology
- 5.1.1. Vibration Energy Harvesting
- 5.1.2. Thermal Energy Harvesting
- 5.1.3. RF Energy Harvesting
- 5.1.4. Other Types of Energy Harvesting
- 5.2. Market Analysis, Insights and Forecast - by End-user Applications
- 5.2.1. Automotive
- 5.2.2. Industrial
- 5.2.3. Military and Aerospace
- 5.2.4. Building and Home Automation
- 5.2.5. Consumer Electronics
- 5.2.6. Other End-user Applications
- 5.3. Market Analysis, Insights and Forecast - by Region
- 5.3.1. North America
- 5.3.2. Europe
- 5.3.3. Asia Pacific
- 5.3.4. Rest of the World
- 5.1. Market Analysis, Insights and Forecast - by Technology
- 6. North America MEMS Energy Harvesting Devices Industry Analysis, Insights and Forecast, 2019-2031
- 6.1. Market Analysis, Insights and Forecast - by Technology
- 6.1.1. Vibration Energy Harvesting
- 6.1.2. Thermal Energy Harvesting
- 6.1.3. RF Energy Harvesting
- 6.1.4. Other Types of Energy Harvesting
- 6.2. Market Analysis, Insights and Forecast - by End-user Applications
- 6.2.1. Automotive
- 6.2.2. Industrial
- 6.2.3. Military and Aerospace
- 6.2.4. Building and Home Automation
- 6.2.5. Consumer Electronics
- 6.2.6. Other End-user Applications
- 6.1. Market Analysis, Insights and Forecast - by Technology
- 7. Europe MEMS Energy Harvesting Devices Industry Analysis, Insights and Forecast, 2019-2031
- 7.1. Market Analysis, Insights and Forecast - by Technology
- 7.1.1. Vibration Energy Harvesting
- 7.1.2. Thermal Energy Harvesting
- 7.1.3. RF Energy Harvesting
- 7.1.4. Other Types of Energy Harvesting
- 7.2. Market Analysis, Insights and Forecast - by End-user Applications
- 7.2.1. Automotive
- 7.2.2. Industrial
- 7.2.3. Military and Aerospace
- 7.2.4. Building and Home Automation
- 7.2.5. Consumer Electronics
- 7.2.6. Other End-user Applications
- 7.1. Market Analysis, Insights and Forecast - by Technology
- 8. Asia Pacific MEMS Energy Harvesting Devices Industry Analysis, Insights and Forecast, 2019-2031
- 8.1. Market Analysis, Insights and Forecast - by Technology
- 8.1.1. Vibration Energy Harvesting
- 8.1.2. Thermal Energy Harvesting
- 8.1.3. RF Energy Harvesting
- 8.1.4. Other Types of Energy Harvesting
- 8.2. Market Analysis, Insights and Forecast - by End-user Applications
- 8.2.1. Automotive
- 8.2.2. Industrial
- 8.2.3. Military and Aerospace
- 8.2.4. Building and Home Automation
- 8.2.5. Consumer Electronics
- 8.2.6. Other End-user Applications
- 8.1. Market Analysis, Insights and Forecast - by Technology
- 9. Rest of the World MEMS Energy Harvesting Devices Industry Analysis, Insights and Forecast, 2019-2031
- 9.1. Market Analysis, Insights and Forecast - by Technology
- 9.1.1. Vibration Energy Harvesting
- 9.1.2. Thermal Energy Harvesting
- 9.1.3. RF Energy Harvesting
- 9.1.4. Other Types of Energy Harvesting
- 9.2. Market Analysis, Insights and Forecast - by End-user Applications
- 9.2.1. Automotive
- 9.2.2. Industrial
- 9.2.3. Military and Aerospace
- 9.2.4. Building and Home Automation
- 9.2.5. Consumer Electronics
- 9.2.6. Other End-user Applications
- 9.1. Market Analysis, Insights and Forecast - by Technology
- 10. North America MEMS Energy Harvesting Devices Industry Analysis, Insights and Forecast, 2019-2031
- 10.1. Market Analysis, Insights and Forecast - By Country/Sub-region
- 10.1.1 United States
- 10.1.2 Canada
- 10.1.3 Mexico
- 11. Europe MEMS Energy Harvesting Devices Industry Analysis, Insights and Forecast, 2019-2031
- 11.1. Market Analysis, Insights and Forecast - By Country/Sub-region
- 11.1.1 Germany
- 11.1.2 United Kingdom
- 11.1.3 France
- 11.1.4 Spain
- 11.1.5 Italy
- 11.1.6 Spain
- 11.1.7 Belgium
- 11.1.8 Netherland
- 11.1.9 Nordics
- 11.1.10 Rest of Europe
- 12. Asia Pacific MEMS Energy Harvesting Devices Industry Analysis, Insights and Forecast, 2019-2031
- 12.1. Market Analysis, Insights and Forecast - By Country/Sub-region
- 12.1.1 China
- 12.1.2 Japan
- 12.1.3 India
- 12.1.4 South Korea
- 12.1.5 Southeast Asia
- 12.1.6 Australia
- 12.1.7 Indonesia
- 12.1.8 Phillipes
- 12.1.9 Singapore
- 12.1.10 Thailandc
- 12.1.11 Rest of Asia Pacific
- 13. South America MEMS Energy Harvesting Devices Industry Analysis, Insights and Forecast, 2019-2031
- 13.1. Market Analysis, Insights and Forecast - By Country/Sub-region
- 13.1.1 Brazil
- 13.1.2 Argentina
- 13.1.3 Peru
- 13.1.4 Chile
- 13.1.5 Colombia
- 13.1.6 Ecuador
- 13.1.7 Venezuela
- 13.1.8 Rest of South America
- 14. North America MEMS Energy Harvesting Devices Industry Analysis, Insights and Forecast, 2019-2031
- 14.1. Market Analysis, Insights and Forecast - By Country/Sub-region
- 14.1.1 United States
- 14.1.2 Canada
- 14.1.3 Mexico
- 15. MEA MEMS Energy Harvesting Devices Industry Analysis, Insights and Forecast, 2019-2031
- 15.1. Market Analysis, Insights and Forecast - By Country/Sub-region
- 15.1.1 United Arab Emirates
- 15.1.2 Saudi Arabia
- 15.1.3 South Africa
- 15.1.4 Rest of Middle East and Africa
- 16. Competitive Analysis
- 16.1. Market Share Analysis 2024
- 16.2. Company Profiles
- 16.2.1 ABB Ltd
- 16.2.1.1. Overview
- 16.2.1.2. Products
- 16.2.1.3. SWOT Analysis
- 16.2.1.4. Recent Developments
- 16.2.1.5. Financials (Based on Availability)
- 16.2.2 Micropelt (EH4 GmbH)
- 16.2.2.1. Overview
- 16.2.2.2. Products
- 16.2.2.3. SWOT Analysis
- 16.2.2.4. Recent Developments
- 16.2.2.5. Financials (Based on Availability)
- 16.2.3 EnOcean Gmbh
- 16.2.3.1. Overview
- 16.2.3.2. Products
- 16.2.3.3. SWOT Analysis
- 16.2.3.4. Recent Developments
- 16.2.3.5. Financials (Based on Availability)
- 16.2.4 Cymbet Corp
- 16.2.4.1. Overview
- 16.2.4.2. Products
- 16.2.4.3. SWOT Analysis
- 16.2.4.4. Recent Developments
- 16.2.4.5. Financials (Based on Availability)
- 16.2.5 STMicroelectronics NV
- 16.2.5.1. Overview
- 16.2.5.2. Products
- 16.2.5.3. SWOT Analysis
- 16.2.5.4. Recent Developments
- 16.2.5.5. Financials (Based on Availability)
- 16.2.6 Analog Devices Inc
- 16.2.6.1. Overview
- 16.2.6.2. Products
- 16.2.6.3. SWOT Analysis
- 16.2.6.4. Recent Developments
- 16.2.6.5. Financials (Based on Availability)
- 16.2.7 Coventor Inc (Lam Research Corporation)
- 16.2.7.1. Overview
- 16.2.7.2. Products
- 16.2.7.3. SWOT Analysis
- 16.2.7.4. Recent Developments
- 16.2.7.5. Financials (Based on Availability)
- 16.2.1 ABB Ltd
List of Figures
- Figure 1: MEMS Energy Harvesting Devices Industry Revenue Breakdown (Million, %) by Product 2024 & 2032
- Figure 2: MEMS Energy Harvesting Devices Industry Share (%) by Company 2024
List of Tables
- Table 1: MEMS Energy Harvesting Devices Industry Revenue Million Forecast, by Region 2019 & 2032
- Table 2: MEMS Energy Harvesting Devices Industry Volume K Unit Forecast, by Region 2019 & 2032
- Table 3: MEMS Energy Harvesting Devices Industry Revenue Million Forecast, by Technology 2019 & 2032
- Table 4: MEMS Energy Harvesting Devices Industry Volume K Unit Forecast, by Technology 2019 & 2032
- Table 5: MEMS Energy Harvesting Devices Industry Revenue Million Forecast, by End-user Applications 2019 & 2032
- Table 6: MEMS Energy Harvesting Devices Industry Volume K Unit Forecast, by End-user Applications 2019 & 2032
- Table 7: MEMS Energy Harvesting Devices Industry Revenue Million Forecast, by Region 2019 & 2032
- Table 8: MEMS Energy Harvesting Devices Industry Volume K Unit Forecast, by Region 2019 & 2032
- Table 9: MEMS Energy Harvesting Devices Industry Revenue Million Forecast, by Country 2019 & 2032
- Table 10: MEMS Energy Harvesting Devices Industry Volume K Unit Forecast, by Country 2019 & 2032
- Table 11: United States MEMS Energy Harvesting Devices Industry Revenue (Million) Forecast, by Application 2019 & 2032
- Table 12: United States MEMS Energy Harvesting Devices Industry Volume (K Unit) Forecast, by Application 2019 & 2032
- Table 13: Canada MEMS Energy Harvesting Devices Industry Revenue (Million) Forecast, by Application 2019 & 2032
- Table 14: Canada MEMS Energy Harvesting Devices Industry Volume (K Unit) Forecast, by Application 2019 & 2032
- Table 15: Mexico MEMS Energy Harvesting Devices Industry Revenue (Million) Forecast, by Application 2019 & 2032
- Table 16: Mexico MEMS Energy Harvesting Devices Industry Volume (K Unit) Forecast, by Application 2019 & 2032
- Table 17: MEMS Energy Harvesting Devices Industry Revenue Million Forecast, by Country 2019 & 2032
- Table 18: MEMS Energy Harvesting Devices Industry Volume K Unit Forecast, by Country 2019 & 2032
- Table 19: Germany MEMS Energy Harvesting Devices Industry Revenue (Million) Forecast, by Application 2019 & 2032
- Table 20: Germany MEMS Energy Harvesting Devices Industry Volume (K Unit) Forecast, by Application 2019 & 2032
- Table 21: United Kingdom MEMS Energy Harvesting Devices Industry Revenue (Million) Forecast, by Application 2019 & 2032
- Table 22: United Kingdom MEMS Energy Harvesting Devices Industry Volume (K Unit) Forecast, by Application 2019 & 2032
- Table 23: France MEMS Energy Harvesting Devices Industry Revenue (Million) Forecast, by Application 2019 & 2032
- Table 24: France MEMS Energy Harvesting Devices Industry Volume (K Unit) Forecast, by Application 2019 & 2032
- Table 25: Spain MEMS Energy Harvesting Devices Industry Revenue (Million) Forecast, by Application 2019 & 2032
- Table 26: Spain MEMS Energy Harvesting Devices Industry Volume (K Unit) Forecast, by Application 2019 & 2032
- Table 27: Italy MEMS Energy Harvesting Devices Industry Revenue (Million) Forecast, by Application 2019 & 2032
- Table 28: Italy MEMS Energy Harvesting Devices Industry Volume (K Unit) Forecast, by Application 2019 & 2032
- Table 29: Spain MEMS Energy Harvesting Devices Industry Revenue (Million) Forecast, by Application 2019 & 2032
- Table 30: Spain MEMS Energy Harvesting Devices Industry Volume (K Unit) Forecast, by Application 2019 & 2032
- Table 31: Belgium MEMS Energy Harvesting Devices Industry Revenue (Million) Forecast, by Application 2019 & 2032
- Table 32: Belgium MEMS Energy Harvesting Devices Industry Volume (K Unit) Forecast, by Application 2019 & 2032
- Table 33: Netherland MEMS Energy Harvesting Devices Industry Revenue (Million) Forecast, by Application 2019 & 2032
- Table 34: Netherland MEMS Energy Harvesting Devices Industry Volume (K Unit) Forecast, by Application 2019 & 2032
- Table 35: Nordics MEMS Energy Harvesting Devices Industry Revenue (Million) Forecast, by Application 2019 & 2032
- Table 36: Nordics MEMS Energy Harvesting Devices Industry Volume (K Unit) Forecast, by Application 2019 & 2032
- Table 37: Rest of Europe MEMS Energy Harvesting Devices Industry Revenue (Million) Forecast, by Application 2019 & 2032
- Table 38: Rest of Europe MEMS Energy Harvesting Devices Industry Volume (K Unit) Forecast, by Application 2019 & 2032
- Table 39: MEMS Energy Harvesting Devices Industry Revenue Million Forecast, by Country 2019 & 2032
- Table 40: MEMS Energy Harvesting Devices Industry Volume K Unit Forecast, by Country 2019 & 2032
- Table 41: China MEMS Energy Harvesting Devices Industry Revenue (Million) Forecast, by Application 2019 & 2032
- Table 42: China MEMS Energy Harvesting Devices Industry Volume (K Unit) Forecast, by Application 2019 & 2032
- Table 43: Japan MEMS Energy Harvesting Devices Industry Revenue (Million) Forecast, by Application 2019 & 2032
- Table 44: Japan MEMS Energy Harvesting Devices Industry Volume (K Unit) Forecast, by Application 2019 & 2032
- Table 45: India MEMS Energy Harvesting Devices Industry Revenue (Million) Forecast, by Application 2019 & 2032
- Table 46: India MEMS Energy Harvesting Devices Industry Volume (K Unit) Forecast, by Application 2019 & 2032
- Table 47: South Korea MEMS Energy Harvesting Devices Industry Revenue (Million) Forecast, by Application 2019 & 2032
- Table 48: South Korea MEMS Energy Harvesting Devices Industry Volume (K Unit) Forecast, by Application 2019 & 2032
- Table 49: Southeast Asia MEMS Energy Harvesting Devices Industry Revenue (Million) Forecast, by Application 2019 & 2032
- Table 50: Southeast Asia MEMS Energy Harvesting Devices Industry Volume (K Unit) Forecast, by Application 2019 & 2032
- Table 51: Australia MEMS Energy Harvesting Devices Industry Revenue (Million) Forecast, by Application 2019 & 2032
- Table 52: Australia MEMS Energy Harvesting Devices Industry Volume (K Unit) Forecast, by Application 2019 & 2032
- Table 53: Indonesia MEMS Energy Harvesting Devices Industry Revenue (Million) Forecast, by Application 2019 & 2032
- Table 54: Indonesia MEMS Energy Harvesting Devices Industry Volume (K Unit) Forecast, by Application 2019 & 2032
- Table 55: Phillipes MEMS Energy Harvesting Devices Industry Revenue (Million) Forecast, by Application 2019 & 2032
- Table 56: Phillipes MEMS Energy Harvesting Devices Industry Volume (K Unit) Forecast, by Application 2019 & 2032
- Table 57: Singapore MEMS Energy Harvesting Devices Industry Revenue (Million) Forecast, by Application 2019 & 2032
- Table 58: Singapore MEMS Energy Harvesting Devices Industry Volume (K Unit) Forecast, by Application 2019 & 2032
- Table 59: Thailandc MEMS Energy Harvesting Devices Industry Revenue (Million) Forecast, by Application 2019 & 2032
- Table 60: Thailandc MEMS Energy Harvesting Devices Industry Volume (K Unit) Forecast, by Application 2019 & 2032
- Table 61: Rest of Asia Pacific MEMS Energy Harvesting Devices Industry Revenue (Million) Forecast, by Application 2019 & 2032
- Table 62: Rest of Asia Pacific MEMS Energy Harvesting Devices Industry Volume (K Unit) Forecast, by Application 2019 & 2032
- Table 63: MEMS Energy Harvesting Devices Industry Revenue Million Forecast, by Country 2019 & 2032
- Table 64: MEMS Energy Harvesting Devices Industry Volume K Unit Forecast, by Country 2019 & 2032
- Table 65: Brazil MEMS Energy Harvesting Devices Industry Revenue (Million) Forecast, by Application 2019 & 2032
- Table 66: Brazil MEMS Energy Harvesting Devices Industry Volume (K Unit) Forecast, by Application 2019 & 2032
- Table 67: Argentina MEMS Energy Harvesting Devices Industry Revenue (Million) Forecast, by Application 2019 & 2032
- Table 68: Argentina MEMS Energy Harvesting Devices Industry Volume (K Unit) Forecast, by Application 2019 & 2032
- Table 69: Peru MEMS Energy Harvesting Devices Industry Revenue (Million) Forecast, by Application 2019 & 2032
- Table 70: Peru MEMS Energy Harvesting Devices Industry Volume (K Unit) Forecast, by Application 2019 & 2032
- Table 71: Chile MEMS Energy Harvesting Devices Industry Revenue (Million) Forecast, by Application 2019 & 2032
- Table 72: Chile MEMS Energy Harvesting Devices Industry Volume (K Unit) Forecast, by Application 2019 & 2032
- Table 73: Colombia MEMS Energy Harvesting Devices Industry Revenue (Million) Forecast, by Application 2019 & 2032
- Table 74: Colombia MEMS Energy Harvesting Devices Industry Volume (K Unit) Forecast, by Application 2019 & 2032
- Table 75: Ecuador MEMS Energy Harvesting Devices Industry Revenue (Million) Forecast, by Application 2019 & 2032
- Table 76: Ecuador MEMS Energy Harvesting Devices Industry Volume (K Unit) Forecast, by Application 2019 & 2032
- Table 77: Venezuela MEMS Energy Harvesting Devices Industry Revenue (Million) Forecast, by Application 2019 & 2032
- Table 78: Venezuela MEMS Energy Harvesting Devices Industry Volume (K Unit) Forecast, by Application 2019 & 2032
- Table 79: Rest of South America MEMS Energy Harvesting Devices Industry Revenue (Million) Forecast, by Application 2019 & 2032
- Table 80: Rest of South America MEMS Energy Harvesting Devices Industry Volume (K Unit) Forecast, by Application 2019 & 2032
- Table 81: MEMS Energy Harvesting Devices Industry Revenue Million Forecast, by Country 2019 & 2032
- Table 82: MEMS Energy Harvesting Devices Industry Volume K Unit Forecast, by Country 2019 & 2032
- Table 83: United States MEMS Energy Harvesting Devices Industry Revenue (Million) Forecast, by Application 2019 & 2032
- Table 84: United States MEMS Energy Harvesting Devices Industry Volume (K Unit) Forecast, by Application 2019 & 2032
- Table 85: Canada MEMS Energy Harvesting Devices Industry Revenue (Million) Forecast, by Application 2019 & 2032
- Table 86: Canada MEMS Energy Harvesting Devices Industry Volume (K Unit) Forecast, by Application 2019 & 2032
- Table 87: Mexico MEMS Energy Harvesting Devices Industry Revenue (Million) Forecast, by Application 2019 & 2032
- Table 88: Mexico MEMS Energy Harvesting Devices Industry Volume (K Unit) Forecast, by Application 2019 & 2032
- Table 89: MEMS Energy Harvesting Devices Industry Revenue Million Forecast, by Country 2019 & 2032
- Table 90: MEMS Energy Harvesting Devices Industry Volume K Unit Forecast, by Country 2019 & 2032
- Table 91: United Arab Emirates MEMS Energy Harvesting Devices Industry Revenue (Million) Forecast, by Application 2019 & 2032
- Table 92: United Arab Emirates MEMS Energy Harvesting Devices Industry Volume (K Unit) Forecast, by Application 2019 & 2032
- Table 93: Saudi Arabia MEMS Energy Harvesting Devices Industry Revenue (Million) Forecast, by Application 2019 & 2032
- Table 94: Saudi Arabia MEMS Energy Harvesting Devices Industry Volume (K Unit) Forecast, by Application 2019 & 2032
- Table 95: South Africa MEMS Energy Harvesting Devices Industry Revenue (Million) Forecast, by Application 2019 & 2032
- Table 96: South Africa MEMS Energy Harvesting Devices Industry Volume (K Unit) Forecast, by Application 2019 & 2032
- Table 97: Rest of Middle East and Africa MEMS Energy Harvesting Devices Industry Revenue (Million) Forecast, by Application 2019 & 2032
- Table 98: Rest of Middle East and Africa MEMS Energy Harvesting Devices Industry Volume (K Unit) Forecast, by Application 2019 & 2032
- Table 99: MEMS Energy Harvesting Devices Industry Revenue Million Forecast, by Technology 2019 & 2032
- Table 100: MEMS Energy Harvesting Devices Industry Volume K Unit Forecast, by Technology 2019 & 2032
- Table 101: MEMS Energy Harvesting Devices Industry Revenue Million Forecast, by End-user Applications 2019 & 2032
- Table 102: MEMS Energy Harvesting Devices Industry Volume K Unit Forecast, by End-user Applications 2019 & 2032
- Table 103: MEMS Energy Harvesting Devices Industry Revenue Million Forecast, by Country 2019 & 2032
- Table 104: MEMS Energy Harvesting Devices Industry Volume K Unit Forecast, by Country 2019 & 2032
- Table 105: MEMS Energy Harvesting Devices Industry Revenue Million Forecast, by Technology 2019 & 2032
- Table 106: MEMS Energy Harvesting Devices Industry Volume K Unit Forecast, by Technology 2019 & 2032
- Table 107: MEMS Energy Harvesting Devices Industry Revenue Million Forecast, by End-user Applications 2019 & 2032
- Table 108: MEMS Energy Harvesting Devices Industry Volume K Unit Forecast, by End-user Applications 2019 & 2032
- Table 109: MEMS Energy Harvesting Devices Industry Revenue Million Forecast, by Country 2019 & 2032
- Table 110: MEMS Energy Harvesting Devices Industry Volume K Unit Forecast, by Country 2019 & 2032
- Table 111: MEMS Energy Harvesting Devices Industry Revenue Million Forecast, by Technology 2019 & 2032
- Table 112: MEMS Energy Harvesting Devices Industry Volume K Unit Forecast, by Technology 2019 & 2032
- Table 113: MEMS Energy Harvesting Devices Industry Revenue Million Forecast, by End-user Applications 2019 & 2032
- Table 114: MEMS Energy Harvesting Devices Industry Volume K Unit Forecast, by End-user Applications 2019 & 2032
- Table 115: MEMS Energy Harvesting Devices Industry Revenue Million Forecast, by Country 2019 & 2032
- Table 116: MEMS Energy Harvesting Devices Industry Volume K Unit Forecast, by Country 2019 & 2032
- Table 117: MEMS Energy Harvesting Devices Industry Revenue Million Forecast, by Technology 2019 & 2032
- Table 118: MEMS Energy Harvesting Devices Industry Volume K Unit Forecast, by Technology 2019 & 2032
- Table 119: MEMS Energy Harvesting Devices Industry Revenue Million Forecast, by End-user Applications 2019 & 2032
- Table 120: MEMS Energy Harvesting Devices Industry Volume K Unit Forecast, by End-user Applications 2019 & 2032
- Table 121: MEMS Energy Harvesting Devices Industry Revenue Million Forecast, by Country 2019 & 2032
- Table 122: MEMS Energy Harvesting Devices Industry Volume K Unit Forecast, by Country 2019 & 2032
Frequently Asked Questions
1. What is the projected Compound Annual Growth Rate (CAGR) of the MEMS Energy Harvesting Devices Industry?
The projected CAGR is approximately 6.37%.
2. Which companies are prominent players in the MEMS Energy Harvesting Devices Industry?
Key companies in the market include ABB Ltd, Micropelt (EH4 GmbH), EnOcean Gmbh, Cymbet Corp, STMicroelectronics NV, Analog Devices Inc, Coventor Inc (Lam Research Corporation).
3. What are the main segments of the MEMS Energy Harvesting Devices Industry?
The market segments include Technology, End-user Applications.
4. Can you provide details about the market size?
The market size is estimated to be USD XX Million as of 2022.
5. What are some drivers contributing to market growth?
Growth of Smart Cities; Commercial Applications are Slowly Getting into the Market for Industrial Applications and Home Automation Appliances.
6. What are the notable trends driving market growth?
Building and Home Automation to Hold Major Share.
7. Are there any restraints impacting market growth?
Ultra Low Power Electronics; Wireless Data Transmissions Rates and Standards.
8. Can you provide examples of recent developments in the market?
February 2023: Asahi Kasei Microdevices (AKM) launched a new DC-DC step-up converter for efficient energy harvesting applications. It can boost low voltages, offering remote and battery-free operation solutions and low-maintenance asset monitoring and IoT applications.
9. What pricing options are available for accessing the report?
Pricing options include single-user, multi-user, and enterprise licenses priced at USD 4750, USD 5250, and USD 8750 respectively.
10. Is the market size provided in terms of value or volume?
The market size is provided in terms of value, measured in Million and volume, measured in K Unit.
11. Are there any specific market keywords associated with the report?
Yes, the market keyword associated with the report is "MEMS Energy Harvesting Devices Industry," which aids in identifying and referencing the specific market segment covered.
12. How do I determine which pricing option suits my needs best?
The pricing options vary based on user requirements and access needs. Individual users may opt for single-user licenses, while businesses requiring broader access may choose multi-user or enterprise licenses for cost-effective access to the report.
13. Are there any additional resources or data provided in the MEMS Energy Harvesting Devices Industry report?
While the report offers comprehensive insights, it's advisable to review the specific contents or supplementary materials provided to ascertain if additional resources or data are available.
14. How can I stay updated on further developments or reports in the MEMS Energy Harvesting Devices Industry?
To stay informed about further developments, trends, and reports in the MEMS Energy Harvesting Devices Industry, consider subscribing to industry newsletters, following relevant companies and organizations, or regularly checking reputable industry news sources and publications.
Methodology
Step 1 - Identification of Relevant Samples Size from Population Database


Step 2 - Approaches for Defining Global Market Size (Value, Volume* & Price*)

Note*: In applicable scenarios
Step 3 - Data Sources
Primary Research
- Web Analytics
- Survey Reports
- Research Institute
- Latest Research Reports
- Opinion Leaders
Secondary Research
- Annual Reports
- White Paper
- Latest Press Release
- Industry Association
- Paid Database
- Investor Presentations

Step 4 - Data Triangulation
Involves using different sources of information in order to increase the validity of a study
These sources are likely to be stakeholders in a program - participants, other researchers, program staff, other community members, and so on.
Then we put all data in single framework & apply various statistical tools to find out the dynamic on the market.
During the analysis stage, feedback from the stakeholder groups would be compared to determine areas of agreement as well as areas of divergence


