
Key Insights
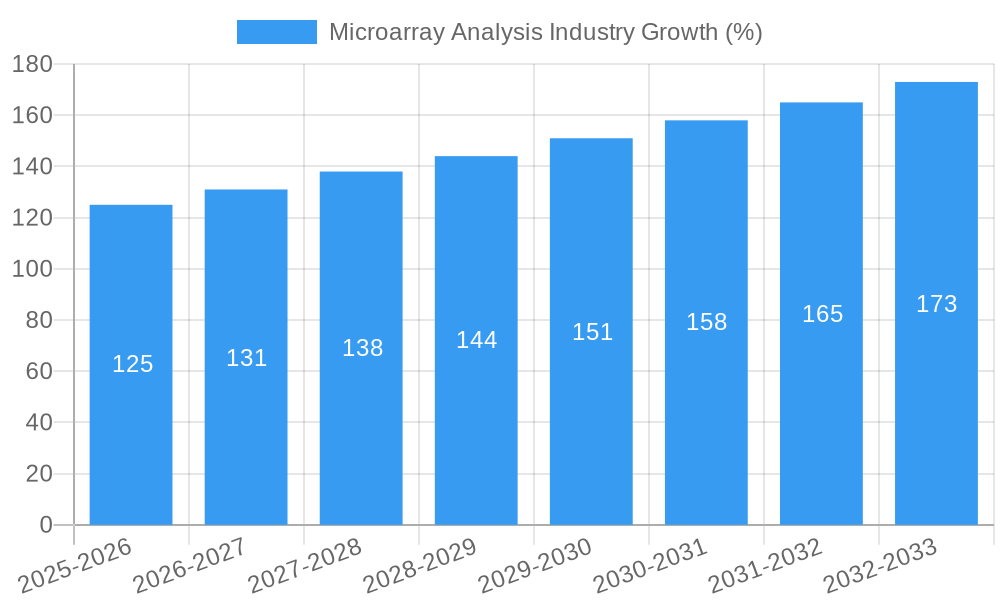
The microarray analysis market, valued at approximately $2.5 billion in 2025, is projected to experience robust growth, driven by advancements in genomics research, personalized medicine initiatives, and the increasing prevalence of chronic diseases necessitating early and accurate diagnosis. A compound annual growth rate (CAGR) of 5% is anticipated from 2025 to 2033, indicating a market size exceeding $3.5 billion by the end of the forecast period. Key drivers include the growing adoption of high-throughput screening methods in drug discovery, the increasing demand for faster and more cost-effective diagnostic tools, and the expanding research activities in academia and pharmaceutical companies. The market segmentation reveals a significant contribution from the reagents segment, followed by instruments and services, reflecting the reliance on sophisticated equipment and specialized expertise for effective microarray analysis. Hospitals and pharmaceutical/biotechnology companies constitute the largest end-user segments, further underscoring the pivotal role of microarray technology in both clinical diagnostics and drug development. While technological advancements fuel market expansion, potential restraints include the high initial investment costs associated with microarray platforms and the need for specialized personnel to operate and analyze the data generated.
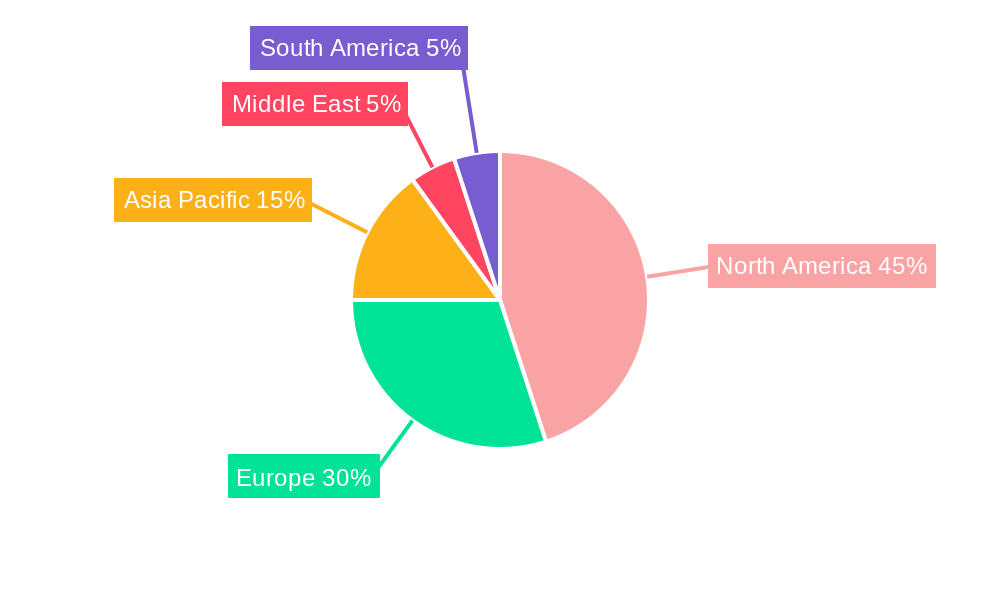
The geographical distribution of the market reveals a strong presence in North America, attributed to well-established research infrastructure and substantial funding for biomedical research. Europe and Asia Pacific regions are also expected to exhibit significant growth, fueled by increasing healthcare spending and the rising prevalence of target diseases. Emerging economies in the Middle East and South America present promising, albeit smaller, market opportunities. Competition in the microarray analysis market is intense, with established players like Thermo Fisher Scientific (Affymetrix), Bio-Rad Laboratories, and Merck KGaA alongside smaller, specialized companies like Arrayit Corporation and PEPperPRINT. The ongoing innovation in microarray technology, including advancements in data analysis software and the development of novel applications, is poised to shape the future landscape of this rapidly evolving market. Future growth will likely be influenced by factors such as regulatory approvals for new diagnostic assays, advancements in data interpretation and bioinformatics, and increased collaboration between research institutions and industry stakeholders.

Microarray Analysis Industry Market Report: 2019-2033
This comprehensive report provides an in-depth analysis of the Microarray Analysis industry, offering valuable insights for stakeholders across the value chain. The report covers the period 2019-2033, with a focus on the forecast period 2025-2033 and a base year of 2025. The analysis includes detailed segmentation by type (Instruments, Reagents, Services) and end-user (Hospitals, Pharmaceutical and Biotechnology Companies, Research and Academic Institutes), revealing market size, growth projections, and competitive dynamics. The report's findings are supported by rigorous data analysis and expert insights, providing actionable strategies for businesses seeking to thrive in this dynamic market. The total market size is projected to reach xx Million by 2033.
Microarray Analysis Industry Market Concentration & Innovation
The Microarray Analysis market exhibits a moderately concentrated landscape, with key players holding significant market share. Thermo Fischer Scientific (Affymetrix), Merck KGaA, and Bio-Rad Laboratories are among the established leaders, benefiting from their extensive product portfolios and global reach. However, smaller, specialized companies like Arrayit Corporation and LC Sciences are also making inroads through innovation and niche market penetration. The market share of the top 5 players is estimated at approximately xx%.
Innovation Drivers:
- Continuous advancements in microarray technology, including higher throughput, increased sensitivity, and reduced costs.
- Growing demand for personalized medicine and diagnostics, driving the adoption of microarrays in various applications.
- Development of novel microarray applications in areas such as genomics, proteomics, and pharmacogenomics.
Regulatory Framework & Substitutes: Regulatory approvals are crucial for microarray-based diagnostic products. The evolving regulatory landscape impacts market growth and necessitates compliance. While no direct substitutes exist for the core functionality of microarrays, alternative technologies like next-generation sequencing (NGS) are competing for market share in specific applications.
M&A Activities: The industry has witnessed several significant mergers and acquisitions in recent years. For example, the acquisition of Biohaven by Pfizer in May 2022 demonstrates the consolidation trend and the strategic importance of microarray-related technologies in drug discovery and development. While exact deal values for all M&A activities in the Microarray Analysis industry are not publicly available, the Pfizer-Biohaven deal alone was valued at xx Million.
End-User Trends: The increasing adoption of microarrays in research and academic institutions is fueling market growth. Pharmaceutical and biotechnology companies are also major users, driving demand for high-throughput screening and drug discovery applications. Hospitals' adoption is driven by the increasing use of diagnostic microarrays.
Microarray Analysis Industry Industry Trends & Insights
The Microarray Analysis market is experiencing robust growth, driven by several key factors. The rising prevalence of chronic diseases, increasing demand for personalized medicine, and advancements in microarray technology are all contributing to market expansion. Technological advancements like the development of high-density microarrays and improved data analysis software enhance the market's efficiency and capabilities. The increasing adoption of microarrays in various research applications further fuels market expansion.
Consumer preference is shifting towards higher throughput, cost-effective, and user-friendly microarray platforms. This trend is driving innovation in instrument design and data analysis software. Competitive dynamics are characterized by both intense competition among established players and the emergence of innovative smaller companies. The market is witnessing the introduction of novel microarray platforms and applications, further intensifying competition. The CAGR for the Microarray Analysis market during the forecast period (2025-2033) is projected to be xx%, with market penetration expected to reach xx% by 2033.
Dominant Markets & Segments in Microarray Analysis Industry
The North American region holds the largest market share in the Microarray Analysis industry, primarily due to strong research funding, the presence of major pharmaceutical and biotechnology companies, and advanced healthcare infrastructure. Within North America, the United States commands a significant portion of this market. Europe also holds a substantial market share, driven by strong governmental support for research and development in life sciences.
Key Drivers:
- North America: Strong R&D investments, high healthcare expenditure, early adoption of advanced technologies.
- Europe: Governmental support for life sciences research, well-established healthcare infrastructure, presence of major research institutions.
- Asia-Pacific: Rising healthcare expenditure, growing awareness of personalized medicine, increasing government initiatives to support biotechnology development.
Segment Dominance:
- Type: The Instruments segment dominates the market due to the significant investment required in infrastructure for microarray-based analysis. Reagents follow as a necessary component for every application, with Services comprising custom analysis and data interpretation, making up the smaller segment.
- End-User: Pharmaceutical and Biotechnology Companies represent the largest end-user segment, followed by Research and Academic Institutes, and then Hospitals. This is due to the extensive application of microarrays in drug discovery, diagnostics, and basic research.
Microarray Analysis Industry Product Developments
Recent product innovations include high-density microarrays with increased sensitivity and throughput, along with improved data analysis software for efficient and accurate results. These developments are improving the efficiency and cost-effectiveness of microarray-based analysis, expanding its applications in various fields, including genomics, proteomics, and pharmacogenomics. The integration of advanced technologies such as AI and machine learning in data analysis is further enhancing the accuracy and speed of interpretation, creating a strong competitive advantage for providers that incorporate these features.
Report Scope & Segmentation Analysis
This report segments the Microarray Analysis market by Type: Instruments, Reagents, and Services. The Instruments segment includes microarray scanners, printers, and other related equipment. The Reagents segment comprises the various probes, buffers, and other consumables necessary for microarray experiments. The Services segment includes data analysis, interpretation, and customized microarray-based research. The market is further segmented by End-User: Hospitals, Pharmaceutical and Biotechnology Companies, and Research and Academic Institutes. Each segment’s market size, growth projections, and competitive dynamics are analyzed in detail within the report.
Key Drivers of Microarray Analysis Industry Growth
Several key factors drive the growth of the Microarray Analysis industry. Technological advancements such as improved microarray platforms and data analysis tools significantly improve efficiency and reduce costs. The increasing demand for personalized medicine and diagnostics in various healthcare settings fuels the market. Government funding for research and development in life sciences contributes to market growth, particularly in research institutions and academic settings. Furthermore, growing adoption of microarrays in pharmaceutical and biotechnology industries for drug discovery accelerates market expansion.
Challenges in the Microarray Analysis Industry Sector
The Microarray Analysis industry faces several challenges. High initial investment costs for instruments and software can be a barrier to entry for smaller players. The availability and cost of specialized reagents and consumables can also impact profitability. Competition from alternative technologies, such as next-generation sequencing (NGS), poses a significant threat. Strict regulatory requirements for diagnostic applications create another hurdle to market entry and product development. Finally, data analysis complexities and the need for specialized expertise are barriers to widespread adoption.
Emerging Opportunities in Microarray Analysis Industry
The Microarray Analysis industry offers promising opportunities for growth. The integration of artificial intelligence (AI) and machine learning (ML) in data analysis can significantly improve the accuracy and speed of microarray results. The rising demand for personalized medicine is creating opportunities for the development of customized microarray-based diagnostic tools. Emerging markets in developing countries present untapped potential for growth, especially as healthcare infrastructure improves. Finally, the expansion of microarray applications into new areas, such as environmental monitoring and food safety, provides further opportunities.
Leading Players in the Microarray Analysis Industry Market
- Terra Universal Inc
- Creative Biolabs
- Merck KGaA
- Arrayit Corporation
- LC Sciences
- Thermo Fischer Scientific (Affymetrix)
- PEPperPRINT
- Bio-Rad Laboratories
- JPT Peptide Technologies
- Grace Bio-Labs
- ProImmune Ltd
Key Developments in Microarray Analysis Industry Industry
- June 2022: Ariceum Therapeutics secured EUR 25 Million in Series A funding to advance its lead asset, Satoreotide, for neuroendocrine cancer treatment. This highlights the continued investment in technologies that support drug development, including those using microarray analysis.
- May 2022: Pfizer's acquisition of Biohaven, a developer of migraine therapies, underscores the consolidation in the pharmaceutical industry and the ongoing importance of microarray technology in drug discovery and development.
Strategic Outlook for Microarray Analysis Industry Market
The Microarray Analysis market is poised for continued growth, driven by technological advancements, increasing demand for personalized medicine, and expanding applications across various sectors. The integration of AI and ML in data analysis will further enhance the efficiency and accuracy of microarray-based analyses. The development of novel microarray applications in emerging fields, such as environmental monitoring and food safety, will create new market opportunities. Strategic partnerships and collaborations will play a crucial role in driving innovation and market penetration. Companies investing in R&D and developing advanced microarray technologies will be well-positioned to capitalize on future growth opportunities.
Microarray Analysis Industry Segmentation
-
1. Type
- 1.1. Instruments
- 1.2. Reagents
- 1.3. Services
-
2. End User
- 2.1. Hospitals
- 2.2. Pharmaceutical and Biotechnology Companies
- 2.3. Research and Academic Institutes
Microarray Analysis Industry Segmentation By Geography
-
1. North America
- 1.1. United States
- 1.2. Canada
- 1.3. Mexico
-
2. Europe
- 2.1. Germany
- 2.2. United Kingdom
- 2.3. France
- 2.4. Italy
- 2.5. Spain
- 2.6. Rest of Europe
-
3. Asia Pacific
- 3.1. China
- 3.2. Japan
- 3.3. India
- 3.4. Australia
- 3.5. South Korea
- 3.6. Rest of Asia Pacific
- 4. Middle East
-
5. GCC
- 5.1. South Africa
- 5.2. Rest of Middle East
-
6. South America
- 6.1. Brazil
- 6.2. Argentina
- 6.3. Rest of South America
Microarray Analysis Industry REPORT HIGHLIGHTS
| Aspects | Details |
|---|---|
| Study Period | 2019-2033 |
| Base Year | 2024 |
| Estimated Year | 2025 |
| Forecast Period | 2025-2033 |
| Historical Period | 2019-2024 |
| Growth Rate | CAGR of 5.00% from 2019-2033 |
| Segmentation |
|
Table of Contents
- 1. Introduction
- 1.1. Research Scope
- 1.2. Market Segmentation
- 1.3. Research Methodology
- 1.4. Definitions and Assumptions
- 2. Executive Summary
- 2.1. Introduction
- 3. Market Dynamics
- 3.1. Introduction
- 3.2. Market Drivers
- 3.2.1. Growing Burden of Chronic Diseases; Technological Advancements in Diagnostic Testing
- 3.3. Market Restrains
- 3.3.1. Reimbursement Issues
- 3.4. Market Trends
- 3.4.1. The Instrument Segment is Expected to Hold a Major Market Share in the Peptide Microarray Market
- 4. Market Factor Analysis
- 4.1. Porters Five Forces
- 4.2. Supply/Value Chain
- 4.3. PESTEL analysis
- 4.4. Market Entropy
- 4.5. Patent/Trademark Analysis
- 5. Global Microarray Analysis Industry Analysis, Insights and Forecast, 2019-2031
- 5.1. Market Analysis, Insights and Forecast - by Type
- 5.1.1. Instruments
- 5.1.2. Reagents
- 5.1.3. Services
- 5.2. Market Analysis, Insights and Forecast - by End User
- 5.2.1. Hospitals
- 5.2.2. Pharmaceutical and Biotechnology Companies
- 5.2.3. Research and Academic Institutes
- 5.3. Market Analysis, Insights and Forecast - by Region
- 5.3.1. North America
- 5.3.2. Europe
- 5.3.3. Asia Pacific
- 5.3.4. Middle East
- 5.3.5. GCC
- 5.3.6. South America
- 5.1. Market Analysis, Insights and Forecast - by Type
- 6. North America Microarray Analysis Industry Analysis, Insights and Forecast, 2019-2031
- 6.1. Market Analysis, Insights and Forecast - by Type
- 6.1.1. Instruments
- 6.1.2. Reagents
- 6.1.3. Services
- 6.2. Market Analysis, Insights and Forecast - by End User
- 6.2.1. Hospitals
- 6.2.2. Pharmaceutical and Biotechnology Companies
- 6.2.3. Research and Academic Institutes
- 6.1. Market Analysis, Insights and Forecast - by Type
- 7. Europe Microarray Analysis Industry Analysis, Insights and Forecast, 2019-2031
- 7.1. Market Analysis, Insights and Forecast - by Type
- 7.1.1. Instruments
- 7.1.2. Reagents
- 7.1.3. Services
- 7.2. Market Analysis, Insights and Forecast - by End User
- 7.2.1. Hospitals
- 7.2.2. Pharmaceutical and Biotechnology Companies
- 7.2.3. Research and Academic Institutes
- 7.1. Market Analysis, Insights and Forecast - by Type
- 8. Asia Pacific Microarray Analysis Industry Analysis, Insights and Forecast, 2019-2031
- 8.1. Market Analysis, Insights and Forecast - by Type
- 8.1.1. Instruments
- 8.1.2. Reagents
- 8.1.3. Services
- 8.2. Market Analysis, Insights and Forecast - by End User
- 8.2.1. Hospitals
- 8.2.2. Pharmaceutical and Biotechnology Companies
- 8.2.3. Research and Academic Institutes
- 8.1. Market Analysis, Insights and Forecast - by Type
- 9. Middle East Microarray Analysis Industry Analysis, Insights and Forecast, 2019-2031
- 9.1. Market Analysis, Insights and Forecast - by Type
- 9.1.1. Instruments
- 9.1.2. Reagents
- 9.1.3. Services
- 9.2. Market Analysis, Insights and Forecast - by End User
- 9.2.1. Hospitals
- 9.2.2. Pharmaceutical and Biotechnology Companies
- 9.2.3. Research and Academic Institutes
- 9.1. Market Analysis, Insights and Forecast - by Type
- 10. GCC Microarray Analysis Industry Analysis, Insights and Forecast, 2019-2031
- 10.1. Market Analysis, Insights and Forecast - by Type
- 10.1.1. Instruments
- 10.1.2. Reagents
- 10.1.3. Services
- 10.2. Market Analysis, Insights and Forecast - by End User
- 10.2.1. Hospitals
- 10.2.2. Pharmaceutical and Biotechnology Companies
- 10.2.3. Research and Academic Institutes
- 10.1. Market Analysis, Insights and Forecast - by Type
- 11. South America Microarray Analysis Industry Analysis, Insights and Forecast, 2019-2031
- 11.1. Market Analysis, Insights and Forecast - by Type
- 11.1.1. Instruments
- 11.1.2. Reagents
- 11.1.3. Services
- 11.2. Market Analysis, Insights and Forecast - by End User
- 11.2.1. Hospitals
- 11.2.2. Pharmaceutical and Biotechnology Companies
- 11.2.3. Research and Academic Institutes
- 11.1. Market Analysis, Insights and Forecast - by Type
- 12. North America Microarray Analysis Industry Analysis, Insights and Forecast, 2019-2031
- 12.1. Market Analysis, Insights and Forecast - By Country/Sub-region
- 12.1.1. undefined
- 13. Europe Microarray Analysis Industry Analysis, Insights and Forecast, 2019-2031
- 13.1. Market Analysis, Insights and Forecast - By Country/Sub-region
- 13.1.1. undefined
- 14. Asia Pacific Microarray Analysis Industry Analysis, Insights and Forecast, 2019-2031
- 14.1. Market Analysis, Insights and Forecast - By Country/Sub-region
- 14.1.1. undefined
- 15. Middle East Microarray Analysis Industry Analysis, Insights and Forecast, 2019-2031
- 15.1. Market Analysis, Insights and Forecast - By Country/Sub-region
- 15.1.1. undefined
- 16. South America Microarray Analysis Industry Analysis, Insights and Forecast, 2019-2031
- 16.1. Market Analysis, Insights and Forecast - By Country/Sub-region
- 16.1.1. undefined
- 17. Competitive Analysis
- 17.1. Global Market Share Analysis 2024
- 17.2. Company Profiles
- 17.2.1 Terra Universal Inc
- 17.2.1.1. Overview
- 17.2.1.2. Products
- 17.2.1.3. SWOT Analysis
- 17.2.1.4. Recent Developments
- 17.2.1.5. Financials (Based on Availability)
- 17.2.2 Creative Biolabs
- 17.2.2.1. Overview
- 17.2.2.2. Products
- 17.2.2.3. SWOT Analysis
- 17.2.2.4. Recent Developments
- 17.2.2.5. Financials (Based on Availability)
- 17.2.3 Merck KGaA
- 17.2.3.1. Overview
- 17.2.3.2. Products
- 17.2.3.3. SWOT Analysis
- 17.2.3.4. Recent Developments
- 17.2.3.5. Financials (Based on Availability)
- 17.2.4 Arrayit Corporation
- 17.2.4.1. Overview
- 17.2.4.2. Products
- 17.2.4.3. SWOT Analysis
- 17.2.4.4. Recent Developments
- 17.2.4.5. Financials (Based on Availability)
- 17.2.5 LC Sciences
- 17.2.5.1. Overview
- 17.2.5.2. Products
- 17.2.5.3. SWOT Analysis
- 17.2.5.4. Recent Developments
- 17.2.5.5. Financials (Based on Availability)
- 17.2.6 Thermo Fischer Scientific (Affymetrix)
- 17.2.6.1. Overview
- 17.2.6.2. Products
- 17.2.6.3. SWOT Analysis
- 17.2.6.4. Recent Developments
- 17.2.6.5. Financials (Based on Availability)
- 17.2.7 PEPperPRINT
- 17.2.7.1. Overview
- 17.2.7.2. Products
- 17.2.7.3. SWOT Analysis
- 17.2.7.4. Recent Developments
- 17.2.7.5. Financials (Based on Availability)
- 17.2.8 Bio-Rad Laboratories
- 17.2.8.1. Overview
- 17.2.8.2. Products
- 17.2.8.3. SWOT Analysis
- 17.2.8.4. Recent Developments
- 17.2.8.5. Financials (Based on Availability)
- 17.2.9 JPT Peptide Technologies
- 17.2.9.1. Overview
- 17.2.9.2. Products
- 17.2.9.3. SWOT Analysis
- 17.2.9.4. Recent Developments
- 17.2.9.5. Financials (Based on Availability)
- 17.2.10 Grace Bio-Labs
- 17.2.10.1. Overview
- 17.2.10.2. Products
- 17.2.10.3. SWOT Analysis
- 17.2.10.4. Recent Developments
- 17.2.10.5. Financials (Based on Availability)
- 17.2.11 ProImmune Ltd
- 17.2.11.1. Overview
- 17.2.11.2. Products
- 17.2.11.3. SWOT Analysis
- 17.2.11.4. Recent Developments
- 17.2.11.5. Financials (Based on Availability)
- 17.2.1 Terra Universal Inc
List of Figures
- Figure 1: Global Microarray Analysis Industry Revenue Breakdown (Million, %) by Region 2024 & 2032
- Figure 2: Global Microarray Analysis Industry Volume Breakdown (K Unit, %) by Region 2024 & 2032
- Figure 3: North America Microarray Analysis Industry Revenue (Million), by Country 2024 & 2032
- Figure 4: North America Microarray Analysis Industry Volume (K Unit), by Country 2024 & 2032
- Figure 5: North America Microarray Analysis Industry Revenue Share (%), by Country 2024 & 2032
- Figure 6: North America Microarray Analysis Industry Volume Share (%), by Country 2024 & 2032
- Figure 7: Europe Microarray Analysis Industry Revenue (Million), by Country 2024 & 2032
- Figure 8: Europe Microarray Analysis Industry Volume (K Unit), by Country 2024 & 2032
- Figure 9: Europe Microarray Analysis Industry Revenue Share (%), by Country 2024 & 2032
- Figure 10: Europe Microarray Analysis Industry Volume Share (%), by Country 2024 & 2032
- Figure 11: Asia Pacific Microarray Analysis Industry Revenue (Million), by Country 2024 & 2032
- Figure 12: Asia Pacific Microarray Analysis Industry Volume (K Unit), by Country 2024 & 2032
- Figure 13: Asia Pacific Microarray Analysis Industry Revenue Share (%), by Country 2024 & 2032
- Figure 14: Asia Pacific Microarray Analysis Industry Volume Share (%), by Country 2024 & 2032
- Figure 15: Middle East Microarray Analysis Industry Revenue (Million), by Country 2024 & 2032
- Figure 16: Middle East Microarray Analysis Industry Volume (K Unit), by Country 2024 & 2032
- Figure 17: Middle East Microarray Analysis Industry Revenue Share (%), by Country 2024 & 2032
- Figure 18: Middle East Microarray Analysis Industry Volume Share (%), by Country 2024 & 2032
- Figure 19: South America Microarray Analysis Industry Revenue (Million), by Country 2024 & 2032
- Figure 20: South America Microarray Analysis Industry Volume (K Unit), by Country 2024 & 2032
- Figure 21: South America Microarray Analysis Industry Revenue Share (%), by Country 2024 & 2032
- Figure 22: South America Microarray Analysis Industry Volume Share (%), by Country 2024 & 2032
- Figure 23: North America Microarray Analysis Industry Revenue (Million), by Type 2024 & 2032
- Figure 24: North America Microarray Analysis Industry Volume (K Unit), by Type 2024 & 2032
- Figure 25: North America Microarray Analysis Industry Revenue Share (%), by Type 2024 & 2032
- Figure 26: North America Microarray Analysis Industry Volume Share (%), by Type 2024 & 2032
- Figure 27: North America Microarray Analysis Industry Revenue (Million), by End User 2024 & 2032
- Figure 28: North America Microarray Analysis Industry Volume (K Unit), by End User 2024 & 2032
- Figure 29: North America Microarray Analysis Industry Revenue Share (%), by End User 2024 & 2032
- Figure 30: North America Microarray Analysis Industry Volume Share (%), by End User 2024 & 2032
- Figure 31: North America Microarray Analysis Industry Revenue (Million), by Country 2024 & 2032
- Figure 32: North America Microarray Analysis Industry Volume (K Unit), by Country 2024 & 2032
- Figure 33: North America Microarray Analysis Industry Revenue Share (%), by Country 2024 & 2032
- Figure 34: North America Microarray Analysis Industry Volume Share (%), by Country 2024 & 2032
- Figure 35: Europe Microarray Analysis Industry Revenue (Million), by Type 2024 & 2032
- Figure 36: Europe Microarray Analysis Industry Volume (K Unit), by Type 2024 & 2032
- Figure 37: Europe Microarray Analysis Industry Revenue Share (%), by Type 2024 & 2032
- Figure 38: Europe Microarray Analysis Industry Volume Share (%), by Type 2024 & 2032
- Figure 39: Europe Microarray Analysis Industry Revenue (Million), by End User 2024 & 2032
- Figure 40: Europe Microarray Analysis Industry Volume (K Unit), by End User 2024 & 2032
- Figure 41: Europe Microarray Analysis Industry Revenue Share (%), by End User 2024 & 2032
- Figure 42: Europe Microarray Analysis Industry Volume Share (%), by End User 2024 & 2032
- Figure 43: Europe Microarray Analysis Industry Revenue (Million), by Country 2024 & 2032
- Figure 44: Europe Microarray Analysis Industry Volume (K Unit), by Country 2024 & 2032
- Figure 45: Europe Microarray Analysis Industry Revenue Share (%), by Country 2024 & 2032
- Figure 46: Europe Microarray Analysis Industry Volume Share (%), by Country 2024 & 2032
- Figure 47: Asia Pacific Microarray Analysis Industry Revenue (Million), by Type 2024 & 2032
- Figure 48: Asia Pacific Microarray Analysis Industry Volume (K Unit), by Type 2024 & 2032
- Figure 49: Asia Pacific Microarray Analysis Industry Revenue Share (%), by Type 2024 & 2032
- Figure 50: Asia Pacific Microarray Analysis Industry Volume Share (%), by Type 2024 & 2032
- Figure 51: Asia Pacific Microarray Analysis Industry Revenue (Million), by End User 2024 & 2032
- Figure 52: Asia Pacific Microarray Analysis Industry Volume (K Unit), by End User 2024 & 2032
- Figure 53: Asia Pacific Microarray Analysis Industry Revenue Share (%), by End User 2024 & 2032
- Figure 54: Asia Pacific Microarray Analysis Industry Volume Share (%), by End User 2024 & 2032
- Figure 55: Asia Pacific Microarray Analysis Industry Revenue (Million), by Country 2024 & 2032
- Figure 56: Asia Pacific Microarray Analysis Industry Volume (K Unit), by Country 2024 & 2032
- Figure 57: Asia Pacific Microarray Analysis Industry Revenue Share (%), by Country 2024 & 2032
- Figure 58: Asia Pacific Microarray Analysis Industry Volume Share (%), by Country 2024 & 2032
- Figure 59: Middle East Microarray Analysis Industry Revenue (Million), by Type 2024 & 2032
- Figure 60: Middle East Microarray Analysis Industry Volume (K Unit), by Type 2024 & 2032
- Figure 61: Middle East Microarray Analysis Industry Revenue Share (%), by Type 2024 & 2032
- Figure 62: Middle East Microarray Analysis Industry Volume Share (%), by Type 2024 & 2032
- Figure 63: Middle East Microarray Analysis Industry Revenue (Million), by End User 2024 & 2032
- Figure 64: Middle East Microarray Analysis Industry Volume (K Unit), by End User 2024 & 2032
- Figure 65: Middle East Microarray Analysis Industry Revenue Share (%), by End User 2024 & 2032
- Figure 66: Middle East Microarray Analysis Industry Volume Share (%), by End User 2024 & 2032
- Figure 67: Middle East Microarray Analysis Industry Revenue (Million), by Country 2024 & 2032
- Figure 68: Middle East Microarray Analysis Industry Volume (K Unit), by Country 2024 & 2032
- Figure 69: Middle East Microarray Analysis Industry Revenue Share (%), by Country 2024 & 2032
- Figure 70: Middle East Microarray Analysis Industry Volume Share (%), by Country 2024 & 2032
- Figure 71: GCC Microarray Analysis Industry Revenue (Million), by Type 2024 & 2032
- Figure 72: GCC Microarray Analysis Industry Volume (K Unit), by Type 2024 & 2032
- Figure 73: GCC Microarray Analysis Industry Revenue Share (%), by Type 2024 & 2032
- Figure 74: GCC Microarray Analysis Industry Volume Share (%), by Type 2024 & 2032
- Figure 75: GCC Microarray Analysis Industry Revenue (Million), by End User 2024 & 2032
- Figure 76: GCC Microarray Analysis Industry Volume (K Unit), by End User 2024 & 2032
- Figure 77: GCC Microarray Analysis Industry Revenue Share (%), by End User 2024 & 2032
- Figure 78: GCC Microarray Analysis Industry Volume Share (%), by End User 2024 & 2032
- Figure 79: GCC Microarray Analysis Industry Revenue (Million), by Country 2024 & 2032
- Figure 80: GCC Microarray Analysis Industry Volume (K Unit), by Country 2024 & 2032
- Figure 81: GCC Microarray Analysis Industry Revenue Share (%), by Country 2024 & 2032
- Figure 82: GCC Microarray Analysis Industry Volume Share (%), by Country 2024 & 2032
- Figure 83: South America Microarray Analysis Industry Revenue (Million), by Type 2024 & 2032
- Figure 84: South America Microarray Analysis Industry Volume (K Unit), by Type 2024 & 2032
- Figure 85: South America Microarray Analysis Industry Revenue Share (%), by Type 2024 & 2032
- Figure 86: South America Microarray Analysis Industry Volume Share (%), by Type 2024 & 2032
- Figure 87: South America Microarray Analysis Industry Revenue (Million), by End User 2024 & 2032
- Figure 88: South America Microarray Analysis Industry Volume (K Unit), by End User 2024 & 2032
- Figure 89: South America Microarray Analysis Industry Revenue Share (%), by End User 2024 & 2032
- Figure 90: South America Microarray Analysis Industry Volume Share (%), by End User 2024 & 2032
- Figure 91: South America Microarray Analysis Industry Revenue (Million), by Country 2024 & 2032
- Figure 92: South America Microarray Analysis Industry Volume (K Unit), by Country 2024 & 2032
- Figure 93: South America Microarray Analysis Industry Revenue Share (%), by Country 2024 & 2032
- Figure 94: South America Microarray Analysis Industry Volume Share (%), by Country 2024 & 2032
List of Tables
- Table 1: Global Microarray Analysis Industry Revenue Million Forecast, by Region 2019 & 2032
- Table 2: Global Microarray Analysis Industry Volume K Unit Forecast, by Region 2019 & 2032
- Table 3: Global Microarray Analysis Industry Revenue Million Forecast, by Type 2019 & 2032
- Table 4: Global Microarray Analysis Industry Volume K Unit Forecast, by Type 2019 & 2032
- Table 5: Global Microarray Analysis Industry Revenue Million Forecast, by End User 2019 & 2032
- Table 6: Global Microarray Analysis Industry Volume K Unit Forecast, by End User 2019 & 2032
- Table 7: Global Microarray Analysis Industry Revenue Million Forecast, by Region 2019 & 2032
- Table 8: Global Microarray Analysis Industry Volume K Unit Forecast, by Region 2019 & 2032
- Table 9: Global Microarray Analysis Industry Revenue Million Forecast, by Country 2019 & 2032
- Table 10: Global Microarray Analysis Industry Volume K Unit Forecast, by Country 2019 & 2032
- Table 11: Global Microarray Analysis Industry Revenue Million Forecast, by Country 2019 & 2032
- Table 12: Global Microarray Analysis Industry Volume K Unit Forecast, by Country 2019 & 2032
- Table 13: Global Microarray Analysis Industry Revenue Million Forecast, by Country 2019 & 2032
- Table 14: Global Microarray Analysis Industry Volume K Unit Forecast, by Country 2019 & 2032
- Table 15: Global Microarray Analysis Industry Revenue Million Forecast, by Country 2019 & 2032
- Table 16: Global Microarray Analysis Industry Volume K Unit Forecast, by Country 2019 & 2032
- Table 17: Global Microarray Analysis Industry Revenue Million Forecast, by Country 2019 & 2032
- Table 18: Global Microarray Analysis Industry Volume K Unit Forecast, by Country 2019 & 2032
- Table 19: Global Microarray Analysis Industry Revenue Million Forecast, by Type 2019 & 2032
- Table 20: Global Microarray Analysis Industry Volume K Unit Forecast, by Type 2019 & 2032
- Table 21: Global Microarray Analysis Industry Revenue Million Forecast, by End User 2019 & 2032
- Table 22: Global Microarray Analysis Industry Volume K Unit Forecast, by End User 2019 & 2032
- Table 23: Global Microarray Analysis Industry Revenue Million Forecast, by Country 2019 & 2032
- Table 24: Global Microarray Analysis Industry Volume K Unit Forecast, by Country 2019 & 2032
- Table 25: United States Microarray Analysis Industry Revenue (Million) Forecast, by Application 2019 & 2032
- Table 26: United States Microarray Analysis Industry Volume (K Unit) Forecast, by Application 2019 & 2032
- Table 27: Canada Microarray Analysis Industry Revenue (Million) Forecast, by Application 2019 & 2032
- Table 28: Canada Microarray Analysis Industry Volume (K Unit) Forecast, by Application 2019 & 2032
- Table 29: Mexico Microarray Analysis Industry Revenue (Million) Forecast, by Application 2019 & 2032
- Table 30: Mexico Microarray Analysis Industry Volume (K Unit) Forecast, by Application 2019 & 2032
- Table 31: Global Microarray Analysis Industry Revenue Million Forecast, by Type 2019 & 2032
- Table 32: Global Microarray Analysis Industry Volume K Unit Forecast, by Type 2019 & 2032
- Table 33: Global Microarray Analysis Industry Revenue Million Forecast, by End User 2019 & 2032
- Table 34: Global Microarray Analysis Industry Volume K Unit Forecast, by End User 2019 & 2032
- Table 35: Global Microarray Analysis Industry Revenue Million Forecast, by Country 2019 & 2032
- Table 36: Global Microarray Analysis Industry Volume K Unit Forecast, by Country 2019 & 2032
- Table 37: Germany Microarray Analysis Industry Revenue (Million) Forecast, by Application 2019 & 2032
- Table 38: Germany Microarray Analysis Industry Volume (K Unit) Forecast, by Application 2019 & 2032
- Table 39: United Kingdom Microarray Analysis Industry Revenue (Million) Forecast, by Application 2019 & 2032
- Table 40: United Kingdom Microarray Analysis Industry Volume (K Unit) Forecast, by Application 2019 & 2032
- Table 41: France Microarray Analysis Industry Revenue (Million) Forecast, by Application 2019 & 2032
- Table 42: France Microarray Analysis Industry Volume (K Unit) Forecast, by Application 2019 & 2032
- Table 43: Italy Microarray Analysis Industry Revenue (Million) Forecast, by Application 2019 & 2032
- Table 44: Italy Microarray Analysis Industry Volume (K Unit) Forecast, by Application 2019 & 2032
- Table 45: Spain Microarray Analysis Industry Revenue (Million) Forecast, by Application 2019 & 2032
- Table 46: Spain Microarray Analysis Industry Volume (K Unit) Forecast, by Application 2019 & 2032
- Table 47: Rest of Europe Microarray Analysis Industry Revenue (Million) Forecast, by Application 2019 & 2032
- Table 48: Rest of Europe Microarray Analysis Industry Volume (K Unit) Forecast, by Application 2019 & 2032
- Table 49: Global Microarray Analysis Industry Revenue Million Forecast, by Type 2019 & 2032
- Table 50: Global Microarray Analysis Industry Volume K Unit Forecast, by Type 2019 & 2032
- Table 51: Global Microarray Analysis Industry Revenue Million Forecast, by End User 2019 & 2032
- Table 52: Global Microarray Analysis Industry Volume K Unit Forecast, by End User 2019 & 2032
- Table 53: Global Microarray Analysis Industry Revenue Million Forecast, by Country 2019 & 2032
- Table 54: Global Microarray Analysis Industry Volume K Unit Forecast, by Country 2019 & 2032
- Table 55: China Microarray Analysis Industry Revenue (Million) Forecast, by Application 2019 & 2032
- Table 56: China Microarray Analysis Industry Volume (K Unit) Forecast, by Application 2019 & 2032
- Table 57: Japan Microarray Analysis Industry Revenue (Million) Forecast, by Application 2019 & 2032
- Table 58: Japan Microarray Analysis Industry Volume (K Unit) Forecast, by Application 2019 & 2032
- Table 59: India Microarray Analysis Industry Revenue (Million) Forecast, by Application 2019 & 2032
- Table 60: India Microarray Analysis Industry Volume (K Unit) Forecast, by Application 2019 & 2032
- Table 61: Australia Microarray Analysis Industry Revenue (Million) Forecast, by Application 2019 & 2032
- Table 62: Australia Microarray Analysis Industry Volume (K Unit) Forecast, by Application 2019 & 2032
- Table 63: South Korea Microarray Analysis Industry Revenue (Million) Forecast, by Application 2019 & 2032
- Table 64: South Korea Microarray Analysis Industry Volume (K Unit) Forecast, by Application 2019 & 2032
- Table 65: Rest of Asia Pacific Microarray Analysis Industry Revenue (Million) Forecast, by Application 2019 & 2032
- Table 66: Rest of Asia Pacific Microarray Analysis Industry Volume (K Unit) Forecast, by Application 2019 & 2032
- Table 67: Global Microarray Analysis Industry Revenue Million Forecast, by Type 2019 & 2032
- Table 68: Global Microarray Analysis Industry Volume K Unit Forecast, by Type 2019 & 2032
- Table 69: Global Microarray Analysis Industry Revenue Million Forecast, by End User 2019 & 2032
- Table 70: Global Microarray Analysis Industry Volume K Unit Forecast, by End User 2019 & 2032
- Table 71: Global Microarray Analysis Industry Revenue Million Forecast, by Country 2019 & 2032
- Table 72: Global Microarray Analysis Industry Volume K Unit Forecast, by Country 2019 & 2032
- Table 73: Global Microarray Analysis Industry Revenue Million Forecast, by Type 2019 & 2032
- Table 74: Global Microarray Analysis Industry Volume K Unit Forecast, by Type 2019 & 2032
- Table 75: Global Microarray Analysis Industry Revenue Million Forecast, by End User 2019 & 2032
- Table 76: Global Microarray Analysis Industry Volume K Unit Forecast, by End User 2019 & 2032
- Table 77: Global Microarray Analysis Industry Revenue Million Forecast, by Country 2019 & 2032
- Table 78: Global Microarray Analysis Industry Volume K Unit Forecast, by Country 2019 & 2032
- Table 79: South Africa Microarray Analysis Industry Revenue (Million) Forecast, by Application 2019 & 2032
- Table 80: South Africa Microarray Analysis Industry Volume (K Unit) Forecast, by Application 2019 & 2032
- Table 81: Rest of Middle East Microarray Analysis Industry Revenue (Million) Forecast, by Application 2019 & 2032
- Table 82: Rest of Middle East Microarray Analysis Industry Volume (K Unit) Forecast, by Application 2019 & 2032
- Table 83: Global Microarray Analysis Industry Revenue Million Forecast, by Type 2019 & 2032
- Table 84: Global Microarray Analysis Industry Volume K Unit Forecast, by Type 2019 & 2032
- Table 85: Global Microarray Analysis Industry Revenue Million Forecast, by End User 2019 & 2032
- Table 86: Global Microarray Analysis Industry Volume K Unit Forecast, by End User 2019 & 2032
- Table 87: Global Microarray Analysis Industry Revenue Million Forecast, by Country 2019 & 2032
- Table 88: Global Microarray Analysis Industry Volume K Unit Forecast, by Country 2019 & 2032
- Table 89: Brazil Microarray Analysis Industry Revenue (Million) Forecast, by Application 2019 & 2032
- Table 90: Brazil Microarray Analysis Industry Volume (K Unit) Forecast, by Application 2019 & 2032
- Table 91: Argentina Microarray Analysis Industry Revenue (Million) Forecast, by Application 2019 & 2032
- Table 92: Argentina Microarray Analysis Industry Volume (K Unit) Forecast, by Application 2019 & 2032
- Table 93: Rest of South America Microarray Analysis Industry Revenue (Million) Forecast, by Application 2019 & 2032
- Table 94: Rest of South America Microarray Analysis Industry Volume (K Unit) Forecast, by Application 2019 & 2032
Frequently Asked Questions
1. What is the projected Compound Annual Growth Rate (CAGR) of the Microarray Analysis Industry?
The projected CAGR is approximately 5.00%.
2. Which companies are prominent players in the Microarray Analysis Industry?
Key companies in the market include Terra Universal Inc, Creative Biolabs, Merck KGaA, Arrayit Corporation, LC Sciences, Thermo Fischer Scientific (Affymetrix), PEPperPRINT, Bio-Rad Laboratories, JPT Peptide Technologies, Grace Bio-Labs, ProImmune Ltd.
3. What are the main segments of the Microarray Analysis Industry?
The market segments include Type, End User.
4. Can you provide details about the market size?
The market size is estimated to be USD XX Million as of 2022.
5. What are some drivers contributing to market growth?
Growing Burden of Chronic Diseases; Technological Advancements in Diagnostic Testing.
6. What are the notable trends driving market growth?
The Instrument Segment is Expected to Hold a Major Market Share in the Peptide Microarray Market.
7. Are there any restraints impacting market growth?
Reimbursement Issues.
8. Can you provide examples of recent developments in the market?
In June 2022, Ariceum Therapeutics launched with EUR 25M Series A to advance its lead asset, Satoreotide, for the treatment of low- and high-grade neuroendocrine cancers.
9. What pricing options are available for accessing the report?
Pricing options include single-user, multi-user, and enterprise licenses priced at USD 4750, USD 5250, and USD 8750 respectively.
10. Is the market size provided in terms of value or volume?
The market size is provided in terms of value, measured in Million and volume, measured in K Unit.
11. Are there any specific market keywords associated with the report?
Yes, the market keyword associated with the report is "Microarray Analysis Industry," which aids in identifying and referencing the specific market segment covered.
12. How do I determine which pricing option suits my needs best?
The pricing options vary based on user requirements and access needs. Individual users may opt for single-user licenses, while businesses requiring broader access may choose multi-user or enterprise licenses for cost-effective access to the report.
13. Are there any additional resources or data provided in the Microarray Analysis Industry report?
While the report offers comprehensive insights, it's advisable to review the specific contents or supplementary materials provided to ascertain if additional resources or data are available.
14. How can I stay updated on further developments or reports in the Microarray Analysis Industry?
To stay informed about further developments, trends, and reports in the Microarray Analysis Industry, consider subscribing to industry newsletters, following relevant companies and organizations, or regularly checking reputable industry news sources and publications.
Methodology
Step 1 - Identification of Relevant Samples Size from Population Database


Step 2 - Approaches for Defining Global Market Size (Value, Volume* & Price*)

Note*: In applicable scenarios
Step 3 - Data Sources
Primary Research
- Web Analytics
- Survey Reports
- Research Institute
- Latest Research Reports
- Opinion Leaders
Secondary Research
- Annual Reports
- White Paper
- Latest Press Release
- Industry Association
- Paid Database
- Investor Presentations

Step 4 - Data Triangulation
Involves using different sources of information in order to increase the validity of a study
These sources are likely to be stakeholders in a program - participants, other researchers, program staff, other community members, and so on.
Then we put all data in single framework & apply various statistical tools to find out the dynamic on the market.
During the analysis stage, feedback from the stakeholder groups would be compared to determine areas of agreement as well as areas of divergence


