
Key Insights
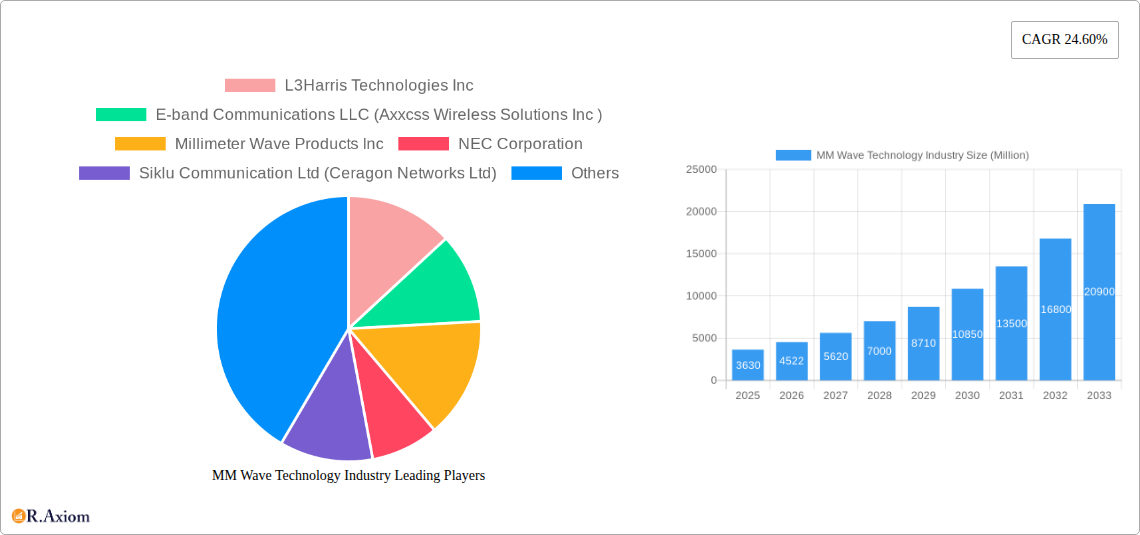
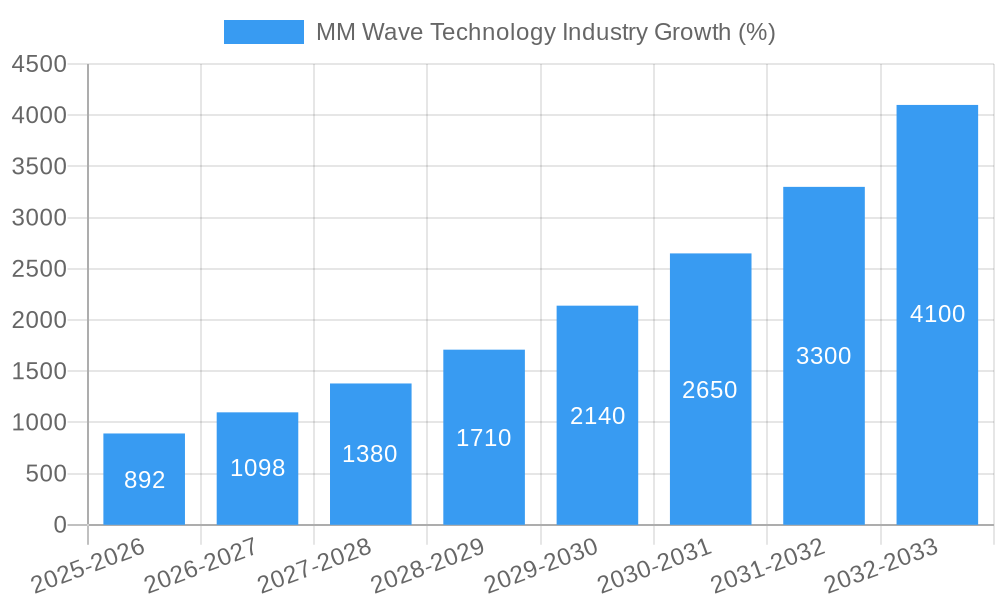
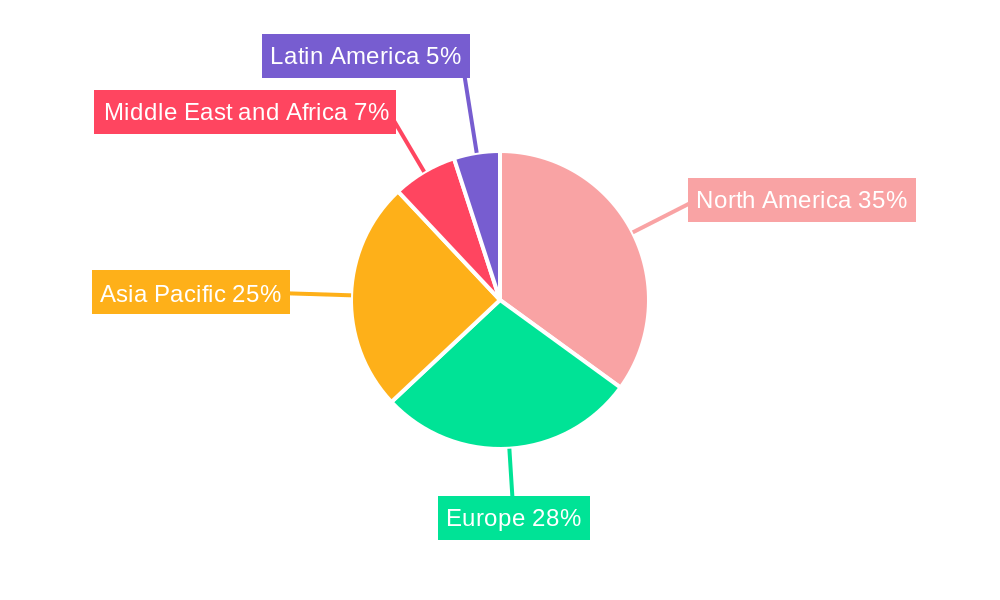
The millimeter wave (mmWave) technology market is experiencing robust growth, projected to reach a market size of $3.63 billion in 2025 and exhibiting a remarkable Compound Annual Growth Rate (CAGR) of 24.60% from 2025 to 2033. This expansion is driven by several key factors. The increasing demand for high-bandwidth applications, particularly in 5G networks and next-generation wireless infrastructure, fuels significant investment in mmWave technology. Furthermore, advancements in antenna design, transceiver technologies, and related components are contributing to improved performance, reduced costs, and enhanced reliability, making mmWave solutions more accessible and attractive across various sectors. The proliferation of IoT devices and the need for seamless connectivity in dense urban environments further solidify the growth trajectory. The market is segmented by component type (antennas & transceivers, communication & networking components, interface components, frequency-related components, imaging components, and others) and licensing model (fully/partly licensed and unlicensed), catering to diverse application needs. While the initial high cost of deployment and potential challenges related to signal propagation and atmospheric interference present some restraints, ongoing technological innovation and increasing regulatory support are mitigating these issues. Geographical expansion is also a major driver, with North America, Europe, and Asia Pacific representing key markets.
The competitive landscape is dynamic, featuring established players like L3Harris Technologies, NEC Corporation, and Keysight Technologies, alongside emerging companies such as Siklu Communication and E-band Communications. These companies are actively engaged in research and development, strategic partnerships, and mergers and acquisitions to enhance their market position and capitalize on the growing demand. The continued development of more efficient and cost-effective mmWave solutions will be crucial in driving further market penetration. The increasing adoption of mmWave technology in various applications, including fixed wireless access, mobile broadband, and automotive radar, promises sustained growth in the foreseeable future, with the potential for further diversification into emerging sectors like industrial IoT and smart cities.
MM Wave Technology Industry: A Comprehensive Market Report (2019-2033)
This comprehensive report provides an in-depth analysis of the MM Wave Technology industry, covering market size, growth drivers, competitive landscape, and future outlook. The study period spans from 2019 to 2033, with 2025 serving as both the base and estimated year. The forecast period is 2025-2033, and the historical period encompasses 2019-2024. This report is essential for industry stakeholders, investors, and anyone seeking to understand the dynamics of this rapidly evolving sector.
MM Wave Technology Industry Market Concentration & Innovation
The MM Wave technology market is characterized by a moderately concentrated landscape with several key players vying for market share. While precise market share figures for each company fluctuate annually, L3Harris Technologies Inc., NEC Corporation, and Keysight Technologies Inc. consistently hold significant positions. The industry demonstrates a robust innovation ecosystem driven by the increasing demand for high-bandwidth, low-latency communication solutions. Regulatory frameworks, particularly regarding spectrum allocation and licensing, significantly influence market dynamics. Product substitutes, such as traditional microwave technologies, continue to exist, but their limitations in capacity and speed are pushing adoption towards MM Wave. End-user trends point towards increasing adoption across various sectors, including 5G infrastructure, automotive radar, and high-speed wireless backhaul. M&A activity has been moderate, with deal values averaging around xx Million USD annually over the past five years, reflecting strategic acquisitions aimed at expanding product portfolios and geographical reach. Key M&A events include:
- Strategic acquisitions aimed at expanding product portfolios and geographical reach.
- Consolidation among smaller players.
- The average M&A deal value is predicted to reach xx Million USD annually during the forecast period (2025-2033).
MM Wave Technology Industry Industry Trends & Insights
The MM Wave technology market is experiencing robust growth, driven primarily by the expanding 5G infrastructure and the increasing demand for high-bandwidth applications. The Compound Annual Growth Rate (CAGR) is projected to be xx% during the forecast period (2025-2033), exceeding the xx% recorded in the historical period (2019-2024). This growth is fuelled by technological advancements leading to miniaturization and cost reduction of MM Wave components, alongside increasing consumer preferences for seamless connectivity and high-speed data transfer. Competitive dynamics are intense, with established players and new entrants continuously innovating and vying for market share. Market penetration of MM Wave technology is steadily increasing across various sectors, with the most significant growth expected in the telecommunications and automotive industries. Technological disruptions, such as advancements in beamforming and AI-powered signal processing, continue to shape the landscape, enabling higher data rates and improved network efficiency.
Dominant Markets & Segments in MM Wave Technology Industry
The North American region currently holds the largest market share in the MM Wave technology industry, driven by robust investments in 5G infrastructure and the presence of major technology companies. However, Asia-Pacific is predicted to show the fastest growth due to rising demand for high-speed data in rapidly developing economies.
By Type of Component:
- Antennas and Transceivers: This segment dominates the market, driven by the need for high-performance components in 5G networks and other applications.
- Communications and Networking: This segment is experiencing substantial growth due to the expanding applications of MM Wave in high-speed data transmission.
- Interface, Frequency, and Related Components: Market growth is influenced by technological advancements and miniaturization trends.
- Imaging: This segment is experiencing growth due to the increased application in advanced imaging systems.
- Other Components: This segment is characterized by steady growth, driven by technological advancements and evolving application demands.
By Licensing Model:
- Fully/Partly Licensed: This segment holds a significant market share, driven by the need for reliable and secure communication in various applications.
- Unlicensed: This segment is projected to witness significant growth due to the potential for cost-effective deployment and the increased adoption of unlicensed spectrum.
Key drivers for market dominance include favorable government regulations, robust investment in infrastructure, and a strong technological base.
MM Wave Technology Industry Product Developments
Recent product innovations focus on improved antenna design for enhanced beamforming capabilities, smaller and more energy-efficient transceivers, and integrated solutions combining multiple components for ease of deployment. These innovations deliver competitive advantages by offering higher data rates, improved coverage, and reduced latency. The market trend is towards creating smaller form-factor components that are easy to integrate into existing and emerging applications such as 5G infrastructure, automotive radar, and high-speed wireless backhaul.
Report Scope & Segmentation Analysis
This report analyzes the MM Wave technology market by type of component (Antennas and Transceivers, Communications and Networking, Interface, Frequency and Related Components, Imaging, Other Components) and licensing model (Fully/Partly Licensed, Unlicensed). Each segment's market size, growth projections, and competitive dynamics are examined in detail. The report also explores the regional breakdown of the market, analyzing growth prospects in key regions such as North America, Europe, Asia-Pacific, and others.
Key Drivers of MM Wave Technology Industry Growth
Several factors fuel the growth of the MM Wave technology market. Firstly, the widespread adoption of 5G networks necessitates the use of high-frequency bands for achieving the required data rates and low latency. Secondly, advancements in chip technology have reduced the cost and size of MM Wave components, making them more accessible. Thirdly, government initiatives and investments in developing 5G infrastructure further propel market growth.
Challenges in the MM Wave Technology Industry Sector
Despite the positive growth outlook, the MM Wave technology industry faces challenges. High initial deployment costs and the limited range of MM Wave signals are barriers to wider adoption. Additionally, regulatory hurdles related to spectrum allocation and licensing can hinder market expansion. Moreover, the reliance on complex supply chains makes the industry susceptible to disruptions. The competitive pressures also limit profit margins.
Emerging Opportunities in MM Wave Technology Industry
Emerging opportunities exist in various applications, including the Internet of Things (IoT), autonomous vehicles, and high-precision location services. The development of new materials and technologies promises further advancements in antenna design and power efficiency. Expanding into untapped markets, such as smart cities and industrial automation, presents further potential for growth.
Leading Players in the MM Wave Technology Industry Market
- L3Harris Technologies Inc
- E-band Communications LLC (Axxcss Wireless Solutions Inc)
- Millimeter Wave Products Inc
- NEC Corporation
- Siklu Communication Ltd (Ceragon Networks Ltd)
- Bridgewave Communications Inc (REMEC Broadband Wireless Networks LLC)
- Keysight Technologies Inc
- Smiths Interconnect Group Limited
- Ducommun Incorporated
- Farran Technology Ltd
- Eravant (SAGE Millimeter Inc)
Key Developments in MM Wave Technology Industry Industry
- August 2023: Fujitsu's announcement of a new multibeam multiplexing millimeter-wave chip for 5G base stations signals a significant advancement in chip technology, enhancing capacity and efficiency.
- November 2023: The allocation of EUR 36 million (USD 38.95 million) to establish ten 5G Innovation Regions (5GIRs) across the UK will significantly boost the adoption and development of advanced wireless technologies, including MM Wave, creating a larger market demand and driving innovation.
Strategic Outlook for MM Wave Technology Industry Market
The MM Wave technology market is poised for continued growth, driven by expanding 5G infrastructure, technological advancements, and increasing demand for high-bandwidth applications. The market's future potential lies in the exploration of new applications, further miniaturization of components, and the development of more energy-efficient solutions. Companies that can adapt to technological disruptions and address the challenges related to cost and regulatory compliance are well-positioned to succeed in this dynamic market.
MM Wave Technology Industry Segmentation
-
1. Type of Component
- 1.1. Antennas and Transceiver
- 1.2. Communications and Networking
- 1.3. Interface
- 1.4. Frequency and Related Components
- 1.5. Imaging
- 1.6. Other Components
-
2. Licensing Model
- 2.1. Fully/Partly Licensed
- 2.2. Unlicensed
MM Wave Technology Industry Segmentation By Geography
-
1. North America
- 1.1. United States
- 1.2. Canada
-
2. Europe
- 2.1. United Kingdom
- 2.2. Germany
- 2.3. France
-
3. Asia
- 3.1. China
- 3.2. Japan
- 3.3. India
- 3.4. South Korea
- 4. Middle East and Africa
- 5. Latin America
MM Wave Technology Industry REPORT HIGHLIGHTS
| Aspects | Details |
|---|---|
| Study Period | 2019-2033 |
| Base Year | 2024 |
| Estimated Year | 2025 |
| Forecast Period | 2025-2033 |
| Historical Period | 2019-2024 |
| Growth Rate | CAGR of 24.60% from 2019-2033 |
| Segmentation |
|
Table of Contents
- 1. Introduction
- 1.1. Research Scope
- 1.2. Market Segmentation
- 1.3. Research Methodology
- 1.4. Definitions and Assumptions
- 2. Executive Summary
- 2.1. Introduction
- 3. Market Dynamics
- 3.1. Introduction
- 3.2. Market Drivers
- 3.2.1. Proliferation of Wireless Backhaul of Base Stations; Evolution of 5G is Expected to Drive the Market
- 3.3. Market Restrains
- 3.3.1. Need for Manufacturing of Compatible Components and Rising Cost of Components; Technological Vulnerabilities Leading to Reduced Wave Strength
- 3.4. Market Trends
- 3.4.1. Antennas and Transceivers Segment Holds Significant Market Share
- 4. Market Factor Analysis
- 4.1. Porters Five Forces
- 4.2. Supply/Value Chain
- 4.3. PESTEL analysis
- 4.4. Market Entropy
- 4.5. Patent/Trademark Analysis
- 5. Global MM Wave Technology Industry Analysis, Insights and Forecast, 2019-2031
- 5.1. Market Analysis, Insights and Forecast - by Type of Component
- 5.1.1. Antennas and Transceiver
- 5.1.2. Communications and Networking
- 5.1.3. Interface
- 5.1.4. Frequency and Related Components
- 5.1.5. Imaging
- 5.1.6. Other Components
- 5.2. Market Analysis, Insights and Forecast - by Licensing Model
- 5.2.1. Fully/Partly Licensed
- 5.2.2. Unlicensed
- 5.3. Market Analysis, Insights and Forecast - by Region
- 5.3.1. North America
- 5.3.2. Europe
- 5.3.3. Asia
- 5.3.4. Middle East and Africa
- 5.3.5. Latin America
- 5.1. Market Analysis, Insights and Forecast - by Type of Component
- 6. North America MM Wave Technology Industry Analysis, Insights and Forecast, 2019-2031
- 6.1. Market Analysis, Insights and Forecast - by Type of Component
- 6.1.1. Antennas and Transceiver
- 6.1.2. Communications and Networking
- 6.1.3. Interface
- 6.1.4. Frequency and Related Components
- 6.1.5. Imaging
- 6.1.6. Other Components
- 6.2. Market Analysis, Insights and Forecast - by Licensing Model
- 6.2.1. Fully/Partly Licensed
- 6.2.2. Unlicensed
- 6.1. Market Analysis, Insights and Forecast - by Type of Component
- 7. Europe MM Wave Technology Industry Analysis, Insights and Forecast, 2019-2031
- 7.1. Market Analysis, Insights and Forecast - by Type of Component
- 7.1.1. Antennas and Transceiver
- 7.1.2. Communications and Networking
- 7.1.3. Interface
- 7.1.4. Frequency and Related Components
- 7.1.5. Imaging
- 7.1.6. Other Components
- 7.2. Market Analysis, Insights and Forecast - by Licensing Model
- 7.2.1. Fully/Partly Licensed
- 7.2.2. Unlicensed
- 7.1. Market Analysis, Insights and Forecast - by Type of Component
- 8. Asia MM Wave Technology Industry Analysis, Insights and Forecast, 2019-2031
- 8.1. Market Analysis, Insights and Forecast - by Type of Component
- 8.1.1. Antennas and Transceiver
- 8.1.2. Communications and Networking
- 8.1.3. Interface
- 8.1.4. Frequency and Related Components
- 8.1.5. Imaging
- 8.1.6. Other Components
- 8.2. Market Analysis, Insights and Forecast - by Licensing Model
- 8.2.1. Fully/Partly Licensed
- 8.2.2. Unlicensed
- 8.1. Market Analysis, Insights and Forecast - by Type of Component
- 9. Middle East and Africa MM Wave Technology Industry Analysis, Insights and Forecast, 2019-2031
- 9.1. Market Analysis, Insights and Forecast - by Type of Component
- 9.1.1. Antennas and Transceiver
- 9.1.2. Communications and Networking
- 9.1.3. Interface
- 9.1.4. Frequency and Related Components
- 9.1.5. Imaging
- 9.1.6. Other Components
- 9.2. Market Analysis, Insights and Forecast - by Licensing Model
- 9.2.1. Fully/Partly Licensed
- 9.2.2. Unlicensed
- 9.1. Market Analysis, Insights and Forecast - by Type of Component
- 10. Latin America MM Wave Technology Industry Analysis, Insights and Forecast, 2019-2031
- 10.1. Market Analysis, Insights and Forecast - by Type of Component
- 10.1.1. Antennas and Transceiver
- 10.1.2. Communications and Networking
- 10.1.3. Interface
- 10.1.4. Frequency and Related Components
- 10.1.5. Imaging
- 10.1.6. Other Components
- 10.2. Market Analysis, Insights and Forecast - by Licensing Model
- 10.2.1. Fully/Partly Licensed
- 10.2.2. Unlicensed
- 10.1. Market Analysis, Insights and Forecast - by Type of Component
- 11. North America MM Wave Technology Industry Analysis, Insights and Forecast, 2019-2031
- 11.1. Market Analysis, Insights and Forecast - By Country/Sub-region
- 11.1.1 United States
- 11.1.2 Canada
- 12. Europe MM Wave Technology Industry Analysis, Insights and Forecast, 2019-2031
- 12.1. Market Analysis, Insights and Forecast - By Country/Sub-region
- 12.1.1 United Kingdom
- 12.1.2 Germany
- 12.1.3 France
- 12.1.4 Rest of Europe
- 13. Asia Pacific MM Wave Technology Industry Analysis, Insights and Forecast, 2019-2031
- 13.1. Market Analysis, Insights and Forecast - By Country/Sub-region
- 13.1.1 China
- 13.1.2 Japan
- 13.1.3 India
- 13.1.4 South Korea
- 13.1.5 Rest of Asia Pacific
- 14. Middle East and Africa MM Wave Technology Industry Analysis, Insights and Forecast, 2019-2031
- 14.1. Market Analysis, Insights and Forecast - By Country/Sub-region
- 14.1.1.
- 15. Latin America MM Wave Technology Industry Analysis, Insights and Forecast, 2019-2031
- 15.1. Market Analysis, Insights and Forecast - By Country/Sub-region
- 15.1.1.
- 16. Competitive Analysis
- 16.1. Global Market Share Analysis 2024
- 16.2. Company Profiles
- 16.2.1 L3Harris Technologies Inc
- 16.2.1.1. Overview
- 16.2.1.2. Products
- 16.2.1.3. SWOT Analysis
- 16.2.1.4. Recent Developments
- 16.2.1.5. Financials (Based on Availability)
- 16.2.2 E-band Communications LLC (Axxcss Wireless Solutions Inc )
- 16.2.2.1. Overview
- 16.2.2.2. Products
- 16.2.2.3. SWOT Analysis
- 16.2.2.4. Recent Developments
- 16.2.2.5. Financials (Based on Availability)
- 16.2.3 Millimeter Wave Products Inc
- 16.2.3.1. Overview
- 16.2.3.2. Products
- 16.2.3.3. SWOT Analysis
- 16.2.3.4. Recent Developments
- 16.2.3.5. Financials (Based on Availability)
- 16.2.4 NEC Corporation
- 16.2.4.1. Overview
- 16.2.4.2. Products
- 16.2.4.3. SWOT Analysis
- 16.2.4.4. Recent Developments
- 16.2.4.5. Financials (Based on Availability)
- 16.2.5 Siklu Communication Ltd (Ceragon Networks Ltd)
- 16.2.5.1. Overview
- 16.2.5.2. Products
- 16.2.5.3. SWOT Analysis
- 16.2.5.4. Recent Developments
- 16.2.5.5. Financials (Based on Availability)
- 16.2.6 Bridgewave Communications Inc (REMEC Broadband Wireless Networks LLC)
- 16.2.6.1. Overview
- 16.2.6.2. Products
- 16.2.6.3. SWOT Analysis
- 16.2.6.4. Recent Developments
- 16.2.6.5. Financials (Based on Availability)
- 16.2.7 Keysight Technologies Inc
- 16.2.7.1. Overview
- 16.2.7.2. Products
- 16.2.7.3. SWOT Analysis
- 16.2.7.4. Recent Developments
- 16.2.7.5. Financials (Based on Availability)
- 16.2.8 Smiths Interconnect Group Limited
- 16.2.8.1. Overview
- 16.2.8.2. Products
- 16.2.8.3. SWOT Analysis
- 16.2.8.4. Recent Developments
- 16.2.8.5. Financials (Based on Availability)
- 16.2.9 Ducommun Incorporated
- 16.2.9.1. Overview
- 16.2.9.2. Products
- 16.2.9.3. SWOT Analysis
- 16.2.9.4. Recent Developments
- 16.2.9.5. Financials (Based on Availability)
- 16.2.10 Farran Technology Ltd
- 16.2.10.1. Overview
- 16.2.10.2. Products
- 16.2.10.3. SWOT Analysis
- 16.2.10.4. Recent Developments
- 16.2.10.5. Financials (Based on Availability)
- 16.2.11 Eravant (SAGE Millimeter Inc )
- 16.2.11.1. Overview
- 16.2.11.2. Products
- 16.2.11.3. SWOT Analysis
- 16.2.11.4. Recent Developments
- 16.2.11.5. Financials (Based on Availability)
- 16.2.1 L3Harris Technologies Inc
List of Figures
- Figure 1: Global MM Wave Technology Industry Revenue Breakdown (Million, %) by Region 2024 & 2032
- Figure 2: North America MM Wave Technology Industry Revenue (Million), by Country 2024 & 2032
- Figure 3: North America MM Wave Technology Industry Revenue Share (%), by Country 2024 & 2032
- Figure 4: Europe MM Wave Technology Industry Revenue (Million), by Country 2024 & 2032
- Figure 5: Europe MM Wave Technology Industry Revenue Share (%), by Country 2024 & 2032
- Figure 6: Asia Pacific MM Wave Technology Industry Revenue (Million), by Country 2024 & 2032
- Figure 7: Asia Pacific MM Wave Technology Industry Revenue Share (%), by Country 2024 & 2032
- Figure 8: Middle East and Africa MM Wave Technology Industry Revenue (Million), by Country 2024 & 2032
- Figure 9: Middle East and Africa MM Wave Technology Industry Revenue Share (%), by Country 2024 & 2032
- Figure 10: Latin America MM Wave Technology Industry Revenue (Million), by Country 2024 & 2032
- Figure 11: Latin America MM Wave Technology Industry Revenue Share (%), by Country 2024 & 2032
- Figure 12: North America MM Wave Technology Industry Revenue (Million), by Type of Component 2024 & 2032
- Figure 13: North America MM Wave Technology Industry Revenue Share (%), by Type of Component 2024 & 2032
- Figure 14: North America MM Wave Technology Industry Revenue (Million), by Licensing Model 2024 & 2032
- Figure 15: North America MM Wave Technology Industry Revenue Share (%), by Licensing Model 2024 & 2032
- Figure 16: North America MM Wave Technology Industry Revenue (Million), by Country 2024 & 2032
- Figure 17: North America MM Wave Technology Industry Revenue Share (%), by Country 2024 & 2032
- Figure 18: Europe MM Wave Technology Industry Revenue (Million), by Type of Component 2024 & 2032
- Figure 19: Europe MM Wave Technology Industry Revenue Share (%), by Type of Component 2024 & 2032
- Figure 20: Europe MM Wave Technology Industry Revenue (Million), by Licensing Model 2024 & 2032
- Figure 21: Europe MM Wave Technology Industry Revenue Share (%), by Licensing Model 2024 & 2032
- Figure 22: Europe MM Wave Technology Industry Revenue (Million), by Country 2024 & 2032
- Figure 23: Europe MM Wave Technology Industry Revenue Share (%), by Country 2024 & 2032
- Figure 24: Asia MM Wave Technology Industry Revenue (Million), by Type of Component 2024 & 2032
- Figure 25: Asia MM Wave Technology Industry Revenue Share (%), by Type of Component 2024 & 2032
- Figure 26: Asia MM Wave Technology Industry Revenue (Million), by Licensing Model 2024 & 2032
- Figure 27: Asia MM Wave Technology Industry Revenue Share (%), by Licensing Model 2024 & 2032
- Figure 28: Asia MM Wave Technology Industry Revenue (Million), by Country 2024 & 2032
- Figure 29: Asia MM Wave Technology Industry Revenue Share (%), by Country 2024 & 2032
- Figure 30: Middle East and Africa MM Wave Technology Industry Revenue (Million), by Type of Component 2024 & 2032
- Figure 31: Middle East and Africa MM Wave Technology Industry Revenue Share (%), by Type of Component 2024 & 2032
- Figure 32: Middle East and Africa MM Wave Technology Industry Revenue (Million), by Licensing Model 2024 & 2032
- Figure 33: Middle East and Africa MM Wave Technology Industry Revenue Share (%), by Licensing Model 2024 & 2032
- Figure 34: Middle East and Africa MM Wave Technology Industry Revenue (Million), by Country 2024 & 2032
- Figure 35: Middle East and Africa MM Wave Technology Industry Revenue Share (%), by Country 2024 & 2032
- Figure 36: Latin America MM Wave Technology Industry Revenue (Million), by Type of Component 2024 & 2032
- Figure 37: Latin America MM Wave Technology Industry Revenue Share (%), by Type of Component 2024 & 2032
- Figure 38: Latin America MM Wave Technology Industry Revenue (Million), by Licensing Model 2024 & 2032
- Figure 39: Latin America MM Wave Technology Industry Revenue Share (%), by Licensing Model 2024 & 2032
- Figure 40: Latin America MM Wave Technology Industry Revenue (Million), by Country 2024 & 2032
- Figure 41: Latin America MM Wave Technology Industry Revenue Share (%), by Country 2024 & 2032
List of Tables
- Table 1: Global MM Wave Technology Industry Revenue Million Forecast, by Region 2019 & 2032
- Table 2: Global MM Wave Technology Industry Revenue Million Forecast, by Type of Component 2019 & 2032
- Table 3: Global MM Wave Technology Industry Revenue Million Forecast, by Licensing Model 2019 & 2032
- Table 4: Global MM Wave Technology Industry Revenue Million Forecast, by Region 2019 & 2032
- Table 5: Global MM Wave Technology Industry Revenue Million Forecast, by Country 2019 & 2032
- Table 6: United States MM Wave Technology Industry Revenue (Million) Forecast, by Application 2019 & 2032
- Table 7: Canada MM Wave Technology Industry Revenue (Million) Forecast, by Application 2019 & 2032
- Table 8: Global MM Wave Technology Industry Revenue Million Forecast, by Country 2019 & 2032
- Table 9: United Kingdom MM Wave Technology Industry Revenue (Million) Forecast, by Application 2019 & 2032
- Table 10: Germany MM Wave Technology Industry Revenue (Million) Forecast, by Application 2019 & 2032
- Table 11: France MM Wave Technology Industry Revenue (Million) Forecast, by Application 2019 & 2032
- Table 12: Rest of Europe MM Wave Technology Industry Revenue (Million) Forecast, by Application 2019 & 2032
- Table 13: Global MM Wave Technology Industry Revenue Million Forecast, by Country 2019 & 2032
- Table 14: China MM Wave Technology Industry Revenue (Million) Forecast, by Application 2019 & 2032
- Table 15: Japan MM Wave Technology Industry Revenue (Million) Forecast, by Application 2019 & 2032
- Table 16: India MM Wave Technology Industry Revenue (Million) Forecast, by Application 2019 & 2032
- Table 17: South Korea MM Wave Technology Industry Revenue (Million) Forecast, by Application 2019 & 2032
- Table 18: Rest of Asia Pacific MM Wave Technology Industry Revenue (Million) Forecast, by Application 2019 & 2032
- Table 19: Global MM Wave Technology Industry Revenue Million Forecast, by Country 2019 & 2032
- Table 20: MM Wave Technology Industry Revenue (Million) Forecast, by Application 2019 & 2032
- Table 21: Global MM Wave Technology Industry Revenue Million Forecast, by Country 2019 & 2032
- Table 22: MM Wave Technology Industry Revenue (Million) Forecast, by Application 2019 & 2032
- Table 23: Global MM Wave Technology Industry Revenue Million Forecast, by Type of Component 2019 & 2032
- Table 24: Global MM Wave Technology Industry Revenue Million Forecast, by Licensing Model 2019 & 2032
- Table 25: Global MM Wave Technology Industry Revenue Million Forecast, by Country 2019 & 2032
- Table 26: United States MM Wave Technology Industry Revenue (Million) Forecast, by Application 2019 & 2032
- Table 27: Canada MM Wave Technology Industry Revenue (Million) Forecast, by Application 2019 & 2032
- Table 28: Global MM Wave Technology Industry Revenue Million Forecast, by Type of Component 2019 & 2032
- Table 29: Global MM Wave Technology Industry Revenue Million Forecast, by Licensing Model 2019 & 2032
- Table 30: Global MM Wave Technology Industry Revenue Million Forecast, by Country 2019 & 2032
- Table 31: United Kingdom MM Wave Technology Industry Revenue (Million) Forecast, by Application 2019 & 2032
- Table 32: Germany MM Wave Technology Industry Revenue (Million) Forecast, by Application 2019 & 2032
- Table 33: France MM Wave Technology Industry Revenue (Million) Forecast, by Application 2019 & 2032
- Table 34: Global MM Wave Technology Industry Revenue Million Forecast, by Type of Component 2019 & 2032
- Table 35: Global MM Wave Technology Industry Revenue Million Forecast, by Licensing Model 2019 & 2032
- Table 36: Global MM Wave Technology Industry Revenue Million Forecast, by Country 2019 & 2032
- Table 37: China MM Wave Technology Industry Revenue (Million) Forecast, by Application 2019 & 2032
- Table 38: Japan MM Wave Technology Industry Revenue (Million) Forecast, by Application 2019 & 2032
- Table 39: India MM Wave Technology Industry Revenue (Million) Forecast, by Application 2019 & 2032
- Table 40: South Korea MM Wave Technology Industry Revenue (Million) Forecast, by Application 2019 & 2032
- Table 41: Global MM Wave Technology Industry Revenue Million Forecast, by Type of Component 2019 & 2032
- Table 42: Global MM Wave Technology Industry Revenue Million Forecast, by Licensing Model 2019 & 2032
- Table 43: Global MM Wave Technology Industry Revenue Million Forecast, by Country 2019 & 2032
- Table 44: Global MM Wave Technology Industry Revenue Million Forecast, by Type of Component 2019 & 2032
- Table 45: Global MM Wave Technology Industry Revenue Million Forecast, by Licensing Model 2019 & 2032
- Table 46: Global MM Wave Technology Industry Revenue Million Forecast, by Country 2019 & 2032
Frequently Asked Questions
1. What is the projected Compound Annual Growth Rate (CAGR) of the MM Wave Technology Industry?
The projected CAGR is approximately 24.60%.
2. Which companies are prominent players in the MM Wave Technology Industry?
Key companies in the market include L3Harris Technologies Inc, E-band Communications LLC (Axxcss Wireless Solutions Inc ), Millimeter Wave Products Inc, NEC Corporation, Siklu Communication Ltd (Ceragon Networks Ltd), Bridgewave Communications Inc (REMEC Broadband Wireless Networks LLC), Keysight Technologies Inc, Smiths Interconnect Group Limited, Ducommun Incorporated, Farran Technology Ltd, Eravant (SAGE Millimeter Inc ).
3. What are the main segments of the MM Wave Technology Industry?
The market segments include Type of Component, Licensing Model.
4. Can you provide details about the market size?
The market size is estimated to be USD 3.63 Million as of 2022.
5. What are some drivers contributing to market growth?
Proliferation of Wireless Backhaul of Base Stations; Evolution of 5G is Expected to Drive the Market.
6. What are the notable trends driving market growth?
Antennas and Transceivers Segment Holds Significant Market Share.
7. Are there any restraints impacting market growth?
Need for Manufacturing of Compatible Components and Rising Cost of Components; Technological Vulnerabilities Leading to Reduced Wave Strength.
8. Can you provide examples of recent developments in the market?
November 2023 - Throughout the UK, localities were aided in adopting advanced wireless technologies and enhancing their digital connectivity, including drones to monitor livestock and crops, smart systems to decrease congestion, and moveable 5G networks to allow super-fast live programs from remote locations. The ten multi-local authority zones across all four parts of the UK will obtain a share of EUR 36 million (USD 38.95 million) as they develop into 5G Innovation Regions (5GIRs). The capital will drive the adoption and development of advanced wireless technologies, including 5G, ensuring groups in cities, towns, and rural areas fully benefit from the benefits advanced digital technologies and wireless connectivity can provide and attract commercial investment to develop the economy.
9. What pricing options are available for accessing the report?
Pricing options include single-user, multi-user, and enterprise licenses priced at USD 4750, USD 5250, and USD 8750 respectively.
10. Is the market size provided in terms of value or volume?
The market size is provided in terms of value, measured in Million.
11. Are there any specific market keywords associated with the report?
Yes, the market keyword associated with the report is "MM Wave Technology Industry," which aids in identifying and referencing the specific market segment covered.
12. How do I determine which pricing option suits my needs best?
The pricing options vary based on user requirements and access needs. Individual users may opt for single-user licenses, while businesses requiring broader access may choose multi-user or enterprise licenses for cost-effective access to the report.
13. Are there any additional resources or data provided in the MM Wave Technology Industry report?
While the report offers comprehensive insights, it's advisable to review the specific contents or supplementary materials provided to ascertain if additional resources or data are available.
14. How can I stay updated on further developments or reports in the MM Wave Technology Industry?
To stay informed about further developments, trends, and reports in the MM Wave Technology Industry, consider subscribing to industry newsletters, following relevant companies and organizations, or regularly checking reputable industry news sources and publications.
Methodology
Step 1 - Identification of Relevant Samples Size from Population Database


Step 2 - Approaches for Defining Global Market Size (Value, Volume* & Price*)

Note*: In applicable scenarios
Step 3 - Data Sources
Primary Research
- Web Analytics
- Survey Reports
- Research Institute
- Latest Research Reports
- Opinion Leaders
Secondary Research
- Annual Reports
- White Paper
- Latest Press Release
- Industry Association
- Paid Database
- Investor Presentations

Step 4 - Data Triangulation
Involves using different sources of information in order to increase the validity of a study
These sources are likely to be stakeholders in a program - participants, other researchers, program staff, other community members, and so on.
Then we put all data in single framework & apply various statistical tools to find out the dynamic on the market.
During the analysis stage, feedback from the stakeholder groups would be compared to determine areas of agreement as well as areas of divergence


