

Key Insights
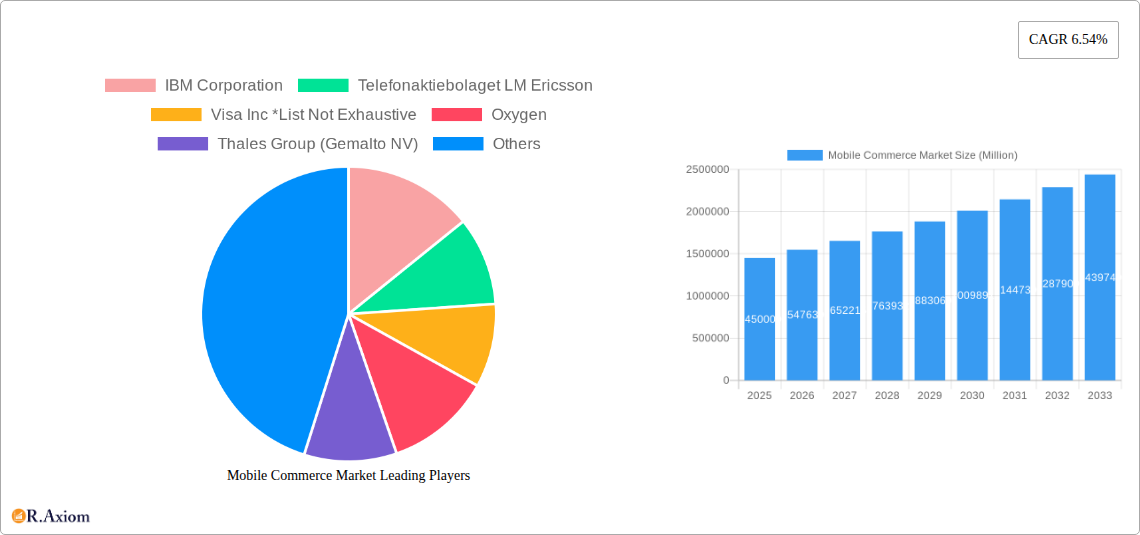
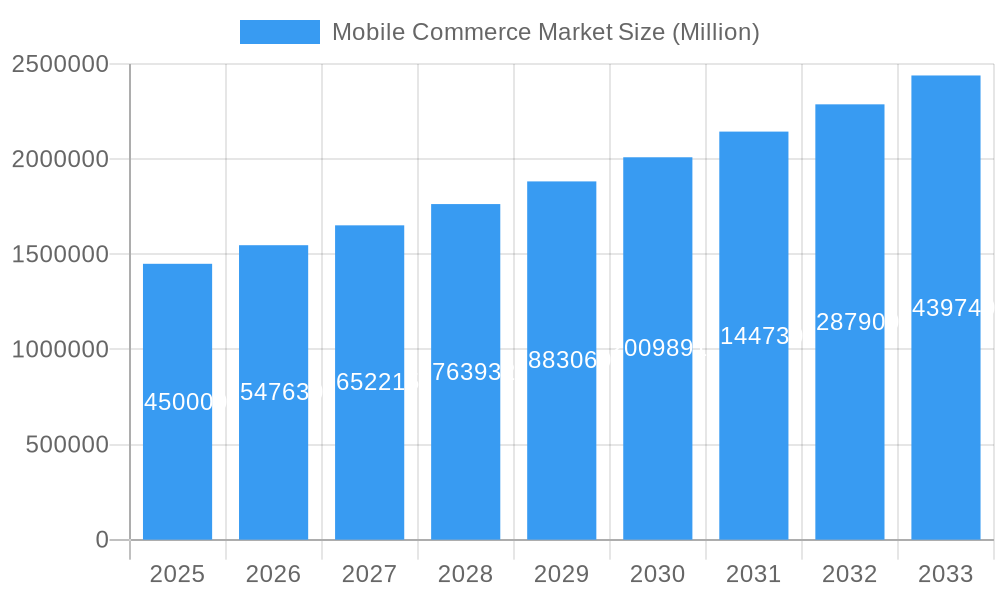
The mobile commerce market, valued at $1.45 trillion in 2025, is projected to experience robust growth, driven by the increasing adoption of smartphones, rising internet penetration, and the expanding preference for convenient digital transactions. The market's Compound Annual Growth Rate (CAGR) of 6.54% from 2019 to 2024 indicates a consistent upward trajectory. Key growth drivers include the seamless integration of mobile payment technologies like Near Field Communication (NFC), premium SMS, and mobile wallets, facilitating faster and more secure transactions. The rise of mobile retailing, ticketing/booking services, and mobile billing further fuels market expansion. While challenges such as security concerns and the digital divide in certain regions persist, innovative solutions such as improved fraud prevention measures and the increasing affordability of smartphones are mitigating these restraints. The market segmentation by payment mode highlights the diverse options available to consumers, while the segmentation by transaction type reflects the broad applications of mobile commerce across various industries. Major players like IBM, Ericsson, Visa, Mastercard, and Google are heavily invested in driving innovation and expansion within this dynamic market, constantly developing new technologies and strategies to enhance user experience and security. The geographical distribution reveals that North America and Asia Pacific are currently leading markets, yet regions like Latin America and Africa show significant potential for future growth based on increasing smartphone penetration and developing digital infrastructure.
Mobile Commerce Market Market Size (In Million)
The forecast period (2025-2033) anticipates continued market expansion, influenced by several factors. The increasing integration of mobile commerce with social media platforms is expected to drive further growth. The development of advanced technologies like 5G networks will enhance the speed and reliability of mobile transactions, thereby boosting customer confidence and adoption rates. Additionally, the growing adoption of mobile banking and the rise of Buy Now Pay Later (BNPL) schemes are expected to contribute significantly to the expansion of the mobile commerce market during the forecast period. Regional variations in growth are expected, with emerging markets in Asia Pacific and Africa showing potentially higher growth rates than mature markets like North America and Europe. However, regulatory hurdles and varying levels of digital literacy across regions could potentially influence the growth trajectory in different geographical areas.
Mobile Commerce Market Company Market Share
Mobile Commerce Market: A Comprehensive Report (2019-2033)
This in-depth report provides a comprehensive analysis of the Mobile Commerce Market, covering market size, growth drivers, challenges, opportunities, and key players. The study period spans from 2019 to 2033, with 2025 serving as the base and estimated year. The forecast period is 2025-2033, and the historical period encompasses 2019-2024. This report is essential for businesses, investors, and stakeholders seeking to understand and capitalize on the dynamic mobile commerce landscape.
Mobile Commerce Market Concentration & Innovation
The Mobile Commerce Market exhibits a moderately concentrated structure, with a few dominant players commanding significant market share. The market share of the top five players in 2025 is estimated at xx%, indicating a level of consolidation. However, the market also presents significant opportunities for smaller, specialized players. Innovation is a key driver, fueled by advancements in mobile technology, payment systems, and e-commerce platforms. Regulatory frameworks, while varied across different regions, are increasingly focused on consumer protection and data privacy, shaping market practices. Product substitutes, such as traditional e-commerce and in-person shopping, continue to exist, but the convenience and ubiquity of mobile commerce are steadily eroding their market share. End-user trends show a growing preference for seamless, personalized mobile shopping experiences, driving demand for innovative solutions. Mergers and acquisitions (M&A) activity is relatively high, with deal values reaching an estimated xx Million in 2024, reflecting the consolidation and strategic expansion within the sector. Key M&A activities include:
- Strategic acquisitions to expand product portfolios and geographical reach.
- Consolidation among payment gateway providers to enhance market dominance.
- Investments in innovative mobile commerce technologies like AI-powered recommendation engines.
Mobile Commerce Market Industry Trends & Insights
The Mobile Commerce Market is experiencing robust growth, driven by the increasing penetration of smartphones, rising internet and mobile data usage, and the growing preference for convenient and cashless transactions. The Compound Annual Growth Rate (CAGR) from 2025 to 2033 is projected to be xx%, indicating significant market expansion. Market penetration is steadily increasing, with a significant portion of the global population now using mobile devices for online shopping. Technological disruptions, particularly advancements in 5G technology, mobile payment systems, and augmented reality (AR) applications, are transforming the mobile commerce landscape, enhancing user experience and opening new avenues for growth. Consumer preferences are shifting towards personalized shopping experiences, secure payment options, and faster delivery times. Competitive dynamics are intense, with established players and new entrants vying for market share through innovation, strategic partnerships, and aggressive marketing campaigns. The market is witnessing a significant shift towards mobile-first strategies by businesses across various sectors, accelerating the adoption of mobile commerce solutions.
Dominant Markets & Segments in Mobile Commerce Market
The Asia-Pacific region is currently the dominant market for mobile commerce, driven by factors such as a large and rapidly growing smartphone user base, increasing internet and mobile data penetration, and supportive government policies. Within this region, countries like China and India are leading the charge. Key drivers for the dominance of this region include:
- Strong economic growth: fueling increased consumer spending and adoption of mobile commerce.
- Favorable demographics: a large young population comfortable with technology.
- Robust mobile infrastructure: extensive network coverage supporting high data usage.
By Payment Mode: Direct Carrier Billing is experiencing rapid growth due to its ease of use and high accessibility, particularly in emerging markets. NFC payments are becoming increasingly popular in developed markets with high smartphone penetration.
By Transaction Type: M-Retailing holds the largest market share due to the increasing preference for online shopping across various retail sectors. M-Ticketing/Booking is also gaining traction, driven by the growing adoption of mobile applications for travel and event bookings.
Mobile Commerce Market Product Developments
Recent product innovations focus on enhancing user experience, security, and personalization. These include AI-powered recommendation engines, augmented reality (AR) shopping experiences, and improved mobile payment gateways. These developments provide competitive advantages by offering more convenient, engaging, and personalized shopping experiences. Key technological trends such as the use of blockchain for secure transactions and the integration of IoT devices into the shopping ecosystem are further driving product evolution.
Report Scope & Segmentation Analysis
This report analyzes the Mobile Commerce Market across various segments.
By Payment Mode: Near Field Communication (NFC), Premium SMS, Wireless Application Protocol (WAP), Direct Carrier Billing, and Other Payment Modes. Each segment's growth projection, market size, and competitive dynamics are detailed.
By Transaction Type: M-Retailing, M-Ticketing/Booking, M-Billing, and Other Transaction Types. Each segment's unique growth drivers and market characteristics are discussed. Growth projections for each segment are provided, along with an analysis of market size and competition.
Key Drivers of Mobile Commerce Market Growth
Several factors contribute to the growth of the Mobile Commerce Market:
- Increased smartphone penetration: The widespread adoption of smartphones globally fuels mobile commerce growth.
- Improved mobile internet infrastructure: Faster and more reliable internet access enables seamless mobile shopping.
- Enhanced mobile payment systems: Secure and convenient mobile payment options encourage online transactions.
- Government support and regulatory frameworks: Policies that encourage digital payments and e-commerce boost market growth.
Challenges in the Mobile Commerce Market Sector
The Mobile Commerce Market faces several challenges:
- Security concerns: Data breaches and fraudulent transactions pose significant risks to both consumers and businesses. The impact is a loss of consumer confidence and increased operational costs for businesses to mitigate risks.
- Limited internet access in certain regions: Unequal access to mobile internet limits the potential market reach.
- Lack of digital literacy: A significant portion of the population lacks the digital skills to utilize mobile commerce effectively.
Emerging Opportunities in Mobile Commerce Market
The Mobile Commerce Market presents exciting opportunities:
- Expansion into new markets: Untapped markets in developing countries offer immense potential for growth.
- Integration of new technologies: AR/VR and AI offer opportunities for enhanced shopping experiences and personalization.
- Focus on niche markets: Specialized mobile commerce platforms cater to specific consumer needs.
Leading Players in the Mobile Commerce Market Market
Key Developments in Mobile Commerce Market Industry
- September 2023: Ericsson announced a strategy to create a global network platform business with network APIs, partnering with Deutsche Telekom to provide developers with advanced 5G capabilities via Network APIs. This development fosters innovation and new revenue streams for mobile operators, driving further mobile commerce development.
- March 2023: Amazon Business launched a 3-Way Match feature on its mobile app, simplifying purchase order closure for nearly 1 Million users. This enhances efficiency and convenience for businesses using the app, driving further adoption of mobile commerce for B2B transactions.
Strategic Outlook for Mobile Commerce Market Market
The Mobile Commerce Market is poised for continued growth, driven by technological advancements, increasing smartphone penetration, and evolving consumer preferences. Future opportunities lie in personalized shopping experiences, enhanced security measures, and the integration of emerging technologies like AR/VR and AI. The market will see further consolidation and strategic partnerships among key players as they seek to dominate the evolving landscape.
Mobile Commerce Market Segmentation
-
1. Transaction Type
- 1.1. M Retailing
- 1.2. M Ticketing/Booking
- 1.3. M Billing
- 1.4. Other Transaction Types
-
2. Payment Mode
- 2.1. Near Field Communication (NFC)
- 2.2. Premium SMS
- 2.3. Wireless Application Protocol (WAP)
- 2.4. Direct Carrier Billing
- 2.5. Other Payment Modes
Mobile Commerce Market Segmentation By Geography
-
1. North America
- 1.1. United States
- 1.2. Canada
-
2. Europe
- 2.1. United Kingdom
- 2.2. Germany
- 2.3. France
- 2.4. Rest of Europe
-
3. Asia Pacific
- 3.1. China
- 3.2. Japan
- 3.3. India
- 3.4. Rest of Asia Pacific
-
4. Latin America
- 4.1. Brazil
- 4.2. Argentina
- 4.3. Rest of Latin America
-
5. Middle East and Africa
- 5.1. UAE
- 5.2. Saudi Arabia
- 5.3. Rest of Middle East and Africa
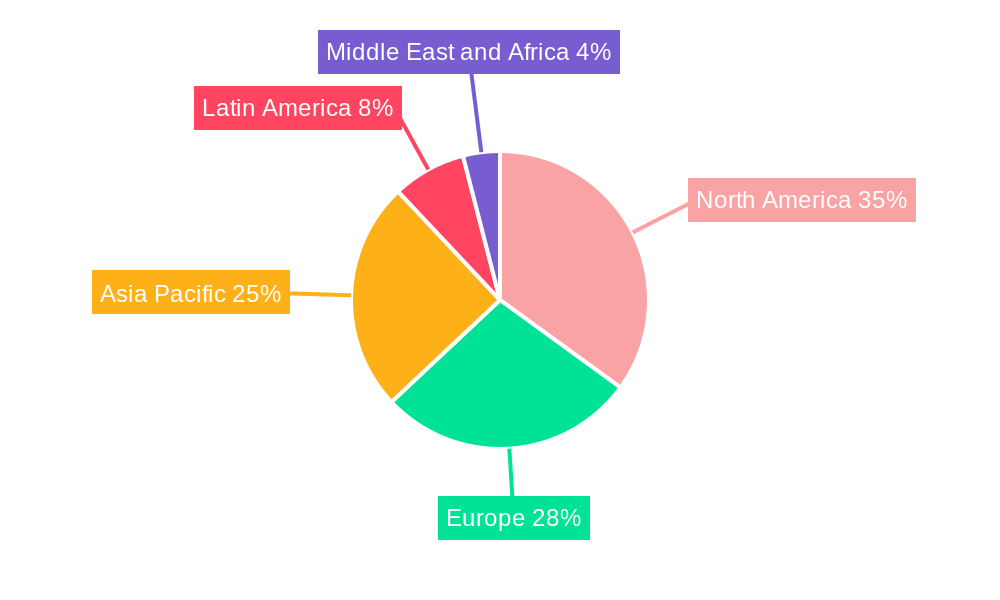
Mobile Commerce Market Regional Market Share
Geographic Coverage of Mobile Commerce Market
Mobile Commerce Market REPORT HIGHLIGHTS
| Aspects | Details |
|---|---|
| Study Period | 2020-2034 |
| Base Year | 2025 |
| Estimated Year | 2026 |
| Forecast Period | 2026-2034 |
| Historical Period | 2020-2025 |
| Growth Rate | CAGR of 6.54% from 2020-2034 |
| Segmentation |
|
Table of Contents
- 1. Introduction
- 1.1. Research Scope
- 1.2. Market Segmentation
- 1.3. Research Objective
- 1.4. Definitions and Assumptions
- 2. Executive Summary
- 2.1. Market Snapshot
- 3. Market Dynamics
- 3.1. Market Drivers
- 3.2. Market Restrains
- 3.3. Market Trends
- 3.4. Market Opportunities
- 4. Market Factor Analysis
- 4.1. Porters Five Forces
- 4.1.1. Bargaining Power of Suppliers
- 4.1.2. Bargaining Power of Buyers
- 4.1.3. Threat of New Entrants
- 4.1.4. Threat of Substitutes
- 4.1.5. Competitive Rivalry
- 4.2. PESTEL analysis
- 4.3. BCG Analysis
- 4.3.1. Stars (High Growth, High Market Share)
- 4.3.2. Cash Cows (Low Growth, High Market Share)
- 4.3.3. Question Mark (High Growth, Low Market Share)
- 4.3.4. Dogs (Low Growth, Low Market Share)
- 4.4. Ansoff Matrix Analysis
- 4.5. Supply Chain Analysis
- 4.6. Regulatory Landscape
- 4.7. Current Market Potential and Opportunity Assessment (TAM–SAM–SOM Framework)
- 4.8. RAX Analyst Note
- 4.1. Porters Five Forces
- 5. Market Analysis, Insights and Forecast 2021-2033
- 5.1. Market Analysis, Insights and Forecast - by Transaction Type
- 5.1.1. M Retailing
- 5.1.2. M Ticketing/Booking
- 5.1.3. M Billing
- 5.1.4. Other Transaction Types
- 5.2. Market Analysis, Insights and Forecast - by Payment Mode
- 5.2.1. Near Field Communication (NFC)
- 5.2.2. Premium SMS
- 5.2.3. Wireless Application Protocol (WAP)
- 5.2.4. Direct Carrier Billing
- 5.2.5. Other Payment Modes
- 5.3. Market Analysis, Insights and Forecast - by Region
- 5.3.1. North America
- 5.3.2. Europe
- 5.3.3. Asia Pacific
- 5.3.4. Latin America
- 5.3.5. Middle East and Africa
- 5.1. Market Analysis, Insights and Forecast - by Transaction Type
- 6. Global Mobile Commerce Market Analysis, Insights and Forecast, 2021-2033
- 6.1. Market Analysis, Insights and Forecast - by Transaction Type
- 6.1.1. M Retailing
- 6.1.2. M Ticketing/Booking
- 6.1.3. M Billing
- 6.1.4. Other Transaction Types
- 6.2. Market Analysis, Insights and Forecast - by Payment Mode
- 6.2.1. Near Field Communication (NFC)
- 6.2.2. Premium SMS
- 6.2.3. Wireless Application Protocol (WAP)
- 6.2.4. Direct Carrier Billing
- 6.2.5. Other Payment Modes
- 6.1. Market Analysis, Insights and Forecast - by Transaction Type
- 7. North America Mobile Commerce Market Analysis, Insights and Forecast, 2020-2032
- 7.1. Market Analysis, Insights and Forecast - by Transaction Type
- 7.1.1. M Retailing
- 7.1.2. M Ticketing/Booking
- 7.1.3. M Billing
- 7.1.4. Other Transaction Types
- 7.2. Market Analysis, Insights and Forecast - by Payment Mode
- 7.2.1. Near Field Communication (NFC)
- 7.2.2. Premium SMS
- 7.2.3. Wireless Application Protocol (WAP)
- 7.2.4. Direct Carrier Billing
- 7.2.5. Other Payment Modes
- 7.1. Market Analysis, Insights and Forecast - by Transaction Type
- 8. Europe Mobile Commerce Market Analysis, Insights and Forecast, 2020-2032
- 8.1. Market Analysis, Insights and Forecast - by Transaction Type
- 8.1.1. M Retailing
- 8.1.2. M Ticketing/Booking
- 8.1.3. M Billing
- 8.1.4. Other Transaction Types
- 8.2. Market Analysis, Insights and Forecast - by Payment Mode
- 8.2.1. Near Field Communication (NFC)
- 8.2.2. Premium SMS
- 8.2.3. Wireless Application Protocol (WAP)
- 8.2.4. Direct Carrier Billing
- 8.2.5. Other Payment Modes
- 8.1. Market Analysis, Insights and Forecast - by Transaction Type
- 9. Asia Pacific Mobile Commerce Market Analysis, Insights and Forecast, 2020-2032
- 9.1. Market Analysis, Insights and Forecast - by Transaction Type
- 9.1.1. M Retailing
- 9.1.2. M Ticketing/Booking
- 9.1.3. M Billing
- 9.1.4. Other Transaction Types
- 9.2. Market Analysis, Insights and Forecast - by Payment Mode
- 9.2.1. Near Field Communication (NFC)
- 9.2.2. Premium SMS
- 9.2.3. Wireless Application Protocol (WAP)
- 9.2.4. Direct Carrier Billing
- 9.2.5. Other Payment Modes
- 9.1. Market Analysis, Insights and Forecast - by Transaction Type
- 10. Latin America Mobile Commerce Market Analysis, Insights and Forecast, 2020-2032
- 10.1. Market Analysis, Insights and Forecast - by Transaction Type
- 10.1.1. M Retailing
- 10.1.2. M Ticketing/Booking
- 10.1.3. M Billing
- 10.1.4. Other Transaction Types
- 10.2. Market Analysis, Insights and Forecast - by Payment Mode
- 10.2.1. Near Field Communication (NFC)
- 10.2.2. Premium SMS
- 10.2.3. Wireless Application Protocol (WAP)
- 10.2.4. Direct Carrier Billing
- 10.2.5. Other Payment Modes
- 10.1. Market Analysis, Insights and Forecast - by Transaction Type
- 11. Middle East and Africa Mobile Commerce Market Analysis, Insights and Forecast, 2020-2032
- 11.1. Market Analysis, Insights and Forecast - by Transaction Type
- 11.1.1. M Retailing
- 11.1.2. M Ticketing/Booking
- 11.1.3. M Billing
- 11.1.4. Other Transaction Types
- 11.2. Market Analysis, Insights and Forecast - by Payment Mode
- 11.2.1. Near Field Communication (NFC)
- 11.2.2. Premium SMS
- 11.2.3. Wireless Application Protocol (WAP)
- 11.2.4. Direct Carrier Billing
- 11.2.5. Other Payment Modes
- 11.1. Market Analysis, Insights and Forecast - by Transaction Type
- 12. Competitive Analysis
- 12.1. Company Profiles
- 12.1.1 IBM Corporation
- 12.1.1.1. Company Overview
- 12.1.1.2. Products
- 12.1.1.3. Company Financials
- 12.1.1.4. SWOT Analysis
- 12.1.2 Telefonaktiebolaget LM Ericsson
- 12.1.2.1. Company Overview
- 12.1.2.2. Products
- 12.1.2.3. Company Financials
- 12.1.2.4. SWOT Analysis
- 12.1.3 Visa Inc *List Not Exhaustive
- 12.1.3.1. Company Overview
- 12.1.3.2. Products
- 12.1.3.3. Company Financials
- 12.1.3.4. SWOT Analysis
- 12.1.4 Oxygen
- 12.1.4.1. Company Overview
- 12.1.4.2. Products
- 12.1.4.3. Company Financials
- 12.1.4.4. SWOT Analysis
- 12.1.5 Thales Group (Gemalto NV)
- 12.1.5.1. Company Overview
- 12.1.5.2. Products
- 12.1.5.3. Company Financials
- 12.1.5.4. SWOT Analysis
- 12.1.6 Mastercard Inc
- 12.1.6.1. Company Overview
- 12.1.6.2. Products
- 12.1.6.3. Company Financials
- 12.1.6.4. SWOT Analysis
- 12.1.7 Google Inc
- 12.1.7.1. Company Overview
- 12.1.7.2. Products
- 12.1.7.3. Company Financials
- 12.1.7.4. SWOT Analysis
- 12.1.8 Paypal Holdings Inc
- 12.1.8.1. Company Overview
- 12.1.8.2. Products
- 12.1.8.3. Company Financials
- 12.1.8.4. SWOT Analysis
- 12.1.9 SAP SE
- 12.1.9.1. Company Overview
- 12.1.9.2. Products
- 12.1.9.3. Company Financials
- 12.1.9.4. SWOT Analysis
- 12.1.10 Mopay AG
- 12.1.10.1. Company Overview
- 12.1.10.2. Products
- 12.1.10.3. Company Financials
- 12.1.10.4. SWOT Analysis
- 12.1.1 IBM Corporation
- 12.2. Market Entropy
- 12.2.1 Company's Key Areas Served
- 12.2.2 Recent Developments
- 12.3. Company Market Share Analysis 2025
- 12.3.1 Top 5 Companies Market Share Analysis
- 12.3.2 Top 3 Companies Market Share Analysis
- 12.4. List of Potential Customers
- 13. Research Methodology
List of Figures
- Figure 1: Global Mobile Commerce Market Revenue Breakdown (Million, %) by Region 2025 & 2033
- Figure 2: North America Mobile Commerce Market Revenue (Million), by Transaction Type 2025 & 2033
- Figure 3: North America Mobile Commerce Market Revenue Share (%), by Transaction Type 2025 & 2033
- Figure 4: North America Mobile Commerce Market Revenue (Million), by Payment Mode 2025 & 2033
- Figure 5: North America Mobile Commerce Market Revenue Share (%), by Payment Mode 2025 & 2033
- Figure 6: North America Mobile Commerce Market Revenue (Million), by Country 2025 & 2033
- Figure 7: North America Mobile Commerce Market Revenue Share (%), by Country 2025 & 2033
- Figure 8: Europe Mobile Commerce Market Revenue (Million), by Transaction Type 2025 & 2033
- Figure 9: Europe Mobile Commerce Market Revenue Share (%), by Transaction Type 2025 & 2033
- Figure 10: Europe Mobile Commerce Market Revenue (Million), by Payment Mode 2025 & 2033
- Figure 11: Europe Mobile Commerce Market Revenue Share (%), by Payment Mode 2025 & 2033
- Figure 12: Europe Mobile Commerce Market Revenue (Million), by Country 2025 & 2033
- Figure 13: Europe Mobile Commerce Market Revenue Share (%), by Country 2025 & 2033
- Figure 14: Asia Pacific Mobile Commerce Market Revenue (Million), by Transaction Type 2025 & 2033
- Figure 15: Asia Pacific Mobile Commerce Market Revenue Share (%), by Transaction Type 2025 & 2033
- Figure 16: Asia Pacific Mobile Commerce Market Revenue (Million), by Payment Mode 2025 & 2033
- Figure 17: Asia Pacific Mobile Commerce Market Revenue Share (%), by Payment Mode 2025 & 2033
- Figure 18: Asia Pacific Mobile Commerce Market Revenue (Million), by Country 2025 & 2033
- Figure 19: Asia Pacific Mobile Commerce Market Revenue Share (%), by Country 2025 & 2033
- Figure 20: Latin America Mobile Commerce Market Revenue (Million), by Transaction Type 2025 & 2033
- Figure 21: Latin America Mobile Commerce Market Revenue Share (%), by Transaction Type 2025 & 2033
- Figure 22: Latin America Mobile Commerce Market Revenue (Million), by Payment Mode 2025 & 2033
- Figure 23: Latin America Mobile Commerce Market Revenue Share (%), by Payment Mode 2025 & 2033
- Figure 24: Latin America Mobile Commerce Market Revenue (Million), by Country 2025 & 2033
- Figure 25: Latin America Mobile Commerce Market Revenue Share (%), by Country 2025 & 2033
- Figure 26: Middle East and Africa Mobile Commerce Market Revenue (Million), by Transaction Type 2025 & 2033
- Figure 27: Middle East and Africa Mobile Commerce Market Revenue Share (%), by Transaction Type 2025 & 2033
- Figure 28: Middle East and Africa Mobile Commerce Market Revenue (Million), by Payment Mode 2025 & 2033
- Figure 29: Middle East and Africa Mobile Commerce Market Revenue Share (%), by Payment Mode 2025 & 2033
- Figure 30: Middle East and Africa Mobile Commerce Market Revenue (Million), by Country 2025 & 2033
- Figure 31: Middle East and Africa Mobile Commerce Market Revenue Share (%), by Country 2025 & 2033
List of Tables
- Table 1: Global Mobile Commerce Market Revenue Million Forecast, by Transaction Type 2020 & 2033
- Table 2: Global Mobile Commerce Market Revenue Million Forecast, by Payment Mode 2020 & 2033
- Table 3: Global Mobile Commerce Market Revenue Million Forecast, by Region 2020 & 2033
- Table 4: Global Mobile Commerce Market Revenue Million Forecast, by Transaction Type 2020 & 2033
- Table 5: Global Mobile Commerce Market Revenue Million Forecast, by Payment Mode 2020 & 2033
- Table 6: Global Mobile Commerce Market Revenue Million Forecast, by Country 2020 & 2033
- Table 7: United States Mobile Commerce Market Revenue (Million) Forecast, by Application 2020 & 2033
- Table 8: Canada Mobile Commerce Market Revenue (Million) Forecast, by Application 2020 & 2033
- Table 9: Global Mobile Commerce Market Revenue Million Forecast, by Transaction Type 2020 & 2033
- Table 10: Global Mobile Commerce Market Revenue Million Forecast, by Payment Mode 2020 & 2033
- Table 11: Global Mobile Commerce Market Revenue Million Forecast, by Country 2020 & 2033
- Table 12: United Kingdom Mobile Commerce Market Revenue (Million) Forecast, by Application 2020 & 2033
- Table 13: Germany Mobile Commerce Market Revenue (Million) Forecast, by Application 2020 & 2033
- Table 14: France Mobile Commerce Market Revenue (Million) Forecast, by Application 2020 & 2033
- Table 15: Rest of Europe Mobile Commerce Market Revenue (Million) Forecast, by Application 2020 & 2033
- Table 16: Global Mobile Commerce Market Revenue Million Forecast, by Transaction Type 2020 & 2033
- Table 17: Global Mobile Commerce Market Revenue Million Forecast, by Payment Mode 2020 & 2033
- Table 18: Global Mobile Commerce Market Revenue Million Forecast, by Country 2020 & 2033
- Table 19: China Mobile Commerce Market Revenue (Million) Forecast, by Application 2020 & 2033
- Table 20: Japan Mobile Commerce Market Revenue (Million) Forecast, by Application 2020 & 2033
- Table 21: India Mobile Commerce Market Revenue (Million) Forecast, by Application 2020 & 2033
- Table 22: Rest of Asia Pacific Mobile Commerce Market Revenue (Million) Forecast, by Application 2020 & 2033
- Table 23: Global Mobile Commerce Market Revenue Million Forecast, by Transaction Type 2020 & 2033
- Table 24: Global Mobile Commerce Market Revenue Million Forecast, by Payment Mode 2020 & 2033
- Table 25: Global Mobile Commerce Market Revenue Million Forecast, by Country 2020 & 2033
- Table 26: Brazil Mobile Commerce Market Revenue (Million) Forecast, by Application 2020 & 2033
- Table 27: Argentina Mobile Commerce Market Revenue (Million) Forecast, by Application 2020 & 2033
- Table 28: Rest of Latin America Mobile Commerce Market Revenue (Million) Forecast, by Application 2020 & 2033
- Table 29: Global Mobile Commerce Market Revenue Million Forecast, by Transaction Type 2020 & 2033
- Table 30: Global Mobile Commerce Market Revenue Million Forecast, by Payment Mode 2020 & 2033
- Table 31: Global Mobile Commerce Market Revenue Million Forecast, by Country 2020 & 2033
- Table 32: UAE Mobile Commerce Market Revenue (Million) Forecast, by Application 2020 & 2033
- Table 33: Saudi Arabia Mobile Commerce Market Revenue (Million) Forecast, by Application 2020 & 2033
- Table 34: Rest of Middle East and Africa Mobile Commerce Market Revenue (Million) Forecast, by Application 2020 & 2033
Frequently Asked Questions
1. What is the projected Compound Annual Growth Rate (CAGR) of the Mobile Commerce Market?
The projected CAGR is approximately 6.54%.
2. Which companies are prominent players in the Mobile Commerce Market?
Key companies in the market include IBM Corporation, Telefonaktiebolaget LM Ericsson, Visa Inc *List Not Exhaustive, Oxygen, Thales Group (Gemalto NV), Mastercard Inc, Google Inc, Paypal Holdings Inc, SAP SE, Mopay AG.
3. What are the main segments of the Mobile Commerce Market?
The market segments include Transaction Type, Payment Mode.
4. Can you provide details about the market size?
The market size is estimated to be USD 1.45 Million as of 2022.
5. What are some drivers contributing to market growth?
Growth of Smartphones and Internet Penetration Drive the M-commerce Market; Broader Reach Due to Mobility.
6. What are the notable trends driving market growth?
Growth of Smartphones And Internet Penetration Is Anticipated To Drive The M-commerce Market.
7. Are there any restraints impacting market growth?
Lack of High Number Mobile Compatible Websites.
8. Can you provide examples of recent developments in the market?
September 2023: Ericsson announced the company’s strategy to create a global network platform business with network APIs. A commercial partnership has been formed between Ericsson and Deutsche Telekom to provide developers and enterprises with communication and network APIs. The central part of the Ericsson enterprise strategy is to build a Global Platform for exposing advanced 5G capabilities, e.g., quality on demand, speed, latency, and location via simple use of Network APIs. This will make it easier for developers and businesses to integrate network features in their applications, accelerating the digitization of enterprises and creating new opportunities for operators to derive revenue from these investments.
9. What pricing options are available for accessing the report?
Pricing options include single-user, multi-user, and enterprise licenses priced at USD 4750, USD 5250, and USD 8750 respectively.
10. Is the market size provided in terms of value or volume?
The market size is provided in terms of value, measured in Million.
11. Are there any specific market keywords associated with the report?
Yes, the market keyword associated with the report is "Mobile Commerce Market," which aids in identifying and referencing the specific market segment covered.
12. How do I determine which pricing option suits my needs best?
The pricing options vary based on user requirements and access needs. Individual users may opt for single-user licenses, while businesses requiring broader access may choose multi-user or enterprise licenses for cost-effective access to the report.
13. Are there any additional resources or data provided in the Mobile Commerce Market report?
While the report offers comprehensive insights, it's advisable to review the specific contents or supplementary materials provided to ascertain if additional resources or data are available.
14. How can I stay updated on further developments or reports in the Mobile Commerce Market?
To stay informed about further developments, trends, and reports in the Mobile Commerce Market, consider subscribing to industry newsletters, following relevant companies and organizations, or regularly checking reputable industry news sources and publications.
Methodology
Step 1 - Identification of Relevant Samples Size from Population Database


Step 2 - Approaches for Defining Global Market Size (Value, Volume* & Price*)

Note*: In applicable scenarios
Step 3 - Data Sources
Primary Research
- Web Analytics
- Survey Reports
- Research Institute
- Latest Research Reports
- Opinion Leaders
Secondary Research
- Annual Reports
- White Paper
- Latest Press Release
- Industry Association
- Paid Database
- Investor Presentations

Step 4 - Data Triangulation
Involves using different sources of information in order to increase the validity of a study
These sources are likely to be stakeholders in a program - participants, other researchers, program staff, other community members, and so on.
Then we put all data in single framework & apply various statistical tools to find out the dynamic on the market.
During the analysis stage, feedback from the stakeholder groups would be compared to determine areas of agreement as well as areas of divergence