
Key Insights
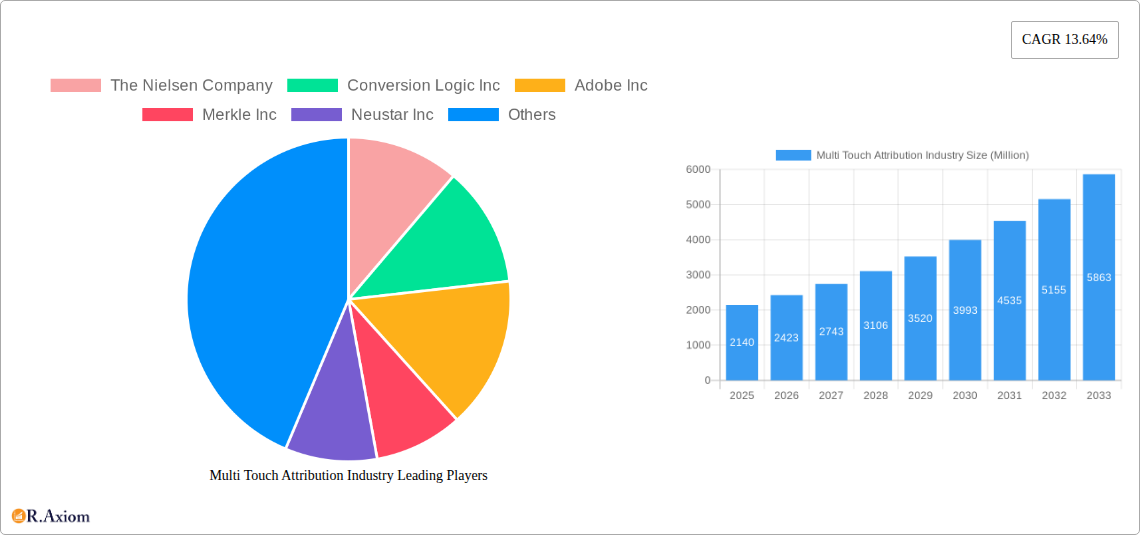
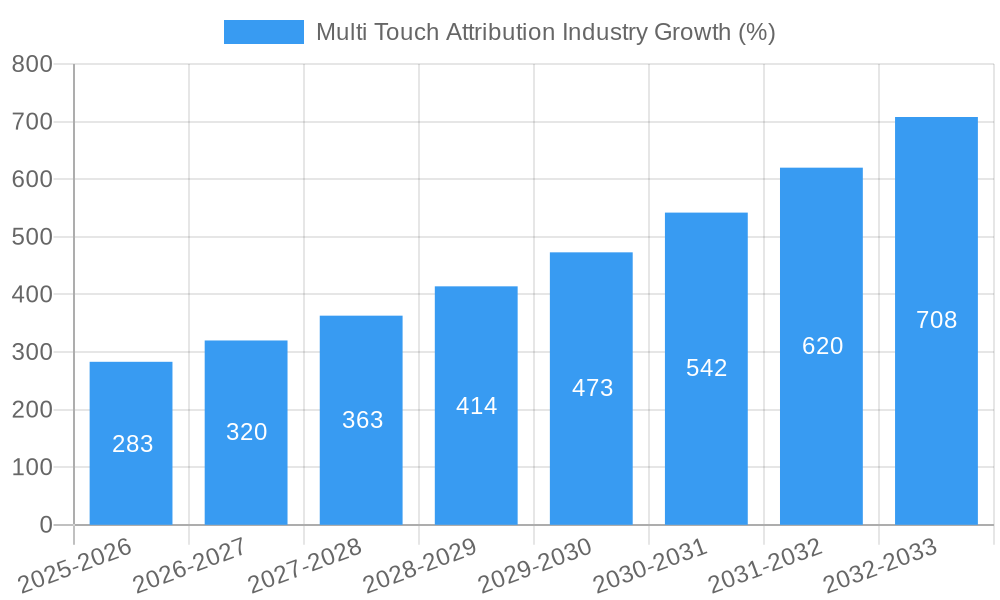
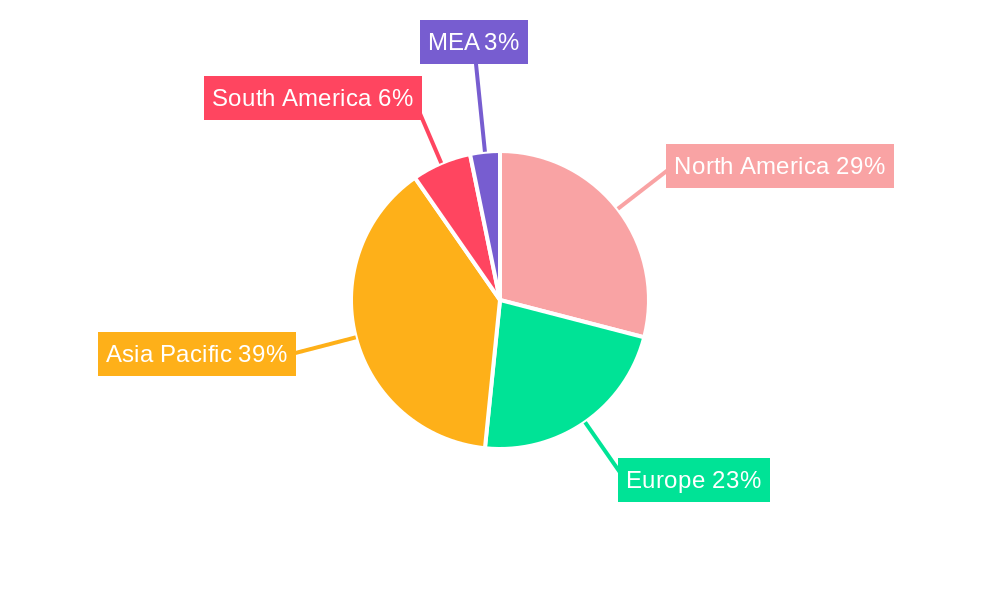
The Multi-Touch Attribution (MTA) market is experiencing robust growth, projected to reach \$2.14 billion in 2025 and expanding at a Compound Annual Growth Rate (CAGR) of 13.64% from 2025 to 2033. This expansion is driven by several key factors. The increasing complexity of customer journeys across numerous digital touchpoints necessitates sophisticated attribution models to accurately measure marketing ROI. Businesses, particularly those in Retail & E-commerce, BFSI (Banking, Financial Services, and Insurance), and IT & Telecom, are increasingly adopting MTA solutions to optimize their marketing spend and improve campaign effectiveness. The rise of sophisticated marketing technologies, including machine learning and AI-powered analytics, further fuels this growth by enabling more precise attribution and insightful data analysis. Furthermore, the growing need for transparency and accountability in marketing investments is pushing companies towards adopting MTA solutions that provide a clear picture of which channels and campaigns contribute most effectively to conversions. The competitive landscape is characterized by a mix of established players like Nielsen and Adobe, alongside emerging technology companies specializing in data-driven attribution. Regional growth is expected to be strong across North America, Europe, and Asia-Pacific, with developing economies in Asia-Pacific exhibiting particularly high potential for future expansion.
The restraints on MTA market growth are primarily centered around data privacy concerns and the complexity of implementation. Maintaining data privacy while effectively tracking customer journeys requires careful navigation of regulatory landscapes like GDPR and CCPA. The technical complexity of implementing and managing MTA solutions can also pose a barrier to entry for smaller businesses. However, the benefits of improved marketing ROI and optimized campaign performance are significant enough to drive adoption even amidst these challenges. The future of the MTA market is likely to see continued innovation in the area of cross-device tracking and cookieless attribution, driven by increasing demand for more privacy-centric solutions. Furthermore, the integration of MTA with other marketing technologies, such as CRM and CDP systems, will be crucial for maximizing the value of MTA data and achieving a holistic view of customer interactions.
Multi Touch Attribution (MTA) Industry: A Comprehensive Market Report (2019-2033)
This in-depth report provides a comprehensive analysis of the Multi Touch Attribution (MTA) industry, covering market size, growth drivers, key players, and future trends from 2019 to 2033. The study incorporates detailed segmentation by end-user industry, offering actionable insights for stakeholders across the value chain. With a base year of 2025 and an estimated year of 2025, this report projects market growth until 2033, offering valuable forecasting data for informed strategic decision-making.
Multi Touch Attribution Industry Market Concentration & Innovation
The Multi Touch Attribution (MTA) industry exhibits a moderately concentrated market structure, with a few dominant players capturing a significant portion of the market share. The Nielsen Company, Adobe Inc, and Merkle Inc, for instance, hold a combined xx% market share in 2025, primarily due to their established brand reputation, extensive product portfolios, and global reach. However, the market also features several agile players like AppsFlyer and LeadsRx Inc, who are actively innovating and expanding their market presence. This dynamic landscape fosters competition, driving innovation in MTA solutions.
Several factors fuel innovation within the industry: the ever-evolving digital marketing landscape, increasing demand for precise marketing measurement, the rise of advanced analytics techniques (like machine learning and AI), and a growing need for cross-channel attribution capabilities. Regulatory frameworks, while not heavily restrictive, are evolving to address data privacy concerns, influencing the development of privacy-compliant MTA solutions. Product substitutes, such as simpler last-click attribution models, still exist, but the limitations in accuracy are pushing marketers toward more sophisticated MTA approaches. Furthermore, M&A activities are significant, with deal values reaching $xx Million annually, reflecting the industry's consolidation trend and the pursuit of enhanced capabilities and market share. Examples include [Insert Specific M&A examples if available, otherwise replace with "various smaller acquisitions by key players to expand product offerings and geographic reach"].
Multi Touch Attribution Industry Industry Trends & Insights
The Multi Touch Attribution (MTA) industry is experiencing robust growth, driven by factors such as increasing digital advertising spend, the growing complexity of marketing campaigns across multiple channels, and the rising need for accurate ROI measurement. The market is predicted to witness a CAGR of xx% during the forecast period (2025-2033), reaching a market size of $xx Million by 2033. Market penetration for MTA solutions across various industries continues to increase, driven by a shift toward data-driven decision-making. Technological disruptions, particularly the rise of AI and machine learning, are transforming MTA capabilities, enabling more accurate and insightful attribution modeling. Consumer preferences for personalized experiences also fuel demand, as MTA allows for more targeted and effective marketing strategies. Competitive dynamics are shaping the landscape, with leading companies focusing on innovation, strategic partnerships, and expanding their product portfolios to maintain a competitive edge.
Dominant Markets & Segments in Multi Touch Attribution Industry
The Retail & E-commerce segment currently dominates the Multi Touch Attribution (MTA) market, accounting for the largest market share in 2025 due to its high digital advertising spend and the increasing focus on optimizing online customer journeys. Other segments, such as BFSI (Banking, Financial Services, and Insurance), IT & Telecom, and Consumer Electronics, are also showing significant growth, driven by similar trends towards digital marketing and ROI maximization.
- Key Drivers for Retail & E-commerce dominance:
- High digital advertising expenditure.
- Intense competition leading to the need for precise measurement and optimization.
- Focus on customer journey mapping and personalization.
- Abundant data availability for sophisticated MTA modeling.
The Travel & Tourism sector demonstrates substantial growth potential. The BFSI segment shows slower growth, influenced by regulatory compliance requirements. Other end-user industries (Healthcare & Life Sciences, Media & Entertainment) show moderate growth driven by increasing marketing budgets and improved data analytics capabilities.
Multi Touch Attribution Industry Product Developments
Recent product developments in the MTA industry are largely focused on improving the accuracy and sophistication of attribution models. This includes leveraging advanced analytics techniques like machine learning and AI to handle increasingly complex data sets and provide more precise insights into customer journeys. Companies are also developing more user-friendly interfaces to make MTA solutions accessible to a wider range of marketers. A key competitive advantage lies in the ability to offer seamless integration with existing marketing technology stacks, providing a comprehensive and unified view of campaign performance across all channels.
Report Scope & Segmentation Analysis
This report segments the Multi Touch Attribution (MTA) market based on end-user industry: Retail & E-commerce, BFSI, IT & Telecom, Consumer Electronics, Travel & Tourism, and Other End-user Industries (Healthcare & Life Sciences, Media & Entertainment). Each segment is analyzed based on market size, growth rate, competitive landscape, and key drivers. Retail & E-commerce is projected to maintain its leading position, followed by BFSI and IT & Telecom. Other segments are expected to exhibit varying growth rates depending on industry-specific factors and adoption of digital marketing strategies. The competitive landscape within each segment varies, with some characterized by intense competition and others by a more fragmented structure.
Key Drivers of Multi Touch Attribution Industry Growth
Several key factors drive the growth of the Multi Touch Attribution (MTA) industry: the rising adoption of digital marketing strategies across various sectors, the increasing need for precise measurement and optimization of marketing ROI, the growing complexity of marketing campaigns across multiple channels, and advancements in data analytics technologies, particularly machine learning and AI which enable more sophisticated attribution modeling. Furthermore, stringent regulatory frameworks emphasizing data privacy are also driving innovation in privacy-compliant MTA solutions, propelling market growth.
Challenges in the Multi Touch Attribution Industry Sector
The Multi Touch Attribution (MTA) industry faces challenges, including the high cost of implementing and maintaining sophisticated MTA solutions, the complexity of integrating various data sources, and the need to address data privacy concerns. Competition is intense, requiring vendors to continuously innovate and offer superior products. The accuracy of attribution models can be affected by data limitations and the complexity of customer journeys. Supply chain disruptions can impact the availability of necessary technologies and expertise.
Emerging Opportunities in Multi Touch Attribution Industry
Emerging opportunities exist in the integration of MTA with other marketing technologies, such as Customer Relationship Management (CRM) systems and marketing automation platforms. The expanding use of AI and machine learning is creating new possibilities for enhanced accuracy and real-time insights. Growth in emerging markets with increasing digitalization represents significant untapped potential. Developing robust privacy-compliant MTA solutions will be vital for future success in a data-conscious environment.
Leading Players in the Multi Touch Attribution Industry Market
- The Nielsen Company
- Conversion Logic Inc
- Adobe Inc
- Merkle Inc
- Neustar Inc
- Engagio Inc
- Ipsos Group SA
- Equifax Inc
- AppsFlyer
- LeadsRx Inc
- LeanData Inc
- Manthan
Key Developments in Multi Touch Attribution Industry Industry
- May 2022: Clinch and Neustar collaborated to integrate Neustar's Marketing Attribution solution into Clinch's UI, offering marketers enhanced real-time campaign performance insights.
- March 2022: Quotient launched its impression-based multi-touch media measurement methodology, expanding its Quotient Analytics platform to encompass various media channels.
Strategic Outlook for Multi Touch Attribution Industry Market
The Multi Touch Attribution (MTA) industry is poised for significant growth, driven by ongoing digital transformation across sectors and the growing demand for data-driven marketing decisions. Future market potential lies in the continued development and adoption of AI-powered attribution models, seamless integration with broader marketing technology stacks, and expansion into new, emerging markets. Companies that can successfully navigate the challenges of data privacy and offer robust, user-friendly solutions will be best positioned to capitalize on the numerous opportunities within this dynamic industry.
Multi Touch Attribution Industry Segmentation
-
1. End-user Industry
- 1.1. Retail & E-commerce
- 1.2. BFSI
- 1.3. IT & Telecom
- 1.4. Consumer Electronics
- 1.5. Travel & Tourism
- 1.6. Other En
Multi Touch Attribution Industry Segmentation By Geography
- 1. North America
- 2. Europe
- 3. Asia Pacific
- 4. Latin America
- 5. Middle East and Africa
Multi Touch Attribution Industry REPORT HIGHLIGHTS
| Aspects | Details |
|---|---|
| Study Period | 2019-2033 |
| Base Year | 2024 |
| Estimated Year | 2025 |
| Forecast Period | 2025-2033 |
| Historical Period | 2019-2024 |
| Growth Rate | CAGR of 13.64% from 2019-2033 |
| Segmentation |
|
Table of Contents
- 1. Introduction
- 1.1. Research Scope
- 1.2. Market Segmentation
- 1.3. Research Methodology
- 1.4. Definitions and Assumptions
- 2. Executive Summary
- 2.1. Introduction
- 3. Market Dynamics
- 3.1. Introduction
- 3.2. Market Drivers
- 3.2.1 Increasing Focus of Marketers on Maximizing the ROI; Growing Number of Marketing Channels and Need for Optimization of Marketing Expenditure; Adoption of Technology and Solutions such as AI
- 3.2.2 Big Data
- 3.2.3 and Cloud Computing in Marketing
- 3.3. Market Restrains
- 3.3.1 Skepticism About Shifting from Existing Marketing Practices
- 3.3.2 Training and Change Management
- 3.4. Market Trends
- 3.4.1. Retail & E-commerce Industry Expected to Show Maximum Growth
- 4. Market Factor Analysis
- 4.1. Porters Five Forces
- 4.2. Supply/Value Chain
- 4.3. PESTEL analysis
- 4.4. Market Entropy
- 4.5. Patent/Trademark Analysis
- 5. Global Multi Touch Attribution Industry Analysis, Insights and Forecast, 2019-2031
- 5.1. Market Analysis, Insights and Forecast - by End-user Industry
- 5.1.1. Retail & E-commerce
- 5.1.2. BFSI
- 5.1.3. IT & Telecom
- 5.1.4. Consumer Electronics
- 5.1.5. Travel & Tourism
- 5.1.6. Other En
- 5.2. Market Analysis, Insights and Forecast - by Region
- 5.2.1. North America
- 5.2.2. Europe
- 5.2.3. Asia Pacific
- 5.2.4. Latin America
- 5.2.5. Middle East and Africa
- 5.1. Market Analysis, Insights and Forecast - by End-user Industry
- 6. North America Multi Touch Attribution Industry Analysis, Insights and Forecast, 2019-2031
- 6.1. Market Analysis, Insights and Forecast - by End-user Industry
- 6.1.1. Retail & E-commerce
- 6.1.2. BFSI
- 6.1.3. IT & Telecom
- 6.1.4. Consumer Electronics
- 6.1.5. Travel & Tourism
- 6.1.6. Other En
- 6.1. Market Analysis, Insights and Forecast - by End-user Industry
- 7. Europe Multi Touch Attribution Industry Analysis, Insights and Forecast, 2019-2031
- 7.1. Market Analysis, Insights and Forecast - by End-user Industry
- 7.1.1. Retail & E-commerce
- 7.1.2. BFSI
- 7.1.3. IT & Telecom
- 7.1.4. Consumer Electronics
- 7.1.5. Travel & Tourism
- 7.1.6. Other En
- 7.1. Market Analysis, Insights and Forecast - by End-user Industry
- 8. Asia Pacific Multi Touch Attribution Industry Analysis, Insights and Forecast, 2019-2031
- 8.1. Market Analysis, Insights and Forecast - by End-user Industry
- 8.1.1. Retail & E-commerce
- 8.1.2. BFSI
- 8.1.3. IT & Telecom
- 8.1.4. Consumer Electronics
- 8.1.5. Travel & Tourism
- 8.1.6. Other En
- 8.1. Market Analysis, Insights and Forecast - by End-user Industry
- 9. Latin America Multi Touch Attribution Industry Analysis, Insights and Forecast, 2019-2031
- 9.1. Market Analysis, Insights and Forecast - by End-user Industry
- 9.1.1. Retail & E-commerce
- 9.1.2. BFSI
- 9.1.3. IT & Telecom
- 9.1.4. Consumer Electronics
- 9.1.5. Travel & Tourism
- 9.1.6. Other En
- 9.1. Market Analysis, Insights and Forecast - by End-user Industry
- 10. Middle East and Africa Multi Touch Attribution Industry Analysis, Insights and Forecast, 2019-2031
- 10.1. Market Analysis, Insights and Forecast - by End-user Industry
- 10.1.1. Retail & E-commerce
- 10.1.2. BFSI
- 10.1.3. IT & Telecom
- 10.1.4. Consumer Electronics
- 10.1.5. Travel & Tourism
- 10.1.6. Other En
- 10.1. Market Analysis, Insights and Forecast - by End-user Industry
- 11. North America Multi Touch Attribution Industry Analysis, Insights and Forecast, 2019-2031
- 11.1. Market Analysis, Insights and Forecast - By Country/Sub-region
- 11.1.1 United States
- 11.1.2 Canada
- 11.1.3 Mexico
- 12. Europe Multi Touch Attribution Industry Analysis, Insights and Forecast, 2019-2031
- 12.1. Market Analysis, Insights and Forecast - By Country/Sub-region
- 12.1.1 Germany
- 12.1.2 United Kingdom
- 12.1.3 France
- 12.1.4 Spain
- 12.1.5 Italy
- 12.1.6 Spain
- 12.1.7 Belgium
- 12.1.8 Netherland
- 12.1.9 Nordics
- 12.1.10 Rest of Europe
- 13. Asia Pacific Multi Touch Attribution Industry Analysis, Insights and Forecast, 2019-2031
- 13.1. Market Analysis, Insights and Forecast - By Country/Sub-region
- 13.1.1 China
- 13.1.2 Japan
- 13.1.3 India
- 13.1.4 South Korea
- 13.1.5 Southeast Asia
- 13.1.6 Australia
- 13.1.7 Indonesia
- 13.1.8 Phillipes
- 13.1.9 Singapore
- 13.1.10 Thailandc
- 13.1.11 Rest of Asia Pacific
- 14. South America Multi Touch Attribution Industry Analysis, Insights and Forecast, 2019-2031
- 14.1. Market Analysis, Insights and Forecast - By Country/Sub-region
- 14.1.1 Brazil
- 14.1.2 Argentina
- 14.1.3 Peru
- 14.1.4 Chile
- 14.1.5 Colombia
- 14.1.6 Ecuador
- 14.1.7 Venezuela
- 14.1.8 Rest of South America
- 15. North America Multi Touch Attribution Industry Analysis, Insights and Forecast, 2019-2031
- 15.1. Market Analysis, Insights and Forecast - By Country/Sub-region
- 15.1.1 United States
- 15.1.2 Canada
- 15.1.3 Mexico
- 16. MEA Multi Touch Attribution Industry Analysis, Insights and Forecast, 2019-2031
- 16.1. Market Analysis, Insights and Forecast - By Country/Sub-region
- 16.1.1 United Arab Emirates
- 16.1.2 Saudi Arabia
- 16.1.3 South Africa
- 16.1.4 Rest of Middle East and Africa
- 17. Competitive Analysis
- 17.1. Global Market Share Analysis 2024
- 17.2. Company Profiles
- 17.2.1 The Nielsen Company
- 17.2.1.1. Overview
- 17.2.1.2. Products
- 17.2.1.3. SWOT Analysis
- 17.2.1.4. Recent Developments
- 17.2.1.5. Financials (Based on Availability)
- 17.2.2 Conversion Logic Inc
- 17.2.2.1. Overview
- 17.2.2.2. Products
- 17.2.2.3. SWOT Analysis
- 17.2.2.4. Recent Developments
- 17.2.2.5. Financials (Based on Availability)
- 17.2.3 Adobe Inc
- 17.2.3.1. Overview
- 17.2.3.2. Products
- 17.2.3.3. SWOT Analysis
- 17.2.3.4. Recent Developments
- 17.2.3.5. Financials (Based on Availability)
- 17.2.4 Merkle Inc
- 17.2.4.1. Overview
- 17.2.4.2. Products
- 17.2.4.3. SWOT Analysis
- 17.2.4.4. Recent Developments
- 17.2.4.5. Financials (Based on Availability)
- 17.2.5 Neustar Inc
- 17.2.5.1. Overview
- 17.2.5.2. Products
- 17.2.5.3. SWOT Analysis
- 17.2.5.4. Recent Developments
- 17.2.5.5. Financials (Based on Availability)
- 17.2.6 Engagio Inc
- 17.2.6.1. Overview
- 17.2.6.2. Products
- 17.2.6.3. SWOT Analysis
- 17.2.6.4. Recent Developments
- 17.2.6.5. Financials (Based on Availability)
- 17.2.7 Ipsos Group SA
- 17.2.7.1. Overview
- 17.2.7.2. Products
- 17.2.7.3. SWOT Analysis
- 17.2.7.4. Recent Developments
- 17.2.7.5. Financials (Based on Availability)
- 17.2.8 Equifax Inc
- 17.2.8.1. Overview
- 17.2.8.2. Products
- 17.2.8.3. SWOT Analysis
- 17.2.8.4. Recent Developments
- 17.2.8.5. Financials (Based on Availability)
- 17.2.9 AppsFlyer
- 17.2.9.1. Overview
- 17.2.9.2. Products
- 17.2.9.3. SWOT Analysis
- 17.2.9.4. Recent Developments
- 17.2.9.5. Financials (Based on Availability)
- 17.2.10 LeadsRx Inc
- 17.2.10.1. Overview
- 17.2.10.2. Products
- 17.2.10.3. SWOT Analysis
- 17.2.10.4. Recent Developments
- 17.2.10.5. Financials (Based on Availability)
- 17.2.11 LeanData Inc
- 17.2.11.1. Overview
- 17.2.11.2. Products
- 17.2.11.3. SWOT Analysis
- 17.2.11.4. Recent Developments
- 17.2.11.5. Financials (Based on Availability)
- 17.2.12 Manthan
- 17.2.12.1. Overview
- 17.2.12.2. Products
- 17.2.12.3. SWOT Analysis
- 17.2.12.4. Recent Developments
- 17.2.12.5. Financials (Based on Availability)
- 17.2.1 The Nielsen Company
List of Figures
- Figure 1: Global Multi Touch Attribution Industry Revenue Breakdown (Million, %) by Region 2024 & 2032
- Figure 2: Global Multi Touch Attribution Industry Volume Breakdown (K Unit, %) by Region 2024 & 2032
- Figure 3: North America Multi Touch Attribution Industry Revenue (Million), by Country 2024 & 2032
- Figure 4: North America Multi Touch Attribution Industry Volume (K Unit), by Country 2024 & 2032
- Figure 5: North America Multi Touch Attribution Industry Revenue Share (%), by Country 2024 & 2032
- Figure 6: North America Multi Touch Attribution Industry Volume Share (%), by Country 2024 & 2032
- Figure 7: Europe Multi Touch Attribution Industry Revenue (Million), by Country 2024 & 2032
- Figure 8: Europe Multi Touch Attribution Industry Volume (K Unit), by Country 2024 & 2032
- Figure 9: Europe Multi Touch Attribution Industry Revenue Share (%), by Country 2024 & 2032
- Figure 10: Europe Multi Touch Attribution Industry Volume Share (%), by Country 2024 & 2032
- Figure 11: Asia Pacific Multi Touch Attribution Industry Revenue (Million), by Country 2024 & 2032
- Figure 12: Asia Pacific Multi Touch Attribution Industry Volume (K Unit), by Country 2024 & 2032
- Figure 13: Asia Pacific Multi Touch Attribution Industry Revenue Share (%), by Country 2024 & 2032
- Figure 14: Asia Pacific Multi Touch Attribution Industry Volume Share (%), by Country 2024 & 2032
- Figure 15: South America Multi Touch Attribution Industry Revenue (Million), by Country 2024 & 2032
- Figure 16: South America Multi Touch Attribution Industry Volume (K Unit), by Country 2024 & 2032
- Figure 17: South America Multi Touch Attribution Industry Revenue Share (%), by Country 2024 & 2032
- Figure 18: South America Multi Touch Attribution Industry Volume Share (%), by Country 2024 & 2032
- Figure 19: North America Multi Touch Attribution Industry Revenue (Million), by Country 2024 & 2032
- Figure 20: North America Multi Touch Attribution Industry Volume (K Unit), by Country 2024 & 2032
- Figure 21: North America Multi Touch Attribution Industry Revenue Share (%), by Country 2024 & 2032
- Figure 22: North America Multi Touch Attribution Industry Volume Share (%), by Country 2024 & 2032
- Figure 23: MEA Multi Touch Attribution Industry Revenue (Million), by Country 2024 & 2032
- Figure 24: MEA Multi Touch Attribution Industry Volume (K Unit), by Country 2024 & 2032
- Figure 25: MEA Multi Touch Attribution Industry Revenue Share (%), by Country 2024 & 2032
- Figure 26: MEA Multi Touch Attribution Industry Volume Share (%), by Country 2024 & 2032
- Figure 27: North America Multi Touch Attribution Industry Revenue (Million), by End-user Industry 2024 & 2032
- Figure 28: North America Multi Touch Attribution Industry Volume (K Unit), by End-user Industry 2024 & 2032
- Figure 29: North America Multi Touch Attribution Industry Revenue Share (%), by End-user Industry 2024 & 2032
- Figure 30: North America Multi Touch Attribution Industry Volume Share (%), by End-user Industry 2024 & 2032
- Figure 31: North America Multi Touch Attribution Industry Revenue (Million), by Country 2024 & 2032
- Figure 32: North America Multi Touch Attribution Industry Volume (K Unit), by Country 2024 & 2032
- Figure 33: North America Multi Touch Attribution Industry Revenue Share (%), by Country 2024 & 2032
- Figure 34: North America Multi Touch Attribution Industry Volume Share (%), by Country 2024 & 2032
- Figure 35: Europe Multi Touch Attribution Industry Revenue (Million), by End-user Industry 2024 & 2032
- Figure 36: Europe Multi Touch Attribution Industry Volume (K Unit), by End-user Industry 2024 & 2032
- Figure 37: Europe Multi Touch Attribution Industry Revenue Share (%), by End-user Industry 2024 & 2032
- Figure 38: Europe Multi Touch Attribution Industry Volume Share (%), by End-user Industry 2024 & 2032
- Figure 39: Europe Multi Touch Attribution Industry Revenue (Million), by Country 2024 & 2032
- Figure 40: Europe Multi Touch Attribution Industry Volume (K Unit), by Country 2024 & 2032
- Figure 41: Europe Multi Touch Attribution Industry Revenue Share (%), by Country 2024 & 2032
- Figure 42: Europe Multi Touch Attribution Industry Volume Share (%), by Country 2024 & 2032
- Figure 43: Asia Pacific Multi Touch Attribution Industry Revenue (Million), by End-user Industry 2024 & 2032
- Figure 44: Asia Pacific Multi Touch Attribution Industry Volume (K Unit), by End-user Industry 2024 & 2032
- Figure 45: Asia Pacific Multi Touch Attribution Industry Revenue Share (%), by End-user Industry 2024 & 2032
- Figure 46: Asia Pacific Multi Touch Attribution Industry Volume Share (%), by End-user Industry 2024 & 2032
- Figure 47: Asia Pacific Multi Touch Attribution Industry Revenue (Million), by Country 2024 & 2032
- Figure 48: Asia Pacific Multi Touch Attribution Industry Volume (K Unit), by Country 2024 & 2032
- Figure 49: Asia Pacific Multi Touch Attribution Industry Revenue Share (%), by Country 2024 & 2032
- Figure 50: Asia Pacific Multi Touch Attribution Industry Volume Share (%), by Country 2024 & 2032
- Figure 51: Latin America Multi Touch Attribution Industry Revenue (Million), by End-user Industry 2024 & 2032
- Figure 52: Latin America Multi Touch Attribution Industry Volume (K Unit), by End-user Industry 2024 & 2032
- Figure 53: Latin America Multi Touch Attribution Industry Revenue Share (%), by End-user Industry 2024 & 2032
- Figure 54: Latin America Multi Touch Attribution Industry Volume Share (%), by End-user Industry 2024 & 2032
- Figure 55: Latin America Multi Touch Attribution Industry Revenue (Million), by Country 2024 & 2032
- Figure 56: Latin America Multi Touch Attribution Industry Volume (K Unit), by Country 2024 & 2032
- Figure 57: Latin America Multi Touch Attribution Industry Revenue Share (%), by Country 2024 & 2032
- Figure 58: Latin America Multi Touch Attribution Industry Volume Share (%), by Country 2024 & 2032
- Figure 59: Middle East and Africa Multi Touch Attribution Industry Revenue (Million), by End-user Industry 2024 & 2032
- Figure 60: Middle East and Africa Multi Touch Attribution Industry Volume (K Unit), by End-user Industry 2024 & 2032
- Figure 61: Middle East and Africa Multi Touch Attribution Industry Revenue Share (%), by End-user Industry 2024 & 2032
- Figure 62: Middle East and Africa Multi Touch Attribution Industry Volume Share (%), by End-user Industry 2024 & 2032
- Figure 63: Middle East and Africa Multi Touch Attribution Industry Revenue (Million), by Country 2024 & 2032
- Figure 64: Middle East and Africa Multi Touch Attribution Industry Volume (K Unit), by Country 2024 & 2032
- Figure 65: Middle East and Africa Multi Touch Attribution Industry Revenue Share (%), by Country 2024 & 2032
- Figure 66: Middle East and Africa Multi Touch Attribution Industry Volume Share (%), by Country 2024 & 2032
List of Tables
- Table 1: Global Multi Touch Attribution Industry Revenue Million Forecast, by Region 2019 & 2032
- Table 2: Global Multi Touch Attribution Industry Volume K Unit Forecast, by Region 2019 & 2032
- Table 3: Global Multi Touch Attribution Industry Revenue Million Forecast, by End-user Industry 2019 & 2032
- Table 4: Global Multi Touch Attribution Industry Volume K Unit Forecast, by End-user Industry 2019 & 2032
- Table 5: Global Multi Touch Attribution Industry Revenue Million Forecast, by Region 2019 & 2032
- Table 6: Global Multi Touch Attribution Industry Volume K Unit Forecast, by Region 2019 & 2032
- Table 7: Global Multi Touch Attribution Industry Revenue Million Forecast, by Country 2019 & 2032
- Table 8: Global Multi Touch Attribution Industry Volume K Unit Forecast, by Country 2019 & 2032
- Table 9: United States Multi Touch Attribution Industry Revenue (Million) Forecast, by Application 2019 & 2032
- Table 10: United States Multi Touch Attribution Industry Volume (K Unit) Forecast, by Application 2019 & 2032
- Table 11: Canada Multi Touch Attribution Industry Revenue (Million) Forecast, by Application 2019 & 2032
- Table 12: Canada Multi Touch Attribution Industry Volume (K Unit) Forecast, by Application 2019 & 2032
- Table 13: Mexico Multi Touch Attribution Industry Revenue (Million) Forecast, by Application 2019 & 2032
- Table 14: Mexico Multi Touch Attribution Industry Volume (K Unit) Forecast, by Application 2019 & 2032
- Table 15: Global Multi Touch Attribution Industry Revenue Million Forecast, by Country 2019 & 2032
- Table 16: Global Multi Touch Attribution Industry Volume K Unit Forecast, by Country 2019 & 2032
- Table 17: Germany Multi Touch Attribution Industry Revenue (Million) Forecast, by Application 2019 & 2032
- Table 18: Germany Multi Touch Attribution Industry Volume (K Unit) Forecast, by Application 2019 & 2032
- Table 19: United Kingdom Multi Touch Attribution Industry Revenue (Million) Forecast, by Application 2019 & 2032
- Table 20: United Kingdom Multi Touch Attribution Industry Volume (K Unit) Forecast, by Application 2019 & 2032
- Table 21: France Multi Touch Attribution Industry Revenue (Million) Forecast, by Application 2019 & 2032
- Table 22: France Multi Touch Attribution Industry Volume (K Unit) Forecast, by Application 2019 & 2032
- Table 23: Spain Multi Touch Attribution Industry Revenue (Million) Forecast, by Application 2019 & 2032
- Table 24: Spain Multi Touch Attribution Industry Volume (K Unit) Forecast, by Application 2019 & 2032
- Table 25: Italy Multi Touch Attribution Industry Revenue (Million) Forecast, by Application 2019 & 2032
- Table 26: Italy Multi Touch Attribution Industry Volume (K Unit) Forecast, by Application 2019 & 2032
- Table 27: Spain Multi Touch Attribution Industry Revenue (Million) Forecast, by Application 2019 & 2032
- Table 28: Spain Multi Touch Attribution Industry Volume (K Unit) Forecast, by Application 2019 & 2032
- Table 29: Belgium Multi Touch Attribution Industry Revenue (Million) Forecast, by Application 2019 & 2032
- Table 30: Belgium Multi Touch Attribution Industry Volume (K Unit) Forecast, by Application 2019 & 2032
- Table 31: Netherland Multi Touch Attribution Industry Revenue (Million) Forecast, by Application 2019 & 2032
- Table 32: Netherland Multi Touch Attribution Industry Volume (K Unit) Forecast, by Application 2019 & 2032
- Table 33: Nordics Multi Touch Attribution Industry Revenue (Million) Forecast, by Application 2019 & 2032
- Table 34: Nordics Multi Touch Attribution Industry Volume (K Unit) Forecast, by Application 2019 & 2032
- Table 35: Rest of Europe Multi Touch Attribution Industry Revenue (Million) Forecast, by Application 2019 & 2032
- Table 36: Rest of Europe Multi Touch Attribution Industry Volume (K Unit) Forecast, by Application 2019 & 2032
- Table 37: Global Multi Touch Attribution Industry Revenue Million Forecast, by Country 2019 & 2032
- Table 38: Global Multi Touch Attribution Industry Volume K Unit Forecast, by Country 2019 & 2032
- Table 39: China Multi Touch Attribution Industry Revenue (Million) Forecast, by Application 2019 & 2032
- Table 40: China Multi Touch Attribution Industry Volume (K Unit) Forecast, by Application 2019 & 2032
- Table 41: Japan Multi Touch Attribution Industry Revenue (Million) Forecast, by Application 2019 & 2032
- Table 42: Japan Multi Touch Attribution Industry Volume (K Unit) Forecast, by Application 2019 & 2032
- Table 43: India Multi Touch Attribution Industry Revenue (Million) Forecast, by Application 2019 & 2032
- Table 44: India Multi Touch Attribution Industry Volume (K Unit) Forecast, by Application 2019 & 2032
- Table 45: South Korea Multi Touch Attribution Industry Revenue (Million) Forecast, by Application 2019 & 2032
- Table 46: South Korea Multi Touch Attribution Industry Volume (K Unit) Forecast, by Application 2019 & 2032
- Table 47: Southeast Asia Multi Touch Attribution Industry Revenue (Million) Forecast, by Application 2019 & 2032
- Table 48: Southeast Asia Multi Touch Attribution Industry Volume (K Unit) Forecast, by Application 2019 & 2032
- Table 49: Australia Multi Touch Attribution Industry Revenue (Million) Forecast, by Application 2019 & 2032
- Table 50: Australia Multi Touch Attribution Industry Volume (K Unit) Forecast, by Application 2019 & 2032
- Table 51: Indonesia Multi Touch Attribution Industry Revenue (Million) Forecast, by Application 2019 & 2032
- Table 52: Indonesia Multi Touch Attribution Industry Volume (K Unit) Forecast, by Application 2019 & 2032
- Table 53: Phillipes Multi Touch Attribution Industry Revenue (Million) Forecast, by Application 2019 & 2032
- Table 54: Phillipes Multi Touch Attribution Industry Volume (K Unit) Forecast, by Application 2019 & 2032
- Table 55: Singapore Multi Touch Attribution Industry Revenue (Million) Forecast, by Application 2019 & 2032
- Table 56: Singapore Multi Touch Attribution Industry Volume (K Unit) Forecast, by Application 2019 & 2032
- Table 57: Thailandc Multi Touch Attribution Industry Revenue (Million) Forecast, by Application 2019 & 2032
- Table 58: Thailandc Multi Touch Attribution Industry Volume (K Unit) Forecast, by Application 2019 & 2032
- Table 59: Rest of Asia Pacific Multi Touch Attribution Industry Revenue (Million) Forecast, by Application 2019 & 2032
- Table 60: Rest of Asia Pacific Multi Touch Attribution Industry Volume (K Unit) Forecast, by Application 2019 & 2032
- Table 61: Global Multi Touch Attribution Industry Revenue Million Forecast, by Country 2019 & 2032
- Table 62: Global Multi Touch Attribution Industry Volume K Unit Forecast, by Country 2019 & 2032
- Table 63: Brazil Multi Touch Attribution Industry Revenue (Million) Forecast, by Application 2019 & 2032
- Table 64: Brazil Multi Touch Attribution Industry Volume (K Unit) Forecast, by Application 2019 & 2032
- Table 65: Argentina Multi Touch Attribution Industry Revenue (Million) Forecast, by Application 2019 & 2032
- Table 66: Argentina Multi Touch Attribution Industry Volume (K Unit) Forecast, by Application 2019 & 2032
- Table 67: Peru Multi Touch Attribution Industry Revenue (Million) Forecast, by Application 2019 & 2032
- Table 68: Peru Multi Touch Attribution Industry Volume (K Unit) Forecast, by Application 2019 & 2032
- Table 69: Chile Multi Touch Attribution Industry Revenue (Million) Forecast, by Application 2019 & 2032
- Table 70: Chile Multi Touch Attribution Industry Volume (K Unit) Forecast, by Application 2019 & 2032
- Table 71: Colombia Multi Touch Attribution Industry Revenue (Million) Forecast, by Application 2019 & 2032
- Table 72: Colombia Multi Touch Attribution Industry Volume (K Unit) Forecast, by Application 2019 & 2032
- Table 73: Ecuador Multi Touch Attribution Industry Revenue (Million) Forecast, by Application 2019 & 2032
- Table 74: Ecuador Multi Touch Attribution Industry Volume (K Unit) Forecast, by Application 2019 & 2032
- Table 75: Venezuela Multi Touch Attribution Industry Revenue (Million) Forecast, by Application 2019 & 2032
- Table 76: Venezuela Multi Touch Attribution Industry Volume (K Unit) Forecast, by Application 2019 & 2032
- Table 77: Rest of South America Multi Touch Attribution Industry Revenue (Million) Forecast, by Application 2019 & 2032
- Table 78: Rest of South America Multi Touch Attribution Industry Volume (K Unit) Forecast, by Application 2019 & 2032
- Table 79: Global Multi Touch Attribution Industry Revenue Million Forecast, by Country 2019 & 2032
- Table 80: Global Multi Touch Attribution Industry Volume K Unit Forecast, by Country 2019 & 2032
- Table 81: United States Multi Touch Attribution Industry Revenue (Million) Forecast, by Application 2019 & 2032
- Table 82: United States Multi Touch Attribution Industry Volume (K Unit) Forecast, by Application 2019 & 2032
- Table 83: Canada Multi Touch Attribution Industry Revenue (Million) Forecast, by Application 2019 & 2032
- Table 84: Canada Multi Touch Attribution Industry Volume (K Unit) Forecast, by Application 2019 & 2032
- Table 85: Mexico Multi Touch Attribution Industry Revenue (Million) Forecast, by Application 2019 & 2032
- Table 86: Mexico Multi Touch Attribution Industry Volume (K Unit) Forecast, by Application 2019 & 2032
- Table 87: Global Multi Touch Attribution Industry Revenue Million Forecast, by Country 2019 & 2032
- Table 88: Global Multi Touch Attribution Industry Volume K Unit Forecast, by Country 2019 & 2032
- Table 89: United Arab Emirates Multi Touch Attribution Industry Revenue (Million) Forecast, by Application 2019 & 2032
- Table 90: United Arab Emirates Multi Touch Attribution Industry Volume (K Unit) Forecast, by Application 2019 & 2032
- Table 91: Saudi Arabia Multi Touch Attribution Industry Revenue (Million) Forecast, by Application 2019 & 2032
- Table 92: Saudi Arabia Multi Touch Attribution Industry Volume (K Unit) Forecast, by Application 2019 & 2032
- Table 93: South Africa Multi Touch Attribution Industry Revenue (Million) Forecast, by Application 2019 & 2032
- Table 94: South Africa Multi Touch Attribution Industry Volume (K Unit) Forecast, by Application 2019 & 2032
- Table 95: Rest of Middle East and Africa Multi Touch Attribution Industry Revenue (Million) Forecast, by Application 2019 & 2032
- Table 96: Rest of Middle East and Africa Multi Touch Attribution Industry Volume (K Unit) Forecast, by Application 2019 & 2032
- Table 97: Global Multi Touch Attribution Industry Revenue Million Forecast, by End-user Industry 2019 & 2032
- Table 98: Global Multi Touch Attribution Industry Volume K Unit Forecast, by End-user Industry 2019 & 2032
- Table 99: Global Multi Touch Attribution Industry Revenue Million Forecast, by Country 2019 & 2032
- Table 100: Global Multi Touch Attribution Industry Volume K Unit Forecast, by Country 2019 & 2032
- Table 101: Global Multi Touch Attribution Industry Revenue Million Forecast, by End-user Industry 2019 & 2032
- Table 102: Global Multi Touch Attribution Industry Volume K Unit Forecast, by End-user Industry 2019 & 2032
- Table 103: Global Multi Touch Attribution Industry Revenue Million Forecast, by Country 2019 & 2032
- Table 104: Global Multi Touch Attribution Industry Volume K Unit Forecast, by Country 2019 & 2032
- Table 105: Global Multi Touch Attribution Industry Revenue Million Forecast, by End-user Industry 2019 & 2032
- Table 106: Global Multi Touch Attribution Industry Volume K Unit Forecast, by End-user Industry 2019 & 2032
- Table 107: Global Multi Touch Attribution Industry Revenue Million Forecast, by Country 2019 & 2032
- Table 108: Global Multi Touch Attribution Industry Volume K Unit Forecast, by Country 2019 & 2032
- Table 109: Global Multi Touch Attribution Industry Revenue Million Forecast, by End-user Industry 2019 & 2032
- Table 110: Global Multi Touch Attribution Industry Volume K Unit Forecast, by End-user Industry 2019 & 2032
- Table 111: Global Multi Touch Attribution Industry Revenue Million Forecast, by Country 2019 & 2032
- Table 112: Global Multi Touch Attribution Industry Volume K Unit Forecast, by Country 2019 & 2032
- Table 113: Global Multi Touch Attribution Industry Revenue Million Forecast, by End-user Industry 2019 & 2032
- Table 114: Global Multi Touch Attribution Industry Volume K Unit Forecast, by End-user Industry 2019 & 2032
- Table 115: Global Multi Touch Attribution Industry Revenue Million Forecast, by Country 2019 & 2032
- Table 116: Global Multi Touch Attribution Industry Volume K Unit Forecast, by Country 2019 & 2032
Frequently Asked Questions
1. What is the projected Compound Annual Growth Rate (CAGR) of the Multi Touch Attribution Industry?
The projected CAGR is approximately 13.64%.
2. Which companies are prominent players in the Multi Touch Attribution Industry?
Key companies in the market include The Nielsen Company, Conversion Logic Inc, Adobe Inc, Merkle Inc, Neustar Inc, Engagio Inc, Ipsos Group SA, Equifax Inc, AppsFlyer, LeadsRx Inc, LeanData Inc, Manthan.
3. What are the main segments of the Multi Touch Attribution Industry?
The market segments include End-user Industry.
4. Can you provide details about the market size?
The market size is estimated to be USD 2.14 Million as of 2022.
5. What are some drivers contributing to market growth?
Increasing Focus of Marketers on Maximizing the ROI; Growing Number of Marketing Channels and Need for Optimization of Marketing Expenditure; Adoption of Technology and Solutions such as AI. Big Data. and Cloud Computing in Marketing.
6. What are the notable trends driving market growth?
Retail & E-commerce Industry Expected to Show Maximum Growth.
7. Are there any restraints impacting market growth?
Skepticism About Shifting from Existing Marketing Practices. Training and Change Management.
8. Can you provide examples of recent developments in the market?
May 2022: Clinch and Neustar collaborated to give marketers a more comprehensive picture of attribution throughout their full campaign footprint. Neustar's Marketing Attribution solution can now be engaged within the Clinch UI, providing advertisers with extensive real-time insights into the channels, tactics, creatives, and other aspects of campaign performance.
9. What pricing options are available for accessing the report?
Pricing options include single-user, multi-user, and enterprise licenses priced at USD 4750, USD 5250, and USD 8750 respectively.
10. Is the market size provided in terms of value or volume?
The market size is provided in terms of value, measured in Million and volume, measured in K Unit.
11. Are there any specific market keywords associated with the report?
Yes, the market keyword associated with the report is "Multi Touch Attribution Industry," which aids in identifying and referencing the specific market segment covered.
12. How do I determine which pricing option suits my needs best?
The pricing options vary based on user requirements and access needs. Individual users may opt for single-user licenses, while businesses requiring broader access may choose multi-user or enterprise licenses for cost-effective access to the report.
13. Are there any additional resources or data provided in the Multi Touch Attribution Industry report?
While the report offers comprehensive insights, it's advisable to review the specific contents or supplementary materials provided to ascertain if additional resources or data are available.
14. How can I stay updated on further developments or reports in the Multi Touch Attribution Industry?
To stay informed about further developments, trends, and reports in the Multi Touch Attribution Industry, consider subscribing to industry newsletters, following relevant companies and organizations, or regularly checking reputable industry news sources and publications.
Methodology
Step 1 - Identification of Relevant Samples Size from Population Database


Step 2 - Approaches for Defining Global Market Size (Value, Volume* & Price*)

Note*: In applicable scenarios
Step 3 - Data Sources
Primary Research
- Web Analytics
- Survey Reports
- Research Institute
- Latest Research Reports
- Opinion Leaders
Secondary Research
- Annual Reports
- White Paper
- Latest Press Release
- Industry Association
- Paid Database
- Investor Presentations

Step 4 - Data Triangulation
Involves using different sources of information in order to increase the validity of a study
These sources are likely to be stakeholders in a program - participants, other researchers, program staff, other community members, and so on.
Then we put all data in single framework & apply various statistical tools to find out the dynamic on the market.
During the analysis stage, feedback from the stakeholder groups would be compared to determine areas of agreement as well as areas of divergence


