
Key Insights
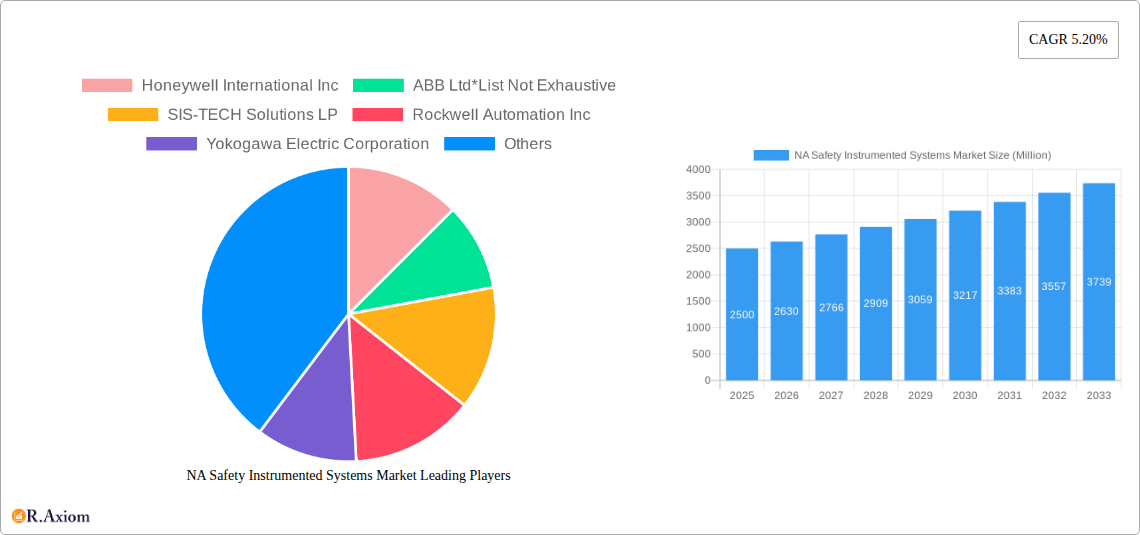
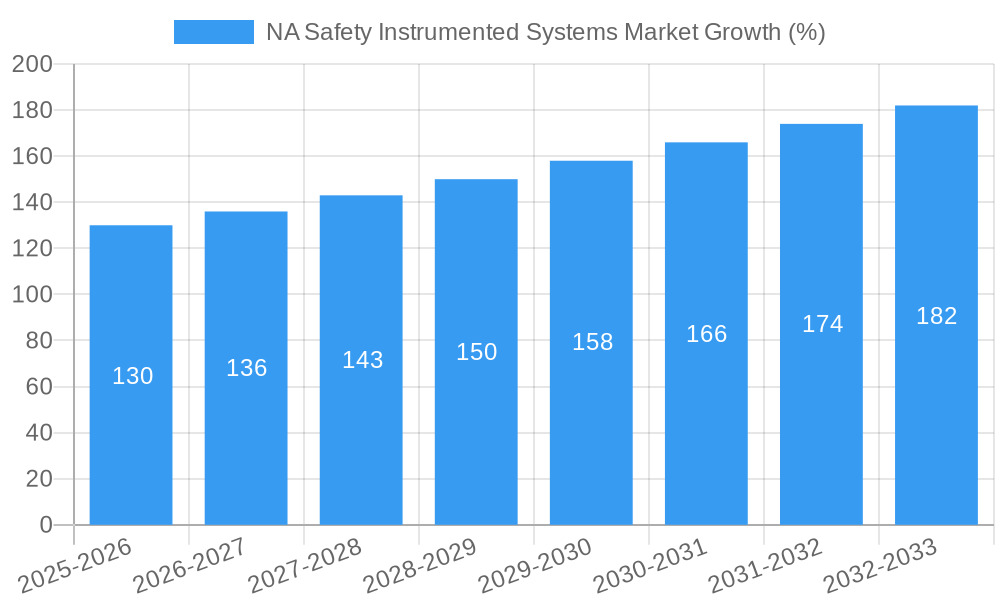
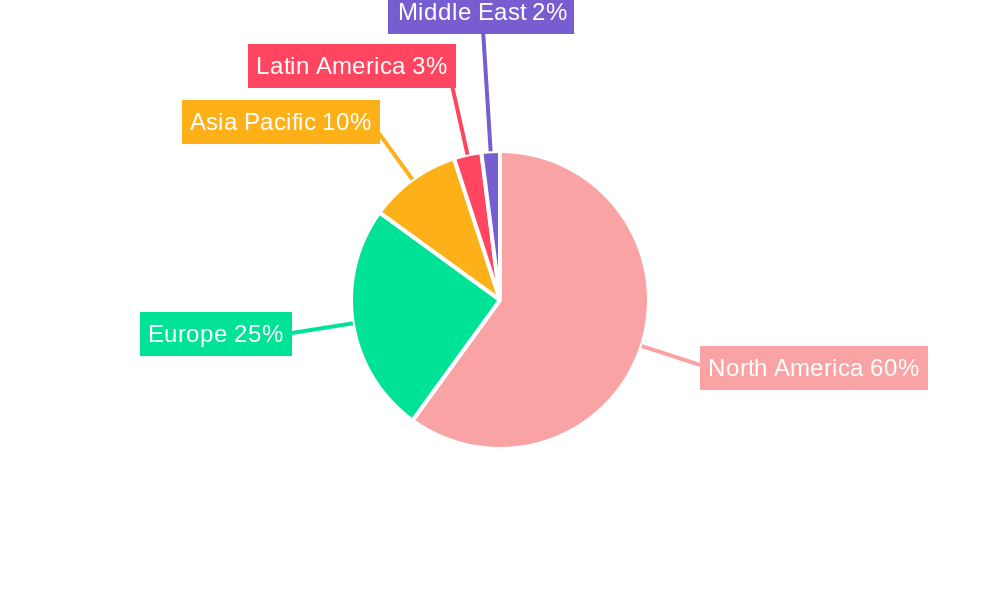
The North American Safety Instrumented Systems (SIS) market, valued at approximately $2.5 billion in 2025, is projected to experience robust growth, driven by increasing investments in safety and process automation across various industries. The market's Compound Annual Growth Rate (CAGR) of 5.20% from 2025 to 2033 indicates a steady expansion, fueled by stringent safety regulations, particularly within the oil and gas, chemical, and pharmaceutical sectors. Growing demand for enhanced process safety and reliability, coupled with the rising adoption of advanced technologies like AI and machine learning for predictive maintenance, are key drivers. The significant segment contributions from applications such as Emergency Shutdown Systems (ESD), Fire & Gas Monitoring and Control (F&GC), and High Integrity Pressure Protection Systems (HIPPS) underscore the critical role of SIS in preventing catastrophic incidents and ensuring operational efficiency. North America's well-established industrial base and robust regulatory framework further contribute to market expansion. Major players like Honeywell, ABB, Rockwell Automation, and Emerson Electric are shaping the market landscape through technological innovation and strategic partnerships. The market's growth, however, might face some constraints related to high initial investment costs for SIS implementation and the need for skilled personnel for operation and maintenance.
The significant growth in the North American SIS market is expected to continue throughout the forecast period (2025-2033). This growth is further segmented by end-user industry, with the oil and gas sector (including upstream, midstream, and downstream) representing a substantial portion of the market share due to its inherently hazardous operations. The chemical and petrochemical industries also contribute significantly, reflecting the inherent risks in their production processes. The power generation and pharmaceutical sectors are also important contributors, demonstrating the broad applicability of SIS across various high-risk industries. Geographic variations within North America will likely exist, with regions possessing larger concentrations of these key industries exhibiting higher market growth. Future market dynamics will be shaped by evolving safety standards, technological advancements in SIS technologies, and the ongoing drive towards improved industrial safety and efficiency.
North American Safety Instrumented Systems (SIS) Market: A Comprehensive Report (2019-2033)
This comprehensive report provides an in-depth analysis of the North American Safety Instrumented Systems (SIS) market, covering the period from 2019 to 2033. It offers valuable insights into market dynamics, growth drivers, challenges, and emerging opportunities, enabling stakeholders to make informed strategic decisions. The report meticulously segments the market by application, end-user, and geography (United States and Canada), providing granular data and forecasts. Key players like Honeywell International Inc, ABB Ltd, SIS-TECH Solutions LP, Rockwell Automation Inc, Yokogawa Electric Corporation, Schlumberger Limited, INTECH Process Automation, and Emerson Electric Company are analyzed, revealing market share, competitive landscapes, and strategic moves.
NA Safety Instrumented Systems Market Market Concentration & Innovation
The North American SIS market exhibits a moderately concentrated landscape, with a few major players holding significant market share. However, the presence of several smaller, specialized companies indicates a dynamic competitive environment. Innovation is driven by increasing demand for enhanced safety, stricter regulatory compliance, and the adoption of advanced technologies like artificial intelligence (AI) and machine learning (ML) for predictive maintenance and improved system efficiency. Market share data for the top players in 2024 is as follows: Honeywell (xx%), ABB (xx%), Emerson (xx%), Rockwell Automation (xx%), with remaining xx% divided among other players. The regulatory framework, particularly in industries like oil and gas and chemicals, plays a crucial role in shaping market dynamics, mandating the implementation of robust SIS. Significant M&A activity is observed, with deal values in the past five years totaling approximately xx Million USD, driving consolidation and technological advancements. These acquisitions often focus on enhancing technological capabilities and expanding market reach. End-user trends indicate a growing preference for integrated SIS solutions offering better interoperability and reduced operational complexity. Product substitutes, primarily simpler safety systems, are limited due to the stringent safety requirements in many applications.
NA Safety Instrumented Systems Market Industry Trends & Insights
The North American SIS market is experiencing robust growth, with a CAGR of xx% projected from 2025 to 2033. This growth is fueled by several key factors: increasing industrial automation, stringent safety regulations across various sectors, rising demand for enhanced process safety, and the adoption of advanced technologies. Technological disruptions, such as the integration of AI and IoT, are transforming SIS, leading to more intelligent, predictive, and efficient systems. Consumer preferences are shifting towards integrated, modular, and scalable SIS solutions that offer improved flexibility and adaptability. Competitive dynamics are marked by intense innovation and strategic partnerships, with companies investing heavily in R&D to develop cutting-edge technologies and expand their product portfolios. The market penetration of advanced SIS features, such as predictive diagnostics and remote monitoring, is expected to increase significantly over the forecast period, driving further growth. The current market size in 2025 is estimated at xx Million USD.
Dominant Markets & Segments in NA Safety Instrumented Systems Market
The United States represents the largest segment within the North American SIS market, driven by its robust industrial base and stringent safety regulations. Within the application segment, Emergency Shutdown Systems (ESD) holds the largest share, owing to its critical role in preventing major industrial accidents.
- Key Drivers for the US Market: Strong industrial base, stringent safety regulations, significant investments in process automation, and technological advancements.
- Key Drivers for the Canadian Market: Growth in the oil and gas sector, increasing investments in infrastructure projects, and expanding manufacturing base.
The oil and gas sector dominates the end-user segment, with a breakdown of approximately xx% upstream, xx% midstream, and xx% downstream. This sector's reliance on complex and hazardous processes makes SIS implementation crucial. The chemicals and petrochemicals sector also shows significant growth, owing to increasing production capacity and rising safety concerns.
NA Safety Instrumented Systems Market Product Developments
Recent product developments in the North American SIS market are characterized by a strong focus on integration, enhanced functionality, and advanced analytics. Manufacturers are incorporating AI, ML, and IoT capabilities to enhance system efficiency, reduce downtime, and improve predictive maintenance. The emphasis is on developing modular and scalable systems that can easily adapt to changing operational needs and integrate with existing plant infrastructure. These developments offer significant competitive advantages by delivering improved safety, reliability, and operational efficiency to end-users.
Report Scope & Segmentation Analysis
This report segments the North American SIS market by:
Application: Emergency Shutdown Systems (ESD), Fire and Gas Monitoring and Control (F&GC), High Integrity Pressure Protection Systems (HIPPS), Burner Management Systems (BMS), Turbo Machinery Control, Other Applications. Each segment exhibits varying growth rates driven by specific industry requirements and technological advancements. Market size for each segment in 2025 is estimated as follows: ESD (xx Million USD), F&GC (xx Million USD), HIPPS (xx Million USD), BMS (xx Million USD), Turbo Machinery Control (xx Million USD), Others (xx Million USD).
End-User: Chemicals and Petrochemicals, Power Generation, Pharmaceutical, Food and Beverage, Oil and Gas (Upstream, Midstream, Downstream), Other End Users. Each end-user segment shows distinct growth potential based on their specific safety needs and investment capacities.
Geography: United States and Canada. The US market is expected to maintain its dominant position due to its large industrial base.
Key Drivers of NA Safety Instrumented Systems Market Growth
Several factors drive the growth of the North American SIS market. Stringent safety regulations across various industries necessitate the implementation of advanced SIS. Increasing industrial automation and the adoption of complex processes heighten the need for robust safety measures. Technological advancements, such as AI-powered predictive maintenance and remote monitoring, enhance system efficiency and reliability. Finally, rising investments in infrastructure development and expanding industrial capacities fuel demand for SIS solutions.
Challenges in the NA Safety Instrumented Systems Market Sector
The North American SIS market faces challenges including the high initial investment costs associated with SIS implementation, which can be a barrier for smaller companies. Supply chain disruptions and the increasing complexity of SIS systems can impact project timelines and costs. Furthermore, intense competition among manufacturers necessitates continuous innovation and adaptation to maintain market share. These factors contribute to a dynamic and challenging market environment.
Emerging Opportunities in NA Safety Instrumented Systems Market
Emerging opportunities exist in the integration of SIS with other industrial automation systems, leading to more efficient and streamlined operations. The increasing adoption of cloud-based solutions for remote monitoring and data analytics offers improved system management and insights. The development of specialized SIS solutions for emerging industries like renewable energy further presents significant growth potential.
Leading Players in the NA Safety Instrumented Systems Market Market
- Honeywell International Inc
- ABB Ltd
- SIS-TECH Solutions LP
- Rockwell Automation Inc
- Yokogawa Electric Corporation
- Schlumberger Limited
- INTECH Process Automation
- Emerson Electric Company
Key Developments in NA Safety Instrumented Systems Market Industry
- October 2022: Emerson launched Movicon.NExT 4.2 SCADA software, enhancing plant automation and operational excellence.
- January 2023: Emerson secured a contract for the Ras Laffan Petrochemical Complex in Qatar, providing integrated process control and safety systems.
Strategic Outlook for NA Safety Instrumented Systems Market Market
The North American SIS market is poised for sustained growth, driven by increasing industrial automation, stringent safety regulations, and technological advancements. Emerging opportunities in areas such as AI-powered predictive maintenance and cloud-based solutions will further accelerate market expansion. Companies focusing on innovation, integration, and customer-centric solutions are best positioned to capitalize on this growth potential. The market is expected to witness significant consolidation through mergers and acquisitions, driving further technological advancements and efficiency gains.
NA Safety Instrumented Systems Market Segmentation
-
1. Application
- 1.1. Emergency Shutdown Systems (ESD)
- 1.2. Fire and Gas Monitoring and Control (F&GC)
- 1.3. High Integrity Pressure Protection Systems (HIPPS)
- 1.4. Burner Management Systems (BMS)
- 1.5. Turbo Machinery Control
- 1.6. Other Applications
-
2. End User
- 2.1. Chemicals and Petrochemicals
- 2.2. Power Generation
- 2.3. Pharmaceutical
- 2.4. Food and Beverage
- 2.5. Oil and
- 2.6. Other End Users
NA Safety Instrumented Systems Market Segmentation By Geography
-
1. North America
- 1.1. United States
- 1.2. Canada
- 1.3. Mexico
-
2. South America
- 2.1. Brazil
- 2.2. Argentina
- 2.3. Rest of South America
-
3. Europe
- 3.1. United Kingdom
- 3.2. Germany
- 3.3. France
- 3.4. Italy
- 3.5. Spain
- 3.6. Russia
- 3.7. Benelux
- 3.8. Nordics
- 3.9. Rest of Europe
-
4. Middle East & Africa
- 4.1. Turkey
- 4.2. Israel
- 4.3. GCC
- 4.4. North Africa
- 4.5. South Africa
- 4.6. Rest of Middle East & Africa
-
5. Asia Pacific
- 5.1. China
- 5.2. India
- 5.3. Japan
- 5.4. South Korea
- 5.5. ASEAN
- 5.6. Oceania
- 5.7. Rest of Asia Pacific
NA Safety Instrumented Systems Market REPORT HIGHLIGHTS
| Aspects | Details |
|---|---|
| Study Period | 2019-2033 |
| Base Year | 2024 |
| Estimated Year | 2025 |
| Forecast Period | 2025-2033 |
| Historical Period | 2019-2024 |
| Growth Rate | CAGR of 5.20% from 2019-2033 |
| Segmentation |
|
Table of Contents
- 1. Introduction
- 1.1. Research Scope
- 1.2. Market Segmentation
- 1.3. Research Methodology
- 1.4. Definitions and Assumptions
- 2. Executive Summary
- 2.1. Introduction
- 3. Market Dynamics
- 3.1. Introduction
- 3.2. Market Drivers
- 3.2.1. Growing Regulatory Environment in the Industry; Presence of Robust SIS Service Ecosystem
- 3.3. Market Restrains
- 3.3.1. Operational Complexity and High Maintenance Costs
- 3.4. Market Trends
- 3.4.1. Chemical and Petrochemical Industry Expected to Hold Major Market Share
- 4. Market Factor Analysis
- 4.1. Porters Five Forces
- 4.2. Supply/Value Chain
- 4.3. PESTEL analysis
- 4.4. Market Entropy
- 4.5. Patent/Trademark Analysis
- 5. Global NA Safety Instrumented Systems Market Analysis, Insights and Forecast, 2019-2031
- 5.1. Market Analysis, Insights and Forecast - by Application
- 5.1.1. Emergency Shutdown Systems (ESD)
- 5.1.2. Fire and Gas Monitoring and Control (F&GC)
- 5.1.3. High Integrity Pressure Protection Systems (HIPPS)
- 5.1.4. Burner Management Systems (BMS)
- 5.1.5. Turbo Machinery Control
- 5.1.6. Other Applications
- 5.2. Market Analysis, Insights and Forecast - by End User
- 5.2.1. Chemicals and Petrochemicals
- 5.2.2. Power Generation
- 5.2.3. Pharmaceutical
- 5.2.4. Food and Beverage
- 5.2.5. Oil and
- 5.2.6. Other End Users
- 5.3. Market Analysis, Insights and Forecast - by Region
- 5.3.1. North America
- 5.3.2. South America
- 5.3.3. Europe
- 5.3.4. Middle East & Africa
- 5.3.5. Asia Pacific
- 5.1. Market Analysis, Insights and Forecast - by Application
- 6. North America NA Safety Instrumented Systems Market Analysis, Insights and Forecast, 2019-2031
- 6.1. Market Analysis, Insights and Forecast - by Application
- 6.1.1. Emergency Shutdown Systems (ESD)
- 6.1.2. Fire and Gas Monitoring and Control (F&GC)
- 6.1.3. High Integrity Pressure Protection Systems (HIPPS)
- 6.1.4. Burner Management Systems (BMS)
- 6.1.5. Turbo Machinery Control
- 6.1.6. Other Applications
- 6.2. Market Analysis, Insights and Forecast - by End User
- 6.2.1. Chemicals and Petrochemicals
- 6.2.2. Power Generation
- 6.2.3. Pharmaceutical
- 6.2.4. Food and Beverage
- 6.2.5. Oil and
- 6.2.6. Other End Users
- 6.1. Market Analysis, Insights and Forecast - by Application
- 7. South America NA Safety Instrumented Systems Market Analysis, Insights and Forecast, 2019-2031
- 7.1. Market Analysis, Insights and Forecast - by Application
- 7.1.1. Emergency Shutdown Systems (ESD)
- 7.1.2. Fire and Gas Monitoring and Control (F&GC)
- 7.1.3. High Integrity Pressure Protection Systems (HIPPS)
- 7.1.4. Burner Management Systems (BMS)
- 7.1.5. Turbo Machinery Control
- 7.1.6. Other Applications
- 7.2. Market Analysis, Insights and Forecast - by End User
- 7.2.1. Chemicals and Petrochemicals
- 7.2.2. Power Generation
- 7.2.3. Pharmaceutical
- 7.2.4. Food and Beverage
- 7.2.5. Oil and
- 7.2.6. Other End Users
- 7.1. Market Analysis, Insights and Forecast - by Application
- 8. Europe NA Safety Instrumented Systems Market Analysis, Insights and Forecast, 2019-2031
- 8.1. Market Analysis, Insights and Forecast - by Application
- 8.1.1. Emergency Shutdown Systems (ESD)
- 8.1.2. Fire and Gas Monitoring and Control (F&GC)
- 8.1.3. High Integrity Pressure Protection Systems (HIPPS)
- 8.1.4. Burner Management Systems (BMS)
- 8.1.5. Turbo Machinery Control
- 8.1.6. Other Applications
- 8.2. Market Analysis, Insights and Forecast - by End User
- 8.2.1. Chemicals and Petrochemicals
- 8.2.2. Power Generation
- 8.2.3. Pharmaceutical
- 8.2.4. Food and Beverage
- 8.2.5. Oil and
- 8.2.6. Other End Users
- 8.1. Market Analysis, Insights and Forecast - by Application
- 9. Middle East & Africa NA Safety Instrumented Systems Market Analysis, Insights and Forecast, 2019-2031
- 9.1. Market Analysis, Insights and Forecast - by Application
- 9.1.1. Emergency Shutdown Systems (ESD)
- 9.1.2. Fire and Gas Monitoring and Control (F&GC)
- 9.1.3. High Integrity Pressure Protection Systems (HIPPS)
- 9.1.4. Burner Management Systems (BMS)
- 9.1.5. Turbo Machinery Control
- 9.1.6. Other Applications
- 9.2. Market Analysis, Insights and Forecast - by End User
- 9.2.1. Chemicals and Petrochemicals
- 9.2.2. Power Generation
- 9.2.3. Pharmaceutical
- 9.2.4. Food and Beverage
- 9.2.5. Oil and
- 9.2.6. Other End Users
- 9.1. Market Analysis, Insights and Forecast - by Application
- 10. Asia Pacific NA Safety Instrumented Systems Market Analysis, Insights and Forecast, 2019-2031
- 10.1. Market Analysis, Insights and Forecast - by Application
- 10.1.1. Emergency Shutdown Systems (ESD)
- 10.1.2. Fire and Gas Monitoring and Control (F&GC)
- 10.1.3. High Integrity Pressure Protection Systems (HIPPS)
- 10.1.4. Burner Management Systems (BMS)
- 10.1.5. Turbo Machinery Control
- 10.1.6. Other Applications
- 10.2. Market Analysis, Insights and Forecast - by End User
- 10.2.1. Chemicals and Petrochemicals
- 10.2.2. Power Generation
- 10.2.3. Pharmaceutical
- 10.2.4. Food and Beverage
- 10.2.5. Oil and
- 10.2.6. Other End Users
- 10.1. Market Analysis, Insights and Forecast - by Application
- 11. North America NA Safety Instrumented Systems Market Analysis, Insights and Forecast, 2019-2031
- 11.1. Market Analysis, Insights and Forecast - By Country/Sub-region
- 11.1.1.
- 12. Europe NA Safety Instrumented Systems Market Analysis, Insights and Forecast, 2019-2031
- 12.1. Market Analysis, Insights and Forecast - By Country/Sub-region
- 12.1.1.
- 13. Asia Pacific NA Safety Instrumented Systems Market Analysis, Insights and Forecast, 2019-2031
- 13.1. Market Analysis, Insights and Forecast - By Country/Sub-region
- 13.1.1.
- 14. Latin America NA Safety Instrumented Systems Market Analysis, Insights and Forecast, 2019-2031
- 14.1. Market Analysis, Insights and Forecast - By Country/Sub-region
- 14.1.1.
- 15. Middle East NA Safety Instrumented Systems Market Analysis, Insights and Forecast, 2019-2031
- 15.1. Market Analysis, Insights and Forecast - By Country/Sub-region
- 15.1.1.
- 16. Competitive Analysis
- 16.1. Global Market Share Analysis 2024
- 16.2. Company Profiles
- 16.2.1 Honeywell International Inc
- 16.2.1.1. Overview
- 16.2.1.2. Products
- 16.2.1.3. SWOT Analysis
- 16.2.1.4. Recent Developments
- 16.2.1.5. Financials (Based on Availability)
- 16.2.2 ABB Ltd*List Not Exhaustive
- 16.2.2.1. Overview
- 16.2.2.2. Products
- 16.2.2.3. SWOT Analysis
- 16.2.2.4. Recent Developments
- 16.2.2.5. Financials (Based on Availability)
- 16.2.3 SIS-TECH Solutions LP
- 16.2.3.1. Overview
- 16.2.3.2. Products
- 16.2.3.3. SWOT Analysis
- 16.2.3.4. Recent Developments
- 16.2.3.5. Financials (Based on Availability)
- 16.2.4 Rockwell Automation Inc
- 16.2.4.1. Overview
- 16.2.4.2. Products
- 16.2.4.3. SWOT Analysis
- 16.2.4.4. Recent Developments
- 16.2.4.5. Financials (Based on Availability)
- 16.2.5 Yokogawa Electric Corporation
- 16.2.5.1. Overview
- 16.2.5.2. Products
- 16.2.5.3. SWOT Analysis
- 16.2.5.4. Recent Developments
- 16.2.5.5. Financials (Based on Availability)
- 16.2.6 Schlumberger Limited
- 16.2.6.1. Overview
- 16.2.6.2. Products
- 16.2.6.3. SWOT Analysis
- 16.2.6.4. Recent Developments
- 16.2.6.5. Financials (Based on Availability)
- 16.2.7 INTECH Process Automation
- 16.2.7.1. Overview
- 16.2.7.2. Products
- 16.2.7.3. SWOT Analysis
- 16.2.7.4. Recent Developments
- 16.2.7.5. Financials (Based on Availability)
- 16.2.8 Emerson Electric Company
- 16.2.8.1. Overview
- 16.2.8.2. Products
- 16.2.8.3. SWOT Analysis
- 16.2.8.4. Recent Developments
- 16.2.8.5. Financials (Based on Availability)
- 16.2.1 Honeywell International Inc
List of Figures
- Figure 1: Global NA Safety Instrumented Systems Market Revenue Breakdown (Million, %) by Region 2024 & 2032
- Figure 2: North America NA Safety Instrumented Systems Market Revenue (Million), by Country 2024 & 2032
- Figure 3: North America NA Safety Instrumented Systems Market Revenue Share (%), by Country 2024 & 2032
- Figure 4: Europe NA Safety Instrumented Systems Market Revenue (Million), by Country 2024 & 2032
- Figure 5: Europe NA Safety Instrumented Systems Market Revenue Share (%), by Country 2024 & 2032
- Figure 6: Asia Pacific NA Safety Instrumented Systems Market Revenue (Million), by Country 2024 & 2032
- Figure 7: Asia Pacific NA Safety Instrumented Systems Market Revenue Share (%), by Country 2024 & 2032
- Figure 8: Latin America NA Safety Instrumented Systems Market Revenue (Million), by Country 2024 & 2032
- Figure 9: Latin America NA Safety Instrumented Systems Market Revenue Share (%), by Country 2024 & 2032
- Figure 10: Middle East NA Safety Instrumented Systems Market Revenue (Million), by Country 2024 & 2032
- Figure 11: Middle East NA Safety Instrumented Systems Market Revenue Share (%), by Country 2024 & 2032
- Figure 12: North America NA Safety Instrumented Systems Market Revenue (Million), by Application 2024 & 2032
- Figure 13: North America NA Safety Instrumented Systems Market Revenue Share (%), by Application 2024 & 2032
- Figure 14: North America NA Safety Instrumented Systems Market Revenue (Million), by End User 2024 & 2032
- Figure 15: North America NA Safety Instrumented Systems Market Revenue Share (%), by End User 2024 & 2032
- Figure 16: North America NA Safety Instrumented Systems Market Revenue (Million), by Country 2024 & 2032
- Figure 17: North America NA Safety Instrumented Systems Market Revenue Share (%), by Country 2024 & 2032
- Figure 18: South America NA Safety Instrumented Systems Market Revenue (Million), by Application 2024 & 2032
- Figure 19: South America NA Safety Instrumented Systems Market Revenue Share (%), by Application 2024 & 2032
- Figure 20: South America NA Safety Instrumented Systems Market Revenue (Million), by End User 2024 & 2032
- Figure 21: South America NA Safety Instrumented Systems Market Revenue Share (%), by End User 2024 & 2032
- Figure 22: South America NA Safety Instrumented Systems Market Revenue (Million), by Country 2024 & 2032
- Figure 23: South America NA Safety Instrumented Systems Market Revenue Share (%), by Country 2024 & 2032
- Figure 24: Europe NA Safety Instrumented Systems Market Revenue (Million), by Application 2024 & 2032
- Figure 25: Europe NA Safety Instrumented Systems Market Revenue Share (%), by Application 2024 & 2032
- Figure 26: Europe NA Safety Instrumented Systems Market Revenue (Million), by End User 2024 & 2032
- Figure 27: Europe NA Safety Instrumented Systems Market Revenue Share (%), by End User 2024 & 2032
- Figure 28: Europe NA Safety Instrumented Systems Market Revenue (Million), by Country 2024 & 2032
- Figure 29: Europe NA Safety Instrumented Systems Market Revenue Share (%), by Country 2024 & 2032
- Figure 30: Middle East & Africa NA Safety Instrumented Systems Market Revenue (Million), by Application 2024 & 2032
- Figure 31: Middle East & Africa NA Safety Instrumented Systems Market Revenue Share (%), by Application 2024 & 2032
- Figure 32: Middle East & Africa NA Safety Instrumented Systems Market Revenue (Million), by End User 2024 & 2032
- Figure 33: Middle East & Africa NA Safety Instrumented Systems Market Revenue Share (%), by End User 2024 & 2032
- Figure 34: Middle East & Africa NA Safety Instrumented Systems Market Revenue (Million), by Country 2024 & 2032
- Figure 35: Middle East & Africa NA Safety Instrumented Systems Market Revenue Share (%), by Country 2024 & 2032
- Figure 36: Asia Pacific NA Safety Instrumented Systems Market Revenue (Million), by Application 2024 & 2032
- Figure 37: Asia Pacific NA Safety Instrumented Systems Market Revenue Share (%), by Application 2024 & 2032
- Figure 38: Asia Pacific NA Safety Instrumented Systems Market Revenue (Million), by End User 2024 & 2032
- Figure 39: Asia Pacific NA Safety Instrumented Systems Market Revenue Share (%), by End User 2024 & 2032
- Figure 40: Asia Pacific NA Safety Instrumented Systems Market Revenue (Million), by Country 2024 & 2032
- Figure 41: Asia Pacific NA Safety Instrumented Systems Market Revenue Share (%), by Country 2024 & 2032
List of Tables
- Table 1: Global NA Safety Instrumented Systems Market Revenue Million Forecast, by Region 2019 & 2032
- Table 2: Global NA Safety Instrumented Systems Market Revenue Million Forecast, by Application 2019 & 2032
- Table 3: Global NA Safety Instrumented Systems Market Revenue Million Forecast, by End User 2019 & 2032
- Table 4: Global NA Safety Instrumented Systems Market Revenue Million Forecast, by Region 2019 & 2032
- Table 5: Global NA Safety Instrumented Systems Market Revenue Million Forecast, by Country 2019 & 2032
- Table 6: NA Safety Instrumented Systems Market Revenue (Million) Forecast, by Application 2019 & 2032
- Table 7: Global NA Safety Instrumented Systems Market Revenue Million Forecast, by Country 2019 & 2032
- Table 8: NA Safety Instrumented Systems Market Revenue (Million) Forecast, by Application 2019 & 2032
- Table 9: Global NA Safety Instrumented Systems Market Revenue Million Forecast, by Country 2019 & 2032
- Table 10: NA Safety Instrumented Systems Market Revenue (Million) Forecast, by Application 2019 & 2032
- Table 11: Global NA Safety Instrumented Systems Market Revenue Million Forecast, by Country 2019 & 2032
- Table 12: NA Safety Instrumented Systems Market Revenue (Million) Forecast, by Application 2019 & 2032
- Table 13: Global NA Safety Instrumented Systems Market Revenue Million Forecast, by Country 2019 & 2032
- Table 14: NA Safety Instrumented Systems Market Revenue (Million) Forecast, by Application 2019 & 2032
- Table 15: Global NA Safety Instrumented Systems Market Revenue Million Forecast, by Application 2019 & 2032
- Table 16: Global NA Safety Instrumented Systems Market Revenue Million Forecast, by End User 2019 & 2032
- Table 17: Global NA Safety Instrumented Systems Market Revenue Million Forecast, by Country 2019 & 2032
- Table 18: United States NA Safety Instrumented Systems Market Revenue (Million) Forecast, by Application 2019 & 2032
- Table 19: Canada NA Safety Instrumented Systems Market Revenue (Million) Forecast, by Application 2019 & 2032
- Table 20: Mexico NA Safety Instrumented Systems Market Revenue (Million) Forecast, by Application 2019 & 2032
- Table 21: Global NA Safety Instrumented Systems Market Revenue Million Forecast, by Application 2019 & 2032
- Table 22: Global NA Safety Instrumented Systems Market Revenue Million Forecast, by End User 2019 & 2032
- Table 23: Global NA Safety Instrumented Systems Market Revenue Million Forecast, by Country 2019 & 2032
- Table 24: Brazil NA Safety Instrumented Systems Market Revenue (Million) Forecast, by Application 2019 & 2032
- Table 25: Argentina NA Safety Instrumented Systems Market Revenue (Million) Forecast, by Application 2019 & 2032
- Table 26: Rest of South America NA Safety Instrumented Systems Market Revenue (Million) Forecast, by Application 2019 & 2032
- Table 27: Global NA Safety Instrumented Systems Market Revenue Million Forecast, by Application 2019 & 2032
- Table 28: Global NA Safety Instrumented Systems Market Revenue Million Forecast, by End User 2019 & 2032
- Table 29: Global NA Safety Instrumented Systems Market Revenue Million Forecast, by Country 2019 & 2032
- Table 30: United Kingdom NA Safety Instrumented Systems Market Revenue (Million) Forecast, by Application 2019 & 2032
- Table 31: Germany NA Safety Instrumented Systems Market Revenue (Million) Forecast, by Application 2019 & 2032
- Table 32: France NA Safety Instrumented Systems Market Revenue (Million) Forecast, by Application 2019 & 2032
- Table 33: Italy NA Safety Instrumented Systems Market Revenue (Million) Forecast, by Application 2019 & 2032
- Table 34: Spain NA Safety Instrumented Systems Market Revenue (Million) Forecast, by Application 2019 & 2032
- Table 35: Russia NA Safety Instrumented Systems Market Revenue (Million) Forecast, by Application 2019 & 2032
- Table 36: Benelux NA Safety Instrumented Systems Market Revenue (Million) Forecast, by Application 2019 & 2032
- Table 37: Nordics NA Safety Instrumented Systems Market Revenue (Million) Forecast, by Application 2019 & 2032
- Table 38: Rest of Europe NA Safety Instrumented Systems Market Revenue (Million) Forecast, by Application 2019 & 2032
- Table 39: Global NA Safety Instrumented Systems Market Revenue Million Forecast, by Application 2019 & 2032
- Table 40: Global NA Safety Instrumented Systems Market Revenue Million Forecast, by End User 2019 & 2032
- Table 41: Global NA Safety Instrumented Systems Market Revenue Million Forecast, by Country 2019 & 2032
- Table 42: Turkey NA Safety Instrumented Systems Market Revenue (Million) Forecast, by Application 2019 & 2032
- Table 43: Israel NA Safety Instrumented Systems Market Revenue (Million) Forecast, by Application 2019 & 2032
- Table 44: GCC NA Safety Instrumented Systems Market Revenue (Million) Forecast, by Application 2019 & 2032
- Table 45: North Africa NA Safety Instrumented Systems Market Revenue (Million) Forecast, by Application 2019 & 2032
- Table 46: South Africa NA Safety Instrumented Systems Market Revenue (Million) Forecast, by Application 2019 & 2032
- Table 47: Rest of Middle East & Africa NA Safety Instrumented Systems Market Revenue (Million) Forecast, by Application 2019 & 2032
- Table 48: Global NA Safety Instrumented Systems Market Revenue Million Forecast, by Application 2019 & 2032
- Table 49: Global NA Safety Instrumented Systems Market Revenue Million Forecast, by End User 2019 & 2032
- Table 50: Global NA Safety Instrumented Systems Market Revenue Million Forecast, by Country 2019 & 2032
- Table 51: China NA Safety Instrumented Systems Market Revenue (Million) Forecast, by Application 2019 & 2032
- Table 52: India NA Safety Instrumented Systems Market Revenue (Million) Forecast, by Application 2019 & 2032
- Table 53: Japan NA Safety Instrumented Systems Market Revenue (Million) Forecast, by Application 2019 & 2032
- Table 54: South Korea NA Safety Instrumented Systems Market Revenue (Million) Forecast, by Application 2019 & 2032
- Table 55: ASEAN NA Safety Instrumented Systems Market Revenue (Million) Forecast, by Application 2019 & 2032
- Table 56: Oceania NA Safety Instrumented Systems Market Revenue (Million) Forecast, by Application 2019 & 2032
- Table 57: Rest of Asia Pacific NA Safety Instrumented Systems Market Revenue (Million) Forecast, by Application 2019 & 2032
Frequently Asked Questions
1. What is the projected Compound Annual Growth Rate (CAGR) of the NA Safety Instrumented Systems Market?
The projected CAGR is approximately 5.20%.
2. Which companies are prominent players in the NA Safety Instrumented Systems Market?
Key companies in the market include Honeywell International Inc, ABB Ltd*List Not Exhaustive, SIS-TECH Solutions LP, Rockwell Automation Inc, Yokogawa Electric Corporation, Schlumberger Limited, INTECH Process Automation, Emerson Electric Company.
3. What are the main segments of the NA Safety Instrumented Systems Market?
The market segments include Application, End User.
4. Can you provide details about the market size?
The market size is estimated to be USD XX Million as of 2022.
5. What are some drivers contributing to market growth?
Growing Regulatory Environment in the Industry; Presence of Robust SIS Service Ecosystem.
6. What are the notable trends driving market growth?
Chemical and Petrochemical Industry Expected to Hold Major Market Share.
7. Are there any restraints impacting market growth?
Operational Complexity and High Maintenance Costs.
8. Can you provide examples of recent developments in the market?
January 2023 - The Ras Laffan Petrochemical Complex in Qatar would include automation technology, software, and analytics from Emerson. The USD 6 billion integrated polymers project is presently under development and is anticipated to be completed in late 2026. It is a joint venture between QatarEnergy and Chevron Phillips Chemical. Through its DeltaV distributed control system and Rosemount gas analyzer solutions, Emerson will provide integrated process control and safety systems that use cutting-edge predictive technologies to lower operational complexity and decrease project risk.
9. What pricing options are available for accessing the report?
Pricing options include single-user, multi-user, and enterprise licenses priced at USD 4750, USD 4950, and USD 6800 respectively.
10. Is the market size provided in terms of value or volume?
The market size is provided in terms of value, measured in Million.
11. Are there any specific market keywords associated with the report?
Yes, the market keyword associated with the report is "NA Safety Instrumented Systems Market," which aids in identifying and referencing the specific market segment covered.
12. How do I determine which pricing option suits my needs best?
The pricing options vary based on user requirements and access needs. Individual users may opt for single-user licenses, while businesses requiring broader access may choose multi-user or enterprise licenses for cost-effective access to the report.
13. Are there any additional resources or data provided in the NA Safety Instrumented Systems Market report?
While the report offers comprehensive insights, it's advisable to review the specific contents or supplementary materials provided to ascertain if additional resources or data are available.
14. How can I stay updated on further developments or reports in the NA Safety Instrumented Systems Market?
To stay informed about further developments, trends, and reports in the NA Safety Instrumented Systems Market, consider subscribing to industry newsletters, following relevant companies and organizations, or regularly checking reputable industry news sources and publications.
Methodology
Step 1 - Identification of Relevant Samples Size from Population Database


Step 2 - Approaches for Defining Global Market Size (Value, Volume* & Price*)

Note*: In applicable scenarios
Step 3 - Data Sources
Primary Research
- Web Analytics
- Survey Reports
- Research Institute
- Latest Research Reports
- Opinion Leaders
Secondary Research
- Annual Reports
- White Paper
- Latest Press Release
- Industry Association
- Paid Database
- Investor Presentations

Step 4 - Data Triangulation
Involves using different sources of information in order to increase the validity of a study
These sources are likely to be stakeholders in a program - participants, other researchers, program staff, other community members, and so on.
Then we put all data in single framework & apply various statistical tools to find out the dynamic on the market.
During the analysis stage, feedback from the stakeholder groups would be compared to determine areas of agreement as well as areas of divergence


