
Key Insights
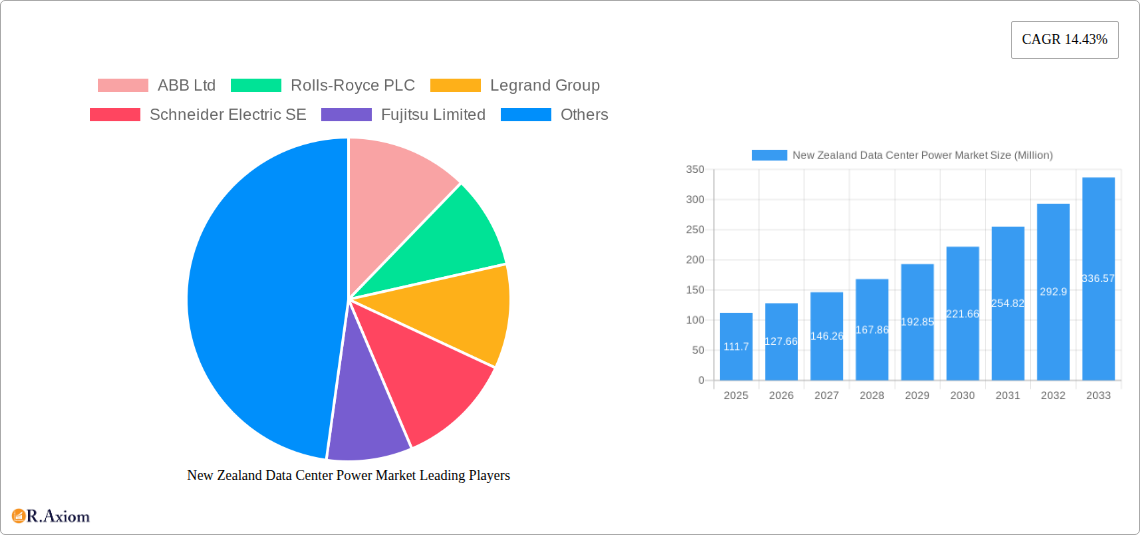
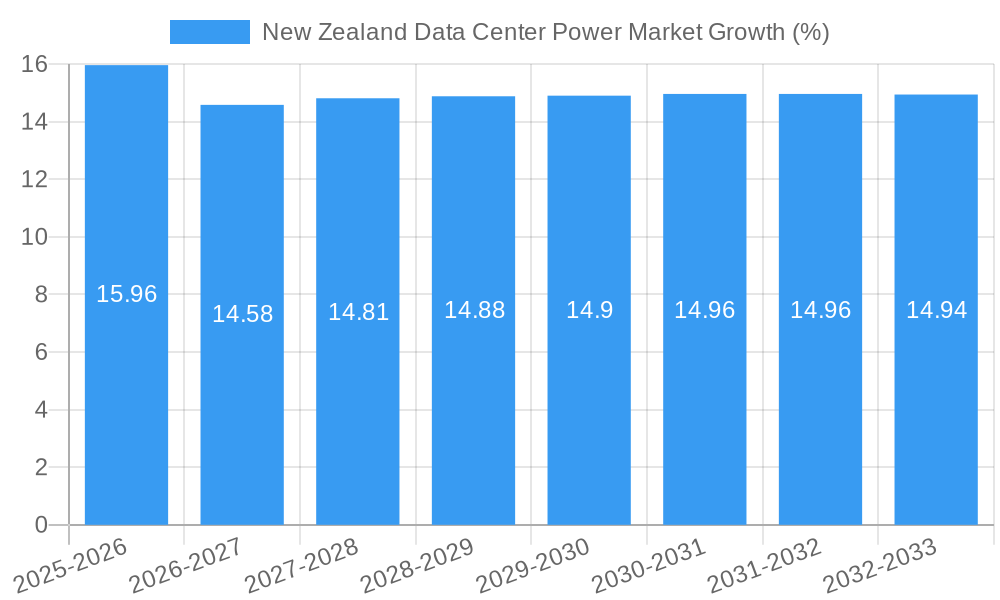
The New Zealand data center power market, valued at $111.70 million in 2025, is experiencing robust growth, projected to expand at a Compound Annual Growth Rate (CAGR) of 14.43% from 2025 to 2033. This expansion is driven by several key factors. The increasing adoption of cloud computing and digital transformation initiatives across various sectors, including IT and telecommunications, BFSI (Banking, Financial Services, and Insurance), and government, is fueling demand for reliable and efficient power solutions within data centers. Furthermore, the rising need for high-availability infrastructure to ensure business continuity and minimize downtime contributes significantly to market growth. Key segments driving this growth include power distribution solutions (PDUs, switchgear, critical power distribution, transfer switches, and remote power panels) and services. Leading players like ABB, Schneider Electric, and Vertiv are leveraging their expertise in power infrastructure solutions to cater to this growing market demand, offering a diverse range of products and services tailored to meet the unique requirements of New Zealand data centers.
Growth is expected to remain strong throughout the forecast period, fueled by continuous investments in advanced technologies and infrastructure upgrades within the data center sector. While potential restraints such as economic fluctuations and regulatory changes could impact growth, the long-term outlook for the New Zealand data center power market remains positive. The increasing focus on energy efficiency and sustainability within data centers is creating new opportunities for vendors offering eco-friendly power solutions. This trend, combined with the ongoing digitalization of New Zealand's economy, positions the market for sustained expansion in the coming years. The competitive landscape is characterized by both established multinational corporations and local players, highlighting a dynamic market with diverse offerings and services.
This comprehensive report provides an in-depth analysis of the New Zealand data center power market, offering crucial insights for stakeholders across the value chain. The study covers the period 2019-2033, with 2025 as the base and estimated year. It meticulously examines market dynamics, competitive landscapes, technological advancements, and growth opportunities, providing actionable intelligence for strategic decision-making.
New Zealand Data Center Power Market Market Concentration & Innovation
This section analyzes the market concentration, innovation drivers, regulatory landscape, and competitive dynamics within the New Zealand data center power market. The report assesses market share amongst key players, including ABB Ltd, Rolls-Royce PLC, Legrand Group, Schneider Electric SE, Fujitsu Limited, Caterpillar Inc, Rittal GmbH & Co KG, Cisco Systems Inc, Cummins Inc, Vertiv Group Corp, and Eaton Corporation (list not exhaustive). We evaluate the impact of mergers and acquisitions (M&A) activities, quantifying deal values where possible. For example, the xx Million merger between Company A and Company B in 2022 significantly altered market share. The report also examines the influence of regulatory frameworks, technological substitutes, and evolving end-user preferences, providing a 360-degree view of market concentration and innovation drivers. Specific metrics such as market share distribution and the total value of M&A deals within the forecast period are presented, alongside an analysis of the role of innovation in shaping market competition.
- Market Share Analysis: Detailed breakdown of market share held by major players, highlighting the level of market concentration.
- M&A Activity: Assessment of past and projected M&A activity, including deal values (where available) and their impact on market structure.
- Innovation Drivers: Identification of key technological advancements and their contribution to market growth and competition.
- Regulatory Landscape: Analysis of the regulatory environment and its influence on market participants.
- Substitute Products: Evaluation of alternative technologies and their potential impact on market demand.
- End-User Trends: Examination of evolving end-user preferences and their influence on market dynamics.
New Zealand Data Center Power Market Industry Trends & Insights
This section delves into the key trends and insights shaping the New Zealand data center power market. We analyze the market's Compound Annual Growth Rate (CAGR) during the historical period (2019-2024) and project the CAGR for the forecast period (2025-2033). The analysis considers various factors driving market growth, including increasing data center construction, the adoption of cloud computing, and the rise of edge computing. Furthermore, the report examines technological disruptions, such as the increasing adoption of renewable energy sources in data centers, and how these influence consumer preferences and competitive dynamics. Market penetration rates for key technologies and services are also examined, providing a comprehensive picture of the industry's trajectory. The impact of macroeconomic factors on market growth is also considered, along with a detailed competitive landscape analysis, illustrating the strategies employed by leading players. The section concludes with a forward-looking perspective on the industry's evolution.
Dominant Markets & Segments in New Zealand Data Center Power Market
This section identifies the leading segments within the New Zealand data center power market. Analysis focuses on regional dominance (if applicable), and segment-level performance across Power Infrastructure (Electrical Solutions), Power Distribution Solutions (PDUs, Switchgear, Critical Power Distribution, Transfer Switches, Remote Power Panels, Others), Services, and End-User segments (IT and Telecommunication, BFSI, Government, Media and Entertainment, Other End Users). Key drivers for each dominant segment are detailed using bullet points.
- Power Infrastructure (Electrical Solutions): Dominance analysis, key drivers (e.g., infrastructure development, government policies).
- Power Distribution Solutions: Dominant sub-segments (e.g., PDUs, switchgear), key drivers (e.g., increasing data center density).
- Services: Market size and growth projections for various services offered (e.g., maintenance, support).
- End-User Segments: Dominant end-user sectors (e.g., IT and Telecommunications), growth drivers (e.g., digital transformation).
The report provides a detailed analysis of each segment, explaining its market share, growth trajectory, and underlying drivers. Detailed paragraphs will accompany each bullet point to provide a comprehensive understanding of the dominant segments and factors influencing their growth.
New Zealand Data Center Power Market Product Developments
This section summarizes the key product innovations, applications, and competitive advantages in the New Zealand data center power market. The report highlights recent technological advancements, such as the introduction of more efficient power distribution units (PDUs) and the growing adoption of renewable energy sources, and analyzes their impact on market dynamics. The analysis emphasizes the market fit of new products and technologies, examining their ability to address the needs of end-users and improve operational efficiency in data centers.
Report Scope & Segmentation Analysis
This report provides a detailed segmentation of the New Zealand data center power market, encompassing various aspects from power infrastructure solutions to diverse end-user segments. Each segment is analyzed individually, considering its market size, growth projections, and competitive landscape. For instance, the IT and Telecommunication segment is expected to exhibit significant growth, driven by the expansion of cloud services and the increasing adoption of data analytics. Similarly, the Power Distribution Solutions segment is likely to experience robust growth, owing to increasing demands for higher power capacity and improved energy efficiency in data centers. Further, the BFSI segment is analyzed concerning the particular power infrastructure requirements of banks and financial institutions. A detailed overview of the size and growth of each segment will be provided, along with insights into the competitive dynamics within each segment.
Key Drivers of New Zealand Data Center Power Market Growth
Several factors are driving the growth of the New Zealand data center power market. Key drivers include increasing government investment in digital infrastructure, the expanding adoption of cloud computing and big data analytics, and the rising need for energy-efficient power solutions. Furthermore, the stringent regulatory framework encouraging sustainable practices in the data center sector is driving innovation in green technologies.
Challenges in the New Zealand Data Center Power Market Sector
The New Zealand data center power market faces several challenges. These include the high initial investment costs associated with deploying advanced power infrastructure, the complexities involved in managing power grids, and the potential supply chain disruptions that can affect the availability of critical components. Further challenges include meeting stringent environmental regulations and ensuring grid stability in the face of increasing demand. The report quantifies the impact of these challenges on market growth.
Emerging Opportunities in New Zealand Data Center Power Market
The New Zealand data center power market presents numerous opportunities. The increasing adoption of renewable energy sources, the growing demand for edge computing solutions, and the potential for government-led initiatives to promote digital infrastructure development are all positive factors. Further opportunities arise from the advancements in energy storage technology, such as batteries, which can enhance grid reliability and power quality. The emergence of smart grid technologies and the adoption of innovative power management solutions offer additional avenues for growth.
Leading Players in the New Zealand Data Center Power Market Market
- ABB Ltd
- Rolls-Royce PLC
- Legrand Group
- Schneider Electric SE
- Fujitsu Limited
- Caterpillar Inc
- Rittal GmbH & Co KG
- Cisco Systems Inc
- Cummins Inc
- Vertiv Group Corp
- Eaton Corporation
Key Developments in New Zealand Data Center Power Market Industry
- 2022-Q3: Schneider Electric launched a new line of energy-efficient PDUs.
- 2023-Q1: ABB Ltd announced a partnership with a renewable energy provider to supply green power to data centers.
- (Further developments to be added with specific dates and impact)
Strategic Outlook for New Zealand Data Center Power Market Market
The New Zealand data center power market is poised for substantial growth driven by increasing digitalization, government initiatives, and the expanding adoption of cloud computing and data analytics. The ongoing focus on energy efficiency and sustainability is creating significant opportunities for players offering innovative power solutions. The market's future is bright, characterized by continued technological advancements and a growing demand for reliable and sustainable power infrastructure within the data center sector.
New Zealand Data Center Power Market Segmentation
-
1. Power Infrastructure
-
1.1. Electrical Solution
- 1.1.1. UPS Systems
- 1.1.2. Generators
-
1.1.3. Power Distribution Solutions
- 1.1.3.1. PDU
- 1.1.3.2. Switchgear
- 1.1.3.3. Critical Power Distribution
- 1.1.3.4. Transfer Switches
- 1.1.3.5. Remote Power Panels
- 1.1.3.6. Others
- 1.2. Service
-
1.1. Electrical Solution
-
2. End User
- 2.1. IT and Telecommunication
- 2.2. BFSI
- 2.3. Government
- 2.4. Media and Entertainment
- 2.5. Other End Users
New Zealand Data Center Power Market Segmentation By Geography
- 1. New Zealand
New Zealand Data Center Power Market REPORT HIGHLIGHTS
| Aspects | Details |
|---|---|
| Study Period | 2019-2033 |
| Base Year | 2024 |
| Estimated Year | 2025 |
| Forecast Period | 2025-2033 |
| Historical Period | 2019-2024 |
| Growth Rate | CAGR of 14.43% from 2019-2033 |
| Segmentation |
|
Table of Contents
- 1. Introduction
- 1.1. Research Scope
- 1.2. Market Segmentation
- 1.3. Research Methodology
- 1.4. Definitions and Assumptions
- 2. Executive Summary
- 2.1. Introduction
- 3. Market Dynamics
- 3.1. Introduction
- 3.2. Market Drivers
- 3.2.1. Rising Adoption of Mega Data Centers and Cloud Computing; Increasing Demand to Reduce Operational Costs
- 3.3. Market Restrains
- 3.3.1. High Cost of Installation and Maintenance
- 3.4. Market Trends
- 3.4.1. The BFSI Segment is Expected to have a Significant Market Share
- 4. Market Factor Analysis
- 4.1. Porters Five Forces
- 4.2. Supply/Value Chain
- 4.3. PESTEL analysis
- 4.4. Market Entropy
- 4.5. Patent/Trademark Analysis
- 5. New Zealand Data Center Power Market Analysis, Insights and Forecast, 2019-2031
- 5.1. Market Analysis, Insights and Forecast - by Power Infrastructure
- 5.1.1. Electrical Solution
- 5.1.1.1. UPS Systems
- 5.1.1.2. Generators
- 5.1.1.3. Power Distribution Solutions
- 5.1.1.3.1. PDU
- 5.1.1.3.2. Switchgear
- 5.1.1.3.3. Critical Power Distribution
- 5.1.1.3.4. Transfer Switches
- 5.1.1.3.5. Remote Power Panels
- 5.1.1.3.6. Others
- 5.1.2. Service
- 5.1.1. Electrical Solution
- 5.2. Market Analysis, Insights and Forecast - by End User
- 5.2.1. IT and Telecommunication
- 5.2.2. BFSI
- 5.2.3. Government
- 5.2.4. Media and Entertainment
- 5.2.5. Other End Users
- 5.3. Market Analysis, Insights and Forecast - by Region
- 5.3.1. New Zealand
- 5.1. Market Analysis, Insights and Forecast - by Power Infrastructure
- 6. Competitive Analysis
- 6.1. Market Share Analysis 2024
- 6.2. Company Profiles
- 6.2.1 ABB Ltd
- 6.2.1.1. Overview
- 6.2.1.2. Products
- 6.2.1.3. SWOT Analysis
- 6.2.1.4. Recent Developments
- 6.2.1.5. Financials (Based on Availability)
- 6.2.2 Rolls-Royce PLC
- 6.2.2.1. Overview
- 6.2.2.2. Products
- 6.2.2.3. SWOT Analysis
- 6.2.2.4. Recent Developments
- 6.2.2.5. Financials (Based on Availability)
- 6.2.3 Legrand Group
- 6.2.3.1. Overview
- 6.2.3.2. Products
- 6.2.3.3. SWOT Analysis
- 6.2.3.4. Recent Developments
- 6.2.3.5. Financials (Based on Availability)
- 6.2.4 Schneider Electric SE
- 6.2.4.1. Overview
- 6.2.4.2. Products
- 6.2.4.3. SWOT Analysis
- 6.2.4.4. Recent Developments
- 6.2.4.5. Financials (Based on Availability)
- 6.2.5 Fujitsu Limited
- 6.2.5.1. Overview
- 6.2.5.2. Products
- 6.2.5.3. SWOT Analysis
- 6.2.5.4. Recent Developments
- 6.2.5.5. Financials (Based on Availability)
- 6.2.6 Caterpillar Inc
- 6.2.6.1. Overview
- 6.2.6.2. Products
- 6.2.6.3. SWOT Analysis
- 6.2.6.4. Recent Developments
- 6.2.6.5. Financials (Based on Availability)
- 6.2.7 Rittal GmbH & Co KG
- 6.2.7.1. Overview
- 6.2.7.2. Products
- 6.2.7.3. SWOT Analysis
- 6.2.7.4. Recent Developments
- 6.2.7.5. Financials (Based on Availability)
- 6.2.8 Cisco Systems Inc *List Not Exhaustive
- 6.2.8.1. Overview
- 6.2.8.2. Products
- 6.2.8.3. SWOT Analysis
- 6.2.8.4. Recent Developments
- 6.2.8.5. Financials (Based on Availability)
- 6.2.9 Cummins Inc
- 6.2.9.1. Overview
- 6.2.9.2. Products
- 6.2.9.3. SWOT Analysis
- 6.2.9.4. Recent Developments
- 6.2.9.5. Financials (Based on Availability)
- 6.2.10 Vertiv Group Corp
- 6.2.10.1. Overview
- 6.2.10.2. Products
- 6.2.10.3. SWOT Analysis
- 6.2.10.4. Recent Developments
- 6.2.10.5. Financials (Based on Availability)
- 6.2.11 Eaton Corporation
- 6.2.11.1. Overview
- 6.2.11.2. Products
- 6.2.11.3. SWOT Analysis
- 6.2.11.4. Recent Developments
- 6.2.11.5. Financials (Based on Availability)
- 6.2.1 ABB Ltd
List of Figures
- Figure 1: New Zealand Data Center Power Market Revenue Breakdown (Million, %) by Product 2024 & 2032
- Figure 2: New Zealand Data Center Power Market Share (%) by Company 2024
List of Tables
- Table 1: New Zealand Data Center Power Market Revenue Million Forecast, by Region 2019 & 2032
- Table 2: New Zealand Data Center Power Market Revenue Million Forecast, by Power Infrastructure 2019 & 2032
- Table 3: New Zealand Data Center Power Market Revenue Million Forecast, by End User 2019 & 2032
- Table 4: New Zealand Data Center Power Market Revenue Million Forecast, by Region 2019 & 2032
- Table 5: New Zealand Data Center Power Market Revenue Million Forecast, by Country 2019 & 2032
- Table 6: New Zealand Data Center Power Market Revenue Million Forecast, by Power Infrastructure 2019 & 2032
- Table 7: New Zealand Data Center Power Market Revenue Million Forecast, by End User 2019 & 2032
- Table 8: New Zealand Data Center Power Market Revenue Million Forecast, by Country 2019 & 2032
Frequently Asked Questions
1. What is the projected Compound Annual Growth Rate (CAGR) of the New Zealand Data Center Power Market?
The projected CAGR is approximately 14.43%.
2. Which companies are prominent players in the New Zealand Data Center Power Market?
Key companies in the market include ABB Ltd, Rolls-Royce PLC, Legrand Group, Schneider Electric SE, Fujitsu Limited, Caterpillar Inc, Rittal GmbH & Co KG, Cisco Systems Inc *List Not Exhaustive, Cummins Inc, Vertiv Group Corp, Eaton Corporation.
3. What are the main segments of the New Zealand Data Center Power Market?
The market segments include Power Infrastructure, End User.
4. Can you provide details about the market size?
The market size is estimated to be USD 111.70 Million as of 2022.
5. What are some drivers contributing to market growth?
Rising Adoption of Mega Data Centers and Cloud Computing; Increasing Demand to Reduce Operational Costs.
6. What are the notable trends driving market growth?
The BFSI Segment is Expected to have a Significant Market Share.
7. Are there any restraints impacting market growth?
High Cost of Installation and Maintenance.
8. Can you provide examples of recent developments in the market?
N/A
9. What pricing options are available for accessing the report?
Pricing options include single-user, multi-user, and enterprise licenses priced at USD 3800, USD 4500, and USD 5800 respectively.
10. Is the market size provided in terms of value or volume?
The market size is provided in terms of value, measured in Million.
11. Are there any specific market keywords associated with the report?
Yes, the market keyword associated with the report is "New Zealand Data Center Power Market," which aids in identifying and referencing the specific market segment covered.
12. How do I determine which pricing option suits my needs best?
The pricing options vary based on user requirements and access needs. Individual users may opt for single-user licenses, while businesses requiring broader access may choose multi-user or enterprise licenses for cost-effective access to the report.
13. Are there any additional resources or data provided in the New Zealand Data Center Power Market report?
While the report offers comprehensive insights, it's advisable to review the specific contents or supplementary materials provided to ascertain if additional resources or data are available.
14. How can I stay updated on further developments or reports in the New Zealand Data Center Power Market?
To stay informed about further developments, trends, and reports in the New Zealand Data Center Power Market, consider subscribing to industry newsletters, following relevant companies and organizations, or regularly checking reputable industry news sources and publications.
Methodology
Step 1 - Identification of Relevant Samples Size from Population Database


Step 2 - Approaches for Defining Global Market Size (Value, Volume* & Price*)

Note*: In applicable scenarios
Step 3 - Data Sources
Primary Research
- Web Analytics
- Survey Reports
- Research Institute
- Latest Research Reports
- Opinion Leaders
Secondary Research
- Annual Reports
- White Paper
- Latest Press Release
- Industry Association
- Paid Database
- Investor Presentations

Step 4 - Data Triangulation
Involves using different sources of information in order to increase the validity of a study
These sources are likely to be stakeholders in a program - participants, other researchers, program staff, other community members, and so on.
Then we put all data in single framework & apply various statistical tools to find out the dynamic on the market.
During the analysis stage, feedback from the stakeholder groups would be compared to determine areas of agreement as well as areas of divergence


