
Key Insights
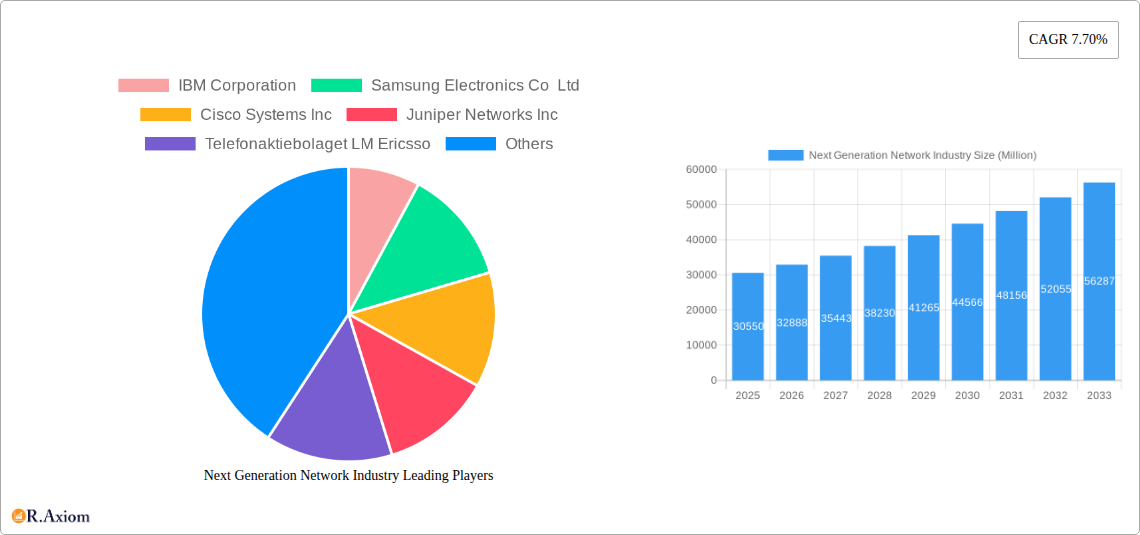
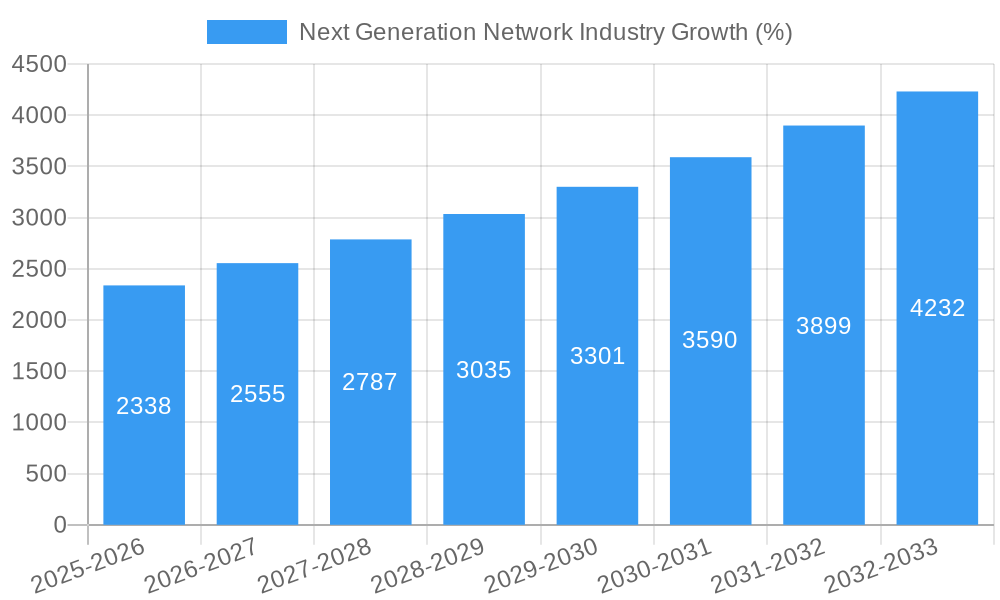
The Next Generation Network (NGN) industry is experiencing robust growth, projected to reach a market size of $30.55 billion in 2025 and maintain a Compound Annual Growth Rate (CAGR) of 7.70% from 2025 to 2033. This expansion is driven by several key factors. The increasing demand for higher bandwidth and improved network performance fuels the adoption of advanced technologies like 5G and software-defined networking (SDN). Furthermore, the rise of cloud computing, the Internet of Things (IoT), and the increasing digitization across various sectors, including telecom, government, and other end-users, are significant catalysts. Government initiatives promoting digital infrastructure development and the need for secure and reliable networks further contribute to market growth. While challenges such as the high initial investment required for NGN deployment and the complexity of integrating legacy systems exist, the long-term benefits outweigh these limitations, ensuring sustained market expansion.
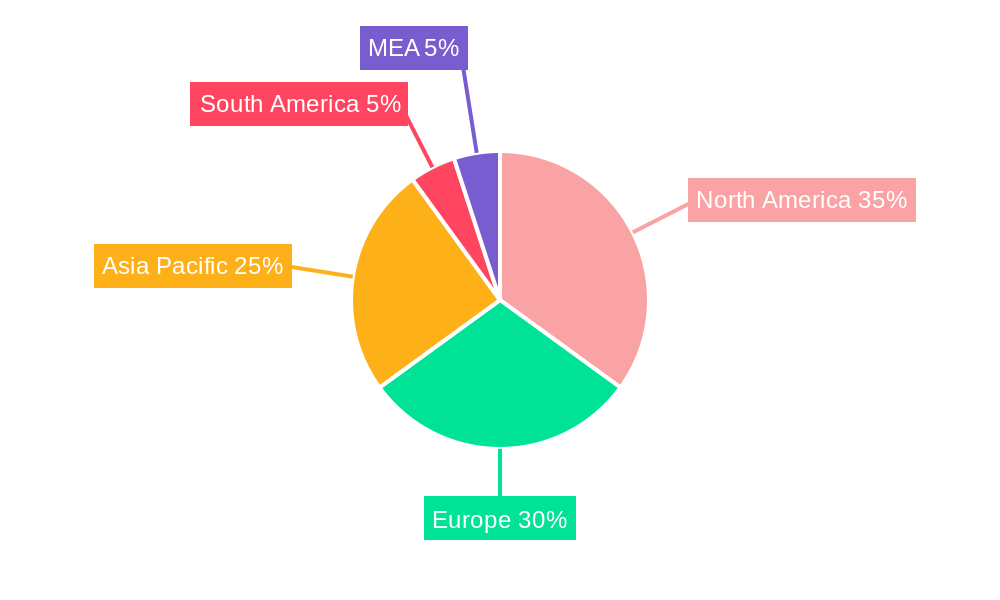
The segmental analysis reveals that hardware, software, and services all contribute significantly to the NGN market. However, the software segment is poised for particularly rapid growth due to the increasing adoption of virtualized network functions (VNFs) and network function virtualization (NFV). Geographically, North America and Europe currently hold substantial market shares, driven by early adoption of advanced technologies and strong digital infrastructure. However, the Asia-Pacific region is expected to witness the fastest growth in the coming years, fueled by rapid urbanization, expanding internet penetration, and significant investments in telecommunication infrastructure. Key players like IBM, Samsung, Cisco, Juniper, Ericsson, and Huawei are actively shaping the NGN landscape through innovation and strategic partnerships, fostering competition and driving technological advancements. The continued development and deployment of advanced technologies, coupled with supportive government policies, will ensure the sustained growth of the NGN market in the forecast period.
This in-depth report provides a comprehensive analysis of the Next Generation Network (NGN) industry, offering invaluable insights for stakeholders, investors, and industry professionals. The study period spans 2019-2033, with 2025 as the base and estimated year, and a forecast period of 2025-2033. The report delves into market size, growth drivers, challenges, and emerging opportunities, providing actionable intelligence for strategic decision-making. The market is valued at xx Million in 2025 and is projected to reach xx Million by 2033, exhibiting a CAGR of xx%.
Next Generation Network Industry Market Concentration & Innovation
The Next Generation Network industry exhibits a moderately concentrated market structure, with a handful of dominant players commanding significant market share. Key players like Cisco Systems Inc, Huawei Technologies Co Ltd, Nokia Corporation, and Ericsson hold substantial influence, shaped by their extensive portfolios and global reach. However, smaller, specialized companies are increasingly making inroads through innovation in niche segments. Market share dynamics are influenced by factors like technological advancements, strategic acquisitions, and evolving regulatory landscapes. M&A activities have been relatively frequent, with deal values exceeding xx Million in recent years, reflecting the industry's dynamic nature and ongoing consolidation.
- Market Share (2025 Estimate): Cisco Systems Inc (xx%), Huawei Technologies Co Ltd (xx%), Nokia Corporation (xx%), Ericsson (xx%), Others (xx%). These figures are estimates and can vary depending on the specific segment.
- Innovation Drivers: The relentless pursuit of higher speeds, lower latency, increased bandwidth, and enhanced security drives constant innovation. 5G deployment, Software-Defined Networking (SDN), Network Function Virtualization (NFV), and edge computing are key catalysts.
- Regulatory Frameworks: Government regulations concerning data privacy, cybersecurity, and spectrum allocation significantly impact market dynamics. Varying regulatory environments across different regions influence market penetration and adoption rates.
- Product Substitutes: While NGNs are the dominant technology, alternative solutions, such as satellite communication and private networks, offer some level of competition, particularly in niche applications.
- End-User Trends: The increasing demand for high-bandwidth applications, like video streaming and cloud computing, fuels the growth of NGNs. Government initiatives to enhance digital infrastructure further underpin market expansion.
- M&A Activities: Consolidation continues, with larger players acquiring smaller companies to expand their product portfolios, enhance technological capabilities, and broaden their geographic reach. Recent deals valued at xx Million indicate a robust pace of M&A activity.
Next Generation Network Industry Industry Trends & Insights
The NGN market is characterized by rapid technological advancements, evolving consumer preferences, and intense competitive dynamics. The market exhibits substantial growth potential, driven primarily by the widespread adoption of 5G, the increasing demand for high-speed internet access, and the growth of data-intensive applications. The global shift towards cloud computing and the increasing penetration of IoT devices are also fueling growth. However, challenges such as security concerns, the high cost of infrastructure deployment, and the complexity of integrating new technologies represent significant hurdles. Technological disruptions, such as the emergence of 6G technologies and the growing adoption of artificial intelligence in network management, are reshaping the competitive landscape. Consumer preferences increasingly favor seamless, secure, and reliable connectivity, driving the demand for advanced NGN solutions.
Dominant Markets & Segments in Next Generation Network Industry
The North American region currently dominates the NGN market, driven by robust economic growth, advanced infrastructure, and high consumer adoption rates. Within the segments, the Hardware segment holds the largest market share, primarily due to the substantial investment required in network infrastructure upgrades. However, the Software and Services segments exhibit faster growth rates, fueled by the increasing demand for software-defined networking and cloud-based solutions.
By Offering:
- Hardware: High capital expenditure on equipment drives this segment's dominance.
- Software: Rapid growth due to SDN and NFV adoption.
- Services: Strong growth driven by increasing demand for network management and maintenance services.
By End User:
- Telecom and Internet Service Providers: The largest segment, due to their core reliance on NGN infrastructure.
- Government: Significant investments in national infrastructure projects boost government spending on NGN.
- Other End-users: This segment includes enterprises and individuals using NGN services.
Key Drivers (North America):
- Strong economic growth and high disposable incomes.
- Advanced telecommunications infrastructure.
- High consumer adoption of internet-based services.
- Supportive government policies promoting digital transformation.
Next Generation Network Industry Product Developments
Recent product innovations focus on enhanced security features, improved network performance, and greater scalability. The adoption of AI and machine learning for network optimization is a significant trend. Key competitive advantages stem from proprietary technologies, efficient deployment strategies, and superior customer support. The market is characterized by a continuous cycle of upgrades and innovation, driven by the need to meet the ever-increasing demands of consumers and businesses.
Report Scope & Segmentation Analysis
This report segments the NGN market by offering (Hardware, Software, Services) and by end-user (Telecom and Internet Service Providers, Government, Other End-users). Each segment's market size, growth projections, and competitive dynamics are analyzed in detail. The Hardware segment is projected to experience robust growth fueled by continuous infrastructure upgrades. The Software segment is poised for rapid growth, driven by the increasing adoption of SDN and NFV. The Services segment is expected to expand steadily, propelled by the rising demand for managed network services. Within the end-user segments, Telecom and Internet Service Providers represent the largest market, with substantial investments in NGN infrastructure. Government and other end-users contribute significantly to overall market growth.
Key Drivers of Next Generation Network Industry Growth
Several factors are driving the growth of the NGN industry. Technological advancements, such as the rollout of 5G and the development of edge computing, are significantly expanding the capabilities and applications of NGNs. The increasing demand for high-bandwidth applications, including video streaming, cloud computing, and the Internet of Things (IoT), is creating a strong need for NGN infrastructure. Furthermore, supportive government policies and investments in digital infrastructure are further fueling market expansion.
Challenges in the Next Generation Network Industry Sector
The NGN industry faces challenges including high capital expenditure requirements for infrastructure deployment, security concerns related to data breaches and cyberattacks, and the complexity of integrating diverse technologies. Supply chain disruptions and talent shortages in specialized areas also present significant headwinds. These challenges can impact market growth and profitability if not addressed effectively. The estimated impact on market growth due to these challenges is a reduction of approximately xx Million in the forecast period.
Emerging Opportunities in Next Generation Network Industry
Emerging opportunities include the expansion of 5G networks, the growth of edge computing, the increasing adoption of private 5G networks, and the development of innovative network management solutions. The integration of AI and machine learning in network operations is also presenting new opportunities for service providers. These developments promise to create significant market expansion in the coming years.
Leading Players in the Next Generation Network Industry Market
- IBM Corporation
- Samsung Electronics Co Ltd
- Cisco Systems Inc
- Juniper Networks Inc
- Telefonaktiebolaget LM Ericsson
- NEC Corporation
- Huawei Technologies Co Ltd
- ZTE Corporation
- Nokia Corporation
- Ciena Corporation
Key Developments in Next Generation Network Industry Industry
- September 2023: Charter Communications Inc. partnered with Qualcomm Technologies Inc. to launch a next-generation Wi-Fi 7 router, supporting 10 Gbps speeds and enhancing converged connectivity experiences for residential and SMB customers. This development drives market growth by improving customer experience and broadening adoption.
- February 2024: Schneider Electric launched a Distributed Control Node (DCN) software framework in collaboration with Intel and Red Hat, enabling industrial companies to transition to software-defined, plug-and-produce automation solutions. This reflects a growing trend of software-defined infrastructure and opens new market segments for NGN technology.
Strategic Outlook for Next Generation Network Industry Market
The future of the NGN market is bright, driven by continuous technological advancements, increasing demand for high-speed connectivity, and growing adoption across various sectors. The expansion of 5G, edge computing, and IoT will play a pivotal role in shaping future market growth. Strategic partnerships and technological collaborations are crucial for companies to succeed in this rapidly evolving landscape. Investing in research and development, enhancing security measures, and adapting to changing consumer preferences will be key factors for achieving long-term success.
Next Generation Network Industry Segmentation
-
1. Offering
- 1.1. Hardware
- 1.2. Software
- 1.3. Services
-
2. End User
- 2.1. Telecom and Internet Service Providers
- 2.2. Government
- 2.3. Other End-users
Next Generation Network Industry Segmentation By Geography
- 1. North America
- 2. Europe
- 3. Asia Pacific
- 4. Latin America
- 5. Middle East and Africa
Next Generation Network Industry REPORT HIGHLIGHTS
| Aspects | Details |
|---|---|
| Study Period | 2019-2033 |
| Base Year | 2024 |
| Estimated Year | 2025 |
| Forecast Period | 2025-2033 |
| Historical Period | 2019-2024 |
| Growth Rate | CAGR of 7.70% from 2019-2033 |
| Segmentation |
|
Table of Contents
- 1. Introduction
- 1.1. Research Scope
- 1.2. Market Segmentation
- 1.3. Research Methodology
- 1.4. Definitions and Assumptions
- 2. Executive Summary
- 2.1. Introduction
- 3. Market Dynamics
- 3.1. Introduction
- 3.2. Market Drivers
- 3.2.1. Increasing Demand for High-Speed Services
- 3.3. Market Restrains
- 3.3.1. High Costs Related to the Infrastructure
- 3.4. Market Trends
- 3.4.1. Hardware Offering Holds Significant Market Share
- 4. Market Factor Analysis
- 4.1. Porters Five Forces
- 4.2. Supply/Value Chain
- 4.3. PESTEL analysis
- 4.4. Market Entropy
- 4.5. Patent/Trademark Analysis
- 5. Global Next Generation Network Industry Analysis, Insights and Forecast, 2019-2031
- 5.1. Market Analysis, Insights and Forecast - by Offering
- 5.1.1. Hardware
- 5.1.2. Software
- 5.1.3. Services
- 5.2. Market Analysis, Insights and Forecast - by End User
- 5.2.1. Telecom and Internet Service Providers
- 5.2.2. Government
- 5.2.3. Other End-users
- 5.3. Market Analysis, Insights and Forecast - by Region
- 5.3.1. North America
- 5.3.2. Europe
- 5.3.3. Asia Pacific
- 5.3.4. Latin America
- 5.3.5. Middle East and Africa
- 5.1. Market Analysis, Insights and Forecast - by Offering
- 6. North America Next Generation Network Industry Analysis, Insights and Forecast, 2019-2031
- 6.1. Market Analysis, Insights and Forecast - by Offering
- 6.1.1. Hardware
- 6.1.2. Software
- 6.1.3. Services
- 6.2. Market Analysis, Insights and Forecast - by End User
- 6.2.1. Telecom and Internet Service Providers
- 6.2.2. Government
- 6.2.3. Other End-users
- 6.1. Market Analysis, Insights and Forecast - by Offering
- 7. Europe Next Generation Network Industry Analysis, Insights and Forecast, 2019-2031
- 7.1. Market Analysis, Insights and Forecast - by Offering
- 7.1.1. Hardware
- 7.1.2. Software
- 7.1.3. Services
- 7.2. Market Analysis, Insights and Forecast - by End User
- 7.2.1. Telecom and Internet Service Providers
- 7.2.2. Government
- 7.2.3. Other End-users
- 7.1. Market Analysis, Insights and Forecast - by Offering
- 8. Asia Pacific Next Generation Network Industry Analysis, Insights and Forecast, 2019-2031
- 8.1. Market Analysis, Insights and Forecast - by Offering
- 8.1.1. Hardware
- 8.1.2. Software
- 8.1.3. Services
- 8.2. Market Analysis, Insights and Forecast - by End User
- 8.2.1. Telecom and Internet Service Providers
- 8.2.2. Government
- 8.2.3. Other End-users
- 8.1. Market Analysis, Insights and Forecast - by Offering
- 9. Latin America Next Generation Network Industry Analysis, Insights and Forecast, 2019-2031
- 9.1. Market Analysis, Insights and Forecast - by Offering
- 9.1.1. Hardware
- 9.1.2. Software
- 9.1.3. Services
- 9.2. Market Analysis, Insights and Forecast - by End User
- 9.2.1. Telecom and Internet Service Providers
- 9.2.2. Government
- 9.2.3. Other End-users
- 9.1. Market Analysis, Insights and Forecast - by Offering
- 10. Middle East and Africa Next Generation Network Industry Analysis, Insights and Forecast, 2019-2031
- 10.1. Market Analysis, Insights and Forecast - by Offering
- 10.1.1. Hardware
- 10.1.2. Software
- 10.1.3. Services
- 10.2. Market Analysis, Insights and Forecast - by End User
- 10.2.1. Telecom and Internet Service Providers
- 10.2.2. Government
- 10.2.3. Other End-users
- 10.1. Market Analysis, Insights and Forecast - by Offering
- 11. North America Next Generation Network Industry Analysis, Insights and Forecast, 2019-2031
- 11.1. Market Analysis, Insights and Forecast - By Country/Sub-region
- 11.1.1 United States
- 11.1.2 Canada
- 11.1.3 Mexico
- 12. Europe Next Generation Network Industry Analysis, Insights and Forecast, 2019-2031
- 12.1. Market Analysis, Insights and Forecast - By Country/Sub-region
- 12.1.1 Germany
- 12.1.2 United Kingdom
- 12.1.3 France
- 12.1.4 Spain
- 12.1.5 Italy
- 12.1.6 Spain
- 12.1.7 Belgium
- 12.1.8 Netherland
- 12.1.9 Nordics
- 12.1.10 Rest of Europe
- 13. Asia Pacific Next Generation Network Industry Analysis, Insights and Forecast, 2019-2031
- 13.1. Market Analysis, Insights and Forecast - By Country/Sub-region
- 13.1.1 China
- 13.1.2 Japan
- 13.1.3 India
- 13.1.4 South Korea
- 13.1.5 Southeast Asia
- 13.1.6 Australia
- 13.1.7 Indonesia
- 13.1.8 Phillipes
- 13.1.9 Singapore
- 13.1.10 Thailandc
- 13.1.11 Rest of Asia Pacific
- 14. South America Next Generation Network Industry Analysis, Insights and Forecast, 2019-2031
- 14.1. Market Analysis, Insights and Forecast - By Country/Sub-region
- 14.1.1 Brazil
- 14.1.2 Argentina
- 14.1.3 Peru
- 14.1.4 Chile
- 14.1.5 Colombia
- 14.1.6 Ecuador
- 14.1.7 Venezuela
- 14.1.8 Rest of South America
- 15. North America Next Generation Network Industry Analysis, Insights and Forecast, 2019-2031
- 15.1. Market Analysis, Insights and Forecast - By Country/Sub-region
- 15.1.1 United States
- 15.1.2 Canada
- 15.1.3 Mexico
- 16. MEA Next Generation Network Industry Analysis, Insights and Forecast, 2019-2031
- 16.1. Market Analysis, Insights and Forecast - By Country/Sub-region
- 16.1.1 United Arab Emirates
- 16.1.2 Saudi Arabia
- 16.1.3 South Africa
- 16.1.4 Rest of Middle East and Africa
- 17. Competitive Analysis
- 17.1. Global Market Share Analysis 2024
- 17.2. Company Profiles
- 17.2.1 IBM Corporation
- 17.2.1.1. Overview
- 17.2.1.2. Products
- 17.2.1.3. SWOT Analysis
- 17.2.1.4. Recent Developments
- 17.2.1.5. Financials (Based on Availability)
- 17.2.2 Samsung Electronics Co Ltd
- 17.2.2.1. Overview
- 17.2.2.2. Products
- 17.2.2.3. SWOT Analysis
- 17.2.2.4. Recent Developments
- 17.2.2.5. Financials (Based on Availability)
- 17.2.3 Cisco Systems Inc
- 17.2.3.1. Overview
- 17.2.3.2. Products
- 17.2.3.3. SWOT Analysis
- 17.2.3.4. Recent Developments
- 17.2.3.5. Financials (Based on Availability)
- 17.2.4 Juniper Networks Inc
- 17.2.4.1. Overview
- 17.2.4.2. Products
- 17.2.4.3. SWOT Analysis
- 17.2.4.4. Recent Developments
- 17.2.4.5. Financials (Based on Availability)
- 17.2.5 Telefonaktiebolaget LM Ericsso
- 17.2.5.1. Overview
- 17.2.5.2. Products
- 17.2.5.3. SWOT Analysis
- 17.2.5.4. Recent Developments
- 17.2.5.5. Financials (Based on Availability)
- 17.2.6 NEC Corporation
- 17.2.6.1. Overview
- 17.2.6.2. Products
- 17.2.6.3. SWOT Analysis
- 17.2.6.4. Recent Developments
- 17.2.6.5. Financials (Based on Availability)
- 17.2.7 Huawei Technologies Co Ltd
- 17.2.7.1. Overview
- 17.2.7.2. Products
- 17.2.7.3. SWOT Analysis
- 17.2.7.4. Recent Developments
- 17.2.7.5. Financials (Based on Availability)
- 17.2.8 ZTE Corporation
- 17.2.8.1. Overview
- 17.2.8.2. Products
- 17.2.8.3. SWOT Analysis
- 17.2.8.4. Recent Developments
- 17.2.8.5. Financials (Based on Availability)
- 17.2.9 Nokia Corporation
- 17.2.9.1. Overview
- 17.2.9.2. Products
- 17.2.9.3. SWOT Analysis
- 17.2.9.4. Recent Developments
- 17.2.9.5. Financials (Based on Availability)
- 17.2.10 Ciena Corporation
- 17.2.10.1. Overview
- 17.2.10.2. Products
- 17.2.10.3. SWOT Analysis
- 17.2.10.4. Recent Developments
- 17.2.10.5. Financials (Based on Availability)
- 17.2.1 IBM Corporation
List of Figures
- Figure 1: Global Next Generation Network Industry Revenue Breakdown (Million, %) by Region 2024 & 2032
- Figure 2: North America Next Generation Network Industry Revenue (Million), by Country 2024 & 2032
- Figure 3: North America Next Generation Network Industry Revenue Share (%), by Country 2024 & 2032
- Figure 4: Europe Next Generation Network Industry Revenue (Million), by Country 2024 & 2032
- Figure 5: Europe Next Generation Network Industry Revenue Share (%), by Country 2024 & 2032
- Figure 6: Asia Pacific Next Generation Network Industry Revenue (Million), by Country 2024 & 2032
- Figure 7: Asia Pacific Next Generation Network Industry Revenue Share (%), by Country 2024 & 2032
- Figure 8: South America Next Generation Network Industry Revenue (Million), by Country 2024 & 2032
- Figure 9: South America Next Generation Network Industry Revenue Share (%), by Country 2024 & 2032
- Figure 10: North America Next Generation Network Industry Revenue (Million), by Country 2024 & 2032
- Figure 11: North America Next Generation Network Industry Revenue Share (%), by Country 2024 & 2032
- Figure 12: MEA Next Generation Network Industry Revenue (Million), by Country 2024 & 2032
- Figure 13: MEA Next Generation Network Industry Revenue Share (%), by Country 2024 & 2032
- Figure 14: North America Next Generation Network Industry Revenue (Million), by Offering 2024 & 2032
- Figure 15: North America Next Generation Network Industry Revenue Share (%), by Offering 2024 & 2032
- Figure 16: North America Next Generation Network Industry Revenue (Million), by End User 2024 & 2032
- Figure 17: North America Next Generation Network Industry Revenue Share (%), by End User 2024 & 2032
- Figure 18: North America Next Generation Network Industry Revenue (Million), by Country 2024 & 2032
- Figure 19: North America Next Generation Network Industry Revenue Share (%), by Country 2024 & 2032
- Figure 20: Europe Next Generation Network Industry Revenue (Million), by Offering 2024 & 2032
- Figure 21: Europe Next Generation Network Industry Revenue Share (%), by Offering 2024 & 2032
- Figure 22: Europe Next Generation Network Industry Revenue (Million), by End User 2024 & 2032
- Figure 23: Europe Next Generation Network Industry Revenue Share (%), by End User 2024 & 2032
- Figure 24: Europe Next Generation Network Industry Revenue (Million), by Country 2024 & 2032
- Figure 25: Europe Next Generation Network Industry Revenue Share (%), by Country 2024 & 2032
- Figure 26: Asia Pacific Next Generation Network Industry Revenue (Million), by Offering 2024 & 2032
- Figure 27: Asia Pacific Next Generation Network Industry Revenue Share (%), by Offering 2024 & 2032
- Figure 28: Asia Pacific Next Generation Network Industry Revenue (Million), by End User 2024 & 2032
- Figure 29: Asia Pacific Next Generation Network Industry Revenue Share (%), by End User 2024 & 2032
- Figure 30: Asia Pacific Next Generation Network Industry Revenue (Million), by Country 2024 & 2032
- Figure 31: Asia Pacific Next Generation Network Industry Revenue Share (%), by Country 2024 & 2032
- Figure 32: Latin America Next Generation Network Industry Revenue (Million), by Offering 2024 & 2032
- Figure 33: Latin America Next Generation Network Industry Revenue Share (%), by Offering 2024 & 2032
- Figure 34: Latin America Next Generation Network Industry Revenue (Million), by End User 2024 & 2032
- Figure 35: Latin America Next Generation Network Industry Revenue Share (%), by End User 2024 & 2032
- Figure 36: Latin America Next Generation Network Industry Revenue (Million), by Country 2024 & 2032
- Figure 37: Latin America Next Generation Network Industry Revenue Share (%), by Country 2024 & 2032
- Figure 38: Middle East and Africa Next Generation Network Industry Revenue (Million), by Offering 2024 & 2032
- Figure 39: Middle East and Africa Next Generation Network Industry Revenue Share (%), by Offering 2024 & 2032
- Figure 40: Middle East and Africa Next Generation Network Industry Revenue (Million), by End User 2024 & 2032
- Figure 41: Middle East and Africa Next Generation Network Industry Revenue Share (%), by End User 2024 & 2032
- Figure 42: Middle East and Africa Next Generation Network Industry Revenue (Million), by Country 2024 & 2032
- Figure 43: Middle East and Africa Next Generation Network Industry Revenue Share (%), by Country 2024 & 2032
List of Tables
- Table 1: Global Next Generation Network Industry Revenue Million Forecast, by Region 2019 & 2032
- Table 2: Global Next Generation Network Industry Revenue Million Forecast, by Offering 2019 & 2032
- Table 3: Global Next Generation Network Industry Revenue Million Forecast, by End User 2019 & 2032
- Table 4: Global Next Generation Network Industry Revenue Million Forecast, by Region 2019 & 2032
- Table 5: Global Next Generation Network Industry Revenue Million Forecast, by Country 2019 & 2032
- Table 6: United States Next Generation Network Industry Revenue (Million) Forecast, by Application 2019 & 2032
- Table 7: Canada Next Generation Network Industry Revenue (Million) Forecast, by Application 2019 & 2032
- Table 8: Mexico Next Generation Network Industry Revenue (Million) Forecast, by Application 2019 & 2032
- Table 9: Global Next Generation Network Industry Revenue Million Forecast, by Country 2019 & 2032
- Table 10: Germany Next Generation Network Industry Revenue (Million) Forecast, by Application 2019 & 2032
- Table 11: United Kingdom Next Generation Network Industry Revenue (Million) Forecast, by Application 2019 & 2032
- Table 12: France Next Generation Network Industry Revenue (Million) Forecast, by Application 2019 & 2032
- Table 13: Spain Next Generation Network Industry Revenue (Million) Forecast, by Application 2019 & 2032
- Table 14: Italy Next Generation Network Industry Revenue (Million) Forecast, by Application 2019 & 2032
- Table 15: Spain Next Generation Network Industry Revenue (Million) Forecast, by Application 2019 & 2032
- Table 16: Belgium Next Generation Network Industry Revenue (Million) Forecast, by Application 2019 & 2032
- Table 17: Netherland Next Generation Network Industry Revenue (Million) Forecast, by Application 2019 & 2032
- Table 18: Nordics Next Generation Network Industry Revenue (Million) Forecast, by Application 2019 & 2032
- Table 19: Rest of Europe Next Generation Network Industry Revenue (Million) Forecast, by Application 2019 & 2032
- Table 20: Global Next Generation Network Industry Revenue Million Forecast, by Country 2019 & 2032
- Table 21: China Next Generation Network Industry Revenue (Million) Forecast, by Application 2019 & 2032
- Table 22: Japan Next Generation Network Industry Revenue (Million) Forecast, by Application 2019 & 2032
- Table 23: India Next Generation Network Industry Revenue (Million) Forecast, by Application 2019 & 2032
- Table 24: South Korea Next Generation Network Industry Revenue (Million) Forecast, by Application 2019 & 2032
- Table 25: Southeast Asia Next Generation Network Industry Revenue (Million) Forecast, by Application 2019 & 2032
- Table 26: Australia Next Generation Network Industry Revenue (Million) Forecast, by Application 2019 & 2032
- Table 27: Indonesia Next Generation Network Industry Revenue (Million) Forecast, by Application 2019 & 2032
- Table 28: Phillipes Next Generation Network Industry Revenue (Million) Forecast, by Application 2019 & 2032
- Table 29: Singapore Next Generation Network Industry Revenue (Million) Forecast, by Application 2019 & 2032
- Table 30: Thailandc Next Generation Network Industry Revenue (Million) Forecast, by Application 2019 & 2032
- Table 31: Rest of Asia Pacific Next Generation Network Industry Revenue (Million) Forecast, by Application 2019 & 2032
- Table 32: Global Next Generation Network Industry Revenue Million Forecast, by Country 2019 & 2032
- Table 33: Brazil Next Generation Network Industry Revenue (Million) Forecast, by Application 2019 & 2032
- Table 34: Argentina Next Generation Network Industry Revenue (Million) Forecast, by Application 2019 & 2032
- Table 35: Peru Next Generation Network Industry Revenue (Million) Forecast, by Application 2019 & 2032
- Table 36: Chile Next Generation Network Industry Revenue (Million) Forecast, by Application 2019 & 2032
- Table 37: Colombia Next Generation Network Industry Revenue (Million) Forecast, by Application 2019 & 2032
- Table 38: Ecuador Next Generation Network Industry Revenue (Million) Forecast, by Application 2019 & 2032
- Table 39: Venezuela Next Generation Network Industry Revenue (Million) Forecast, by Application 2019 & 2032
- Table 40: Rest of South America Next Generation Network Industry Revenue (Million) Forecast, by Application 2019 & 2032
- Table 41: Global Next Generation Network Industry Revenue Million Forecast, by Country 2019 & 2032
- Table 42: United States Next Generation Network Industry Revenue (Million) Forecast, by Application 2019 & 2032
- Table 43: Canada Next Generation Network Industry Revenue (Million) Forecast, by Application 2019 & 2032
- Table 44: Mexico Next Generation Network Industry Revenue (Million) Forecast, by Application 2019 & 2032
- Table 45: Global Next Generation Network Industry Revenue Million Forecast, by Country 2019 & 2032
- Table 46: United Arab Emirates Next Generation Network Industry Revenue (Million) Forecast, by Application 2019 & 2032
- Table 47: Saudi Arabia Next Generation Network Industry Revenue (Million) Forecast, by Application 2019 & 2032
- Table 48: South Africa Next Generation Network Industry Revenue (Million) Forecast, by Application 2019 & 2032
- Table 49: Rest of Middle East and Africa Next Generation Network Industry Revenue (Million) Forecast, by Application 2019 & 2032
- Table 50: Global Next Generation Network Industry Revenue Million Forecast, by Offering 2019 & 2032
- Table 51: Global Next Generation Network Industry Revenue Million Forecast, by End User 2019 & 2032
- Table 52: Global Next Generation Network Industry Revenue Million Forecast, by Country 2019 & 2032
- Table 53: Global Next Generation Network Industry Revenue Million Forecast, by Offering 2019 & 2032
- Table 54: Global Next Generation Network Industry Revenue Million Forecast, by End User 2019 & 2032
- Table 55: Global Next Generation Network Industry Revenue Million Forecast, by Country 2019 & 2032
- Table 56: Global Next Generation Network Industry Revenue Million Forecast, by Offering 2019 & 2032
- Table 57: Global Next Generation Network Industry Revenue Million Forecast, by End User 2019 & 2032
- Table 58: Global Next Generation Network Industry Revenue Million Forecast, by Country 2019 & 2032
- Table 59: Global Next Generation Network Industry Revenue Million Forecast, by Offering 2019 & 2032
- Table 60: Global Next Generation Network Industry Revenue Million Forecast, by End User 2019 & 2032
- Table 61: Global Next Generation Network Industry Revenue Million Forecast, by Country 2019 & 2032
- Table 62: Global Next Generation Network Industry Revenue Million Forecast, by Offering 2019 & 2032
- Table 63: Global Next Generation Network Industry Revenue Million Forecast, by End User 2019 & 2032
- Table 64: Global Next Generation Network Industry Revenue Million Forecast, by Country 2019 & 2032
Frequently Asked Questions
1. What is the projected Compound Annual Growth Rate (CAGR) of the Next Generation Network Industry?
The projected CAGR is approximately 7.70%.
2. Which companies are prominent players in the Next Generation Network Industry?
Key companies in the market include IBM Corporation, Samsung Electronics Co Ltd, Cisco Systems Inc, Juniper Networks Inc, Telefonaktiebolaget LM Ericsso, NEC Corporation, Huawei Technologies Co Ltd, ZTE Corporation, Nokia Corporation, Ciena Corporation.
3. What are the main segments of the Next Generation Network Industry?
The market segments include Offering, End User.
4. Can you provide details about the market size?
The market size is estimated to be USD 30.55 Million as of 2022.
5. What are some drivers contributing to market growth?
Increasing Demand for High-Speed Services.
6. What are the notable trends driving market growth?
Hardware Offering Holds Significant Market Share.
7. Are there any restraints impacting market growth?
High Costs Related to the Infrastructure.
8. Can you provide examples of recent developments in the market?
February 2024 - Schneider Electric, delivering next-generation, open automation infrastructure in collaboration with the technology companies Intel and Red Hat, released a Distributed Control Node (DCN) software framework. An expansion of Schneider Electric's EcoStruxure Automation Expert, this new framework allows industrial companies to move to a software-defined, plug-and-produce solution, enabling them to augment their operations, ensure quality, minimize complexity, and optimize costs.
9. What pricing options are available for accessing the report?
Pricing options include single-user, multi-user, and enterprise licenses priced at USD 4750, USD 5250, and USD 8750 respectively.
10. Is the market size provided in terms of value or volume?
The market size is provided in terms of value, measured in Million.
11. Are there any specific market keywords associated with the report?
Yes, the market keyword associated with the report is "Next Generation Network Industry," which aids in identifying and referencing the specific market segment covered.
12. How do I determine which pricing option suits my needs best?
The pricing options vary based on user requirements and access needs. Individual users may opt for single-user licenses, while businesses requiring broader access may choose multi-user or enterprise licenses for cost-effective access to the report.
13. Are there any additional resources or data provided in the Next Generation Network Industry report?
While the report offers comprehensive insights, it's advisable to review the specific contents or supplementary materials provided to ascertain if additional resources or data are available.
14. How can I stay updated on further developments or reports in the Next Generation Network Industry?
To stay informed about further developments, trends, and reports in the Next Generation Network Industry, consider subscribing to industry newsletters, following relevant companies and organizations, or regularly checking reputable industry news sources and publications.
Methodology
Step 1 - Identification of Relevant Samples Size from Population Database


Step 2 - Approaches for Defining Global Market Size (Value, Volume* & Price*)

Note*: In applicable scenarios
Step 3 - Data Sources
Primary Research
- Web Analytics
- Survey Reports
- Research Institute
- Latest Research Reports
- Opinion Leaders
Secondary Research
- Annual Reports
- White Paper
- Latest Press Release
- Industry Association
- Paid Database
- Investor Presentations

Step 4 - Data Triangulation
Involves using different sources of information in order to increase the validity of a study
These sources are likely to be stakeholders in a program - participants, other researchers, program staff, other community members, and so on.
Then we put all data in single framework & apply various statistical tools to find out the dynamic on the market.
During the analysis stage, feedback from the stakeholder groups would be compared to determine areas of agreement as well as areas of divergence


