
Key Insights
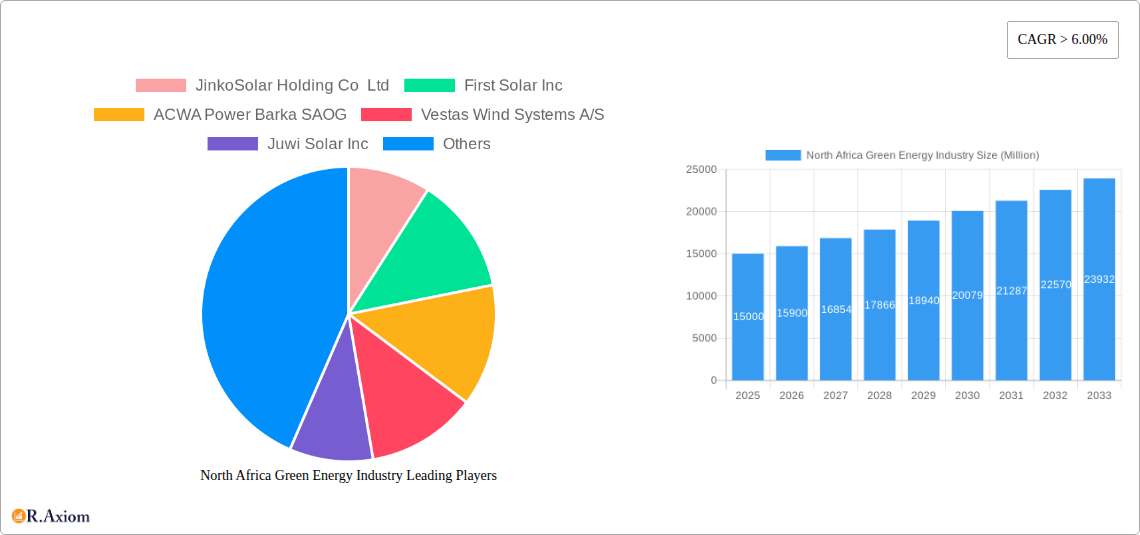
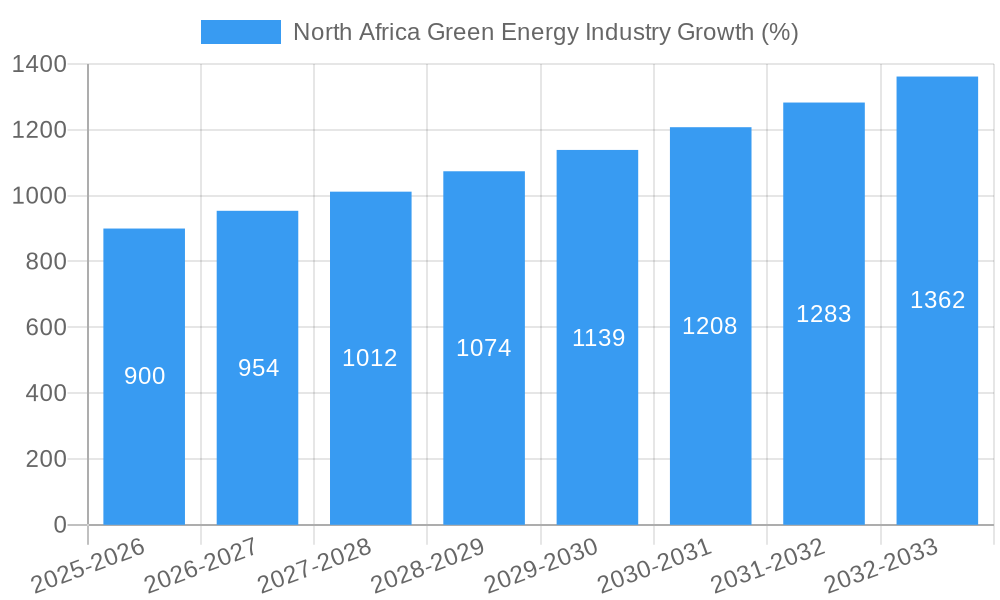
The North African green energy market, encompassing solar, wind, and other renewable sources, is experiencing robust growth, projected to maintain a Compound Annual Growth Rate (CAGR) exceeding 6% from 2025 to 2033. This expansion is driven by several factors. Firstly, the region's abundant solar irradiation and strong wind resources offer significant potential for renewable energy generation. Secondly, governments across North Africa are actively promoting renewable energy adoption through supportive policies, including feed-in tariffs, renewable energy targets, and investment incentives. This policy support is crucial in attracting both domestic and foreign investment, driving project development and capacity expansion. Thirdly, increasing electricity demand and energy security concerns are pushing countries to diversify their energy mix, reducing reliance on fossil fuels and bolstering energy independence. Morocco, Egypt, and Algeria are leading the charge, showcasing substantial investments in large-scale solar and wind farms. However, challenges remain. Infrastructure limitations, particularly in transmission and distribution networks, can hinder the efficient integration of renewable energy into the grid. Furthermore, financing remains a key constraint, particularly for smaller-scale projects, requiring continued public and private investment to overcome this barrier. The market is segmented by technology (solar, wind, others) and geography (Morocco, Egypt, Algeria, and Rest of North Africa). Key players include JinkoSolar, First Solar, ACWA Power, Vestas Wind Systems, Juwi Solar, SkyPower, Siemens Gamesa, Canadian Solar, and Scatec Solar, contributing to the industry’s dynamic landscape.
The market’s growth trajectory is influenced by technological advancements, leading to reduced costs and improved efficiency of renewable energy technologies. The increasing competitiveness of renewable energy compared to fossil fuels further accelerates this growth. However, regulatory uncertainties and potential policy shifts could impact investor confidence and project timelines. Future growth will likely be influenced by the success in addressing the aforementioned challenges. A continuous focus on improving grid infrastructure, enhancing financing options, and fostering regional collaboration will be key in unlocking the region's substantial green energy potential. The market is expected to see increased participation from international developers and investors, spurred by the favorable investment climate and substantial growth opportunities.
North Africa Green Energy Industry: A Comprehensive Market Report (2019-2033)
This comprehensive report provides an in-depth analysis of the North Africa green energy industry, encompassing market size, growth projections, key players, and emerging trends from 2019 to 2033. The report uses 2025 as its base and estimated year, with a forecast period spanning 2025-2033 and a historical period covering 2019-2024. It offers invaluable insights for investors, industry stakeholders, and policymakers seeking to navigate this dynamic sector. The total market size in 2025 is estimated at xx Million USD, projected to reach xx Million USD by 2033, exhibiting a CAGR of xx%.
North Africa Green Energy Industry Market Concentration & Innovation
This section analyzes the competitive landscape, innovation drivers, and regulatory factors shaping the North African green energy market. Market concentration is moderate, with a few large players such as JinkoSolar Holding Co Ltd, First Solar Inc, and ACWA Power Barka SAOG holding significant market share, estimated at xx%, xx%, and xx%, respectively, in 2025. However, the market is also characterized by several smaller, agile companies driving innovation.
- Innovation Drivers: Technological advancements in solar PV, wind turbine technology, and energy storage solutions are key drivers. Government incentives and supportive regulatory frameworks are further accelerating innovation.
- Regulatory Frameworks: Varying regulatory landscapes across North African countries influence investment decisions and project timelines. Harmonization of regulations and streamlined permitting processes are crucial for fostering growth.
- Product Substitutes: Fossil fuels remain a significant competitor, but their decreasing cost-competitiveness and growing environmental concerns are paving the way for renewable energy sources.
- End-User Trends: A growing demand for reliable and affordable electricity, coupled with increasing awareness of climate change, is driving end-user adoption of green energy solutions.
- M&A Activities: The past five years have seen a moderate level of M&A activity, with deal values totaling approximately xx Million USD. These activities reflect consolidation efforts and strategic expansion by larger players.
North Africa Green Energy Industry Industry Trends & Insights
The North African green energy market is experiencing robust growth, driven by several factors. Government support, including subsidies and feed-in tariffs, is attracting substantial investment. The region’s abundant solar and wind resources offer significant potential for renewable energy generation. Furthermore, increasing energy demand and rising electricity prices are fueling the transition to cleaner energy sources. The market penetration of solar PV is currently estimated at xx% in 2025, projected to reach xx% by 2033. Technological disruptions, such as advancements in battery storage and smart grids, are enhancing the efficiency and reliability of renewable energy systems. Consumer preferences are shifting towards sustainable energy solutions, and competitive dynamics are fostering innovation and cost reduction.
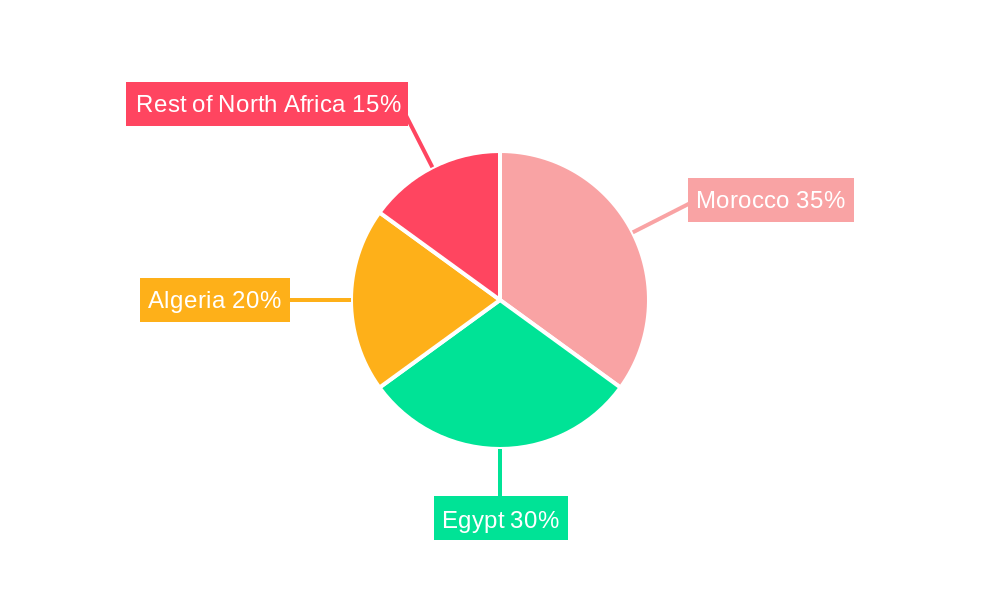
Dominant Markets & Segments in North Africa Green Energy Industry
Morocco currently holds the leading position in the North African green energy market, followed by Egypt and Algeria. The "Rest of North Africa" segment shows significant growth potential.
- Morocco: Strong government support, favorable policies, and significant investments in renewable energy infrastructure have propelled Morocco's dominance.
- Egypt: Egypt's large population and increasing energy demand are driving significant growth in the renewable energy sector. Government initiatives and international collaborations are accelerating development.
- Algeria: Algeria possesses substantial renewable energy resources, and government efforts to diversify its energy mix are fostering growth in this sector.
- Rest of North Africa: This segment encompasses countries like Tunisia, Libya, and Mauritania, each possessing unique opportunities and challenges for renewable energy development. Tunisia's recent projects, like the TuNur initiative, are signaling a significant upward trend.
Segment Dominance: Solar energy currently holds the largest market share, driven by its cost-effectiveness and abundance of solar resources. However, wind energy is also experiencing strong growth, particularly in areas with favorable wind conditions. Other renewable energy sources, such as geothermal and biomass, represent smaller but growing segments.
North Africa Green Energy Industry Product Developments
Recent product innovations include advancements in high-efficiency solar panels, larger-capacity wind turbines, and improved energy storage technologies. These innovations are enhancing the efficiency, reliability, and cost-effectiveness of renewable energy systems. The market is also witnessing the development of hybrid renewable energy projects combining solar and wind power, coupled with energy storage, to ensure a consistent supply of electricity.
Report Scope & Segmentation Analysis
This report segments the North African green energy market by source (Solar, Wind, Others) and geography (Morocco, Egypt, Algeria, Rest of North Africa). Each segment's growth projections, market sizes, and competitive dynamics are analyzed. The Solar segment is projected to maintain a significant market share throughout the forecast period, driven by declining costs and technological advancements. The Wind segment is also expected to demonstrate substantial growth, fueled by increasing demand for clean energy and supportive government policies. The "Others" segment is expected to grow at a slower rate compared to solar and wind. Geographic segmentation provides detailed analysis of each country's market characteristics, including regulatory frameworks, investment attractiveness, and market potential.
Key Drivers of North Africa Green Energy Industry Growth
Several factors are driving the growth of the North African green energy industry. These include government policies promoting renewable energy adoption (e.g., subsidies, feed-in tariffs), abundant solar and wind resources, rising energy demand, and increasing concerns about climate change. International collaborations and investments from multilateral organizations are also playing a crucial role.
Challenges in the North Africa Green Energy Industry Sector
Challenges include grid infrastructure limitations, intermittent nature of renewable energy sources, financing constraints, and lack of skilled workforce. Regulatory uncertainties and political instability in some regions can also hinder investment and project development. The impact of these challenges is estimated to reduce the market growth by approximately xx% in the forecast period.
Emerging Opportunities in North Africa Green Energy Industry
Emerging opportunities include the development of large-scale solar and wind farms, integration of renewable energy with energy storage systems, smart grids, and the growth of off-grid renewable energy solutions. The rising demand for green hydrogen production presents further opportunities in the future.
Leading Players in the North Africa Green Energy Industry Market
- JinkoSolar Holding Co Ltd
- First Solar Inc
- ACWA Power Barka SAOG
- Vestas Wind Systems A/S
- Juwi Solar Inc
- SkyPower Ltd
- Siemens Gamesa Renewable Energy SA
- Canadian Solar Inc
- Scatec Solar ASA
Key Developments in North Africa Green Energy Industry Industry
- December 2022: Xlinks announced plans for a 10.5 GWh solar power plant, signifying significant investment in large-scale renewable energy projects.
- December 2022: TuNur announced plans to generate 4.5 GWh of electricity from a Tunisian solar plant for export to Europe, highlighting the potential for regional energy trade and CO2 emission reduction.
- November 2022: Egypt secured USD 1 Billion in financing for two wind and solar projects, demonstrating the continued influx of investment into the sector and emphasizing the role of international financial institutions in supporting clean energy development.
Strategic Outlook for North Africa Green Energy Industry Market
The North African green energy market is poised for significant growth in the coming years. Continued government support, technological advancements, and increasing private sector investment will drive market expansion. The focus on large-scale projects, regional energy cooperation, and the integration of renewable energy into national grids will shape the sector's future trajectory. The market is expected to see further consolidation through M&A activity and the emergence of new technologies and business models.
North Africa Green Energy Industry Segmentation
-
1. Source
- 1.1. Solar
- 1.2. Wind
- 1.3. Others
-
2. Geogrpahy
- 2.1. Morocco
- 2.2. Egypt
- 2.3. Algeria
- 2.4. Rest of North Africa
North Africa Green Energy Industry Segmentation By Geography
-
1. North America
- 1.1. United States
- 1.2. Canada
- 1.3. Mexico
-
2. South America
- 2.1. Brazil
- 2.2. Argentina
- 2.3. Rest of South America
-
3. Europe
- 3.1. United Kingdom
- 3.2. Germany
- 3.3. France
- 3.4. Italy
- 3.5. Spain
- 3.6. Russia
- 3.7. Benelux
- 3.8. Nordics
- 3.9. Rest of Europe
-
4. Middle East & Africa
- 4.1. Turkey
- 4.2. Israel
- 4.3. GCC
- 4.4. North Africa
- 4.5. South Africa
- 4.6. Rest of Middle East & Africa
-
5. Asia Pacific
- 5.1. China
- 5.2. India
- 5.3. Japan
- 5.4. South Korea
- 5.5. ASEAN
- 5.6. Oceania
- 5.7. Rest of Asia Pacific
North Africa Green Energy Industry REPORT HIGHLIGHTS
| Aspects | Details |
|---|---|
| Study Period | 2019-2033 |
| Base Year | 2024 |
| Estimated Year | 2025 |
| Forecast Period | 2025-2033 |
| Historical Period | 2019-2024 |
| Growth Rate | CAGR of > 6.00% from 2019-2033 |
| Segmentation |
|
Table of Contents
- 1. Introduction
- 1.1. Research Scope
- 1.2. Market Segmentation
- 1.3. Research Methodology
- 1.4. Definitions and Assumptions
- 2. Executive Summary
- 2.1. Introduction
- 3. Market Dynamics
- 3.1. Introduction
- 3.2. Market Drivers
- 3.2.1. 4.; Demand for Solar Photovoltaic Installations4.; Growing Investments
- 3.3. Market Restrains
- 3.3.1. 4.; Increasing Wind Energy Installations
- 3.4. Market Trends
- 3.4.1. Solar Energy is Expected to Dominate the Market
- 4. Market Factor Analysis
- 4.1. Porters Five Forces
- 4.2. Supply/Value Chain
- 4.3. PESTEL analysis
- 4.4. Market Entropy
- 4.5. Patent/Trademark Analysis
- 5. Global North Africa Green Energy Industry Analysis, Insights and Forecast, 2019-2031
- 5.1. Market Analysis, Insights and Forecast - by Source
- 5.1.1. Solar
- 5.1.2. Wind
- 5.1.3. Others
- 5.2. Market Analysis, Insights and Forecast - by Geogrpahy
- 5.2.1. Morocco
- 5.2.2. Egypt
- 5.2.3. Algeria
- 5.2.4. Rest of North Africa
- 5.3. Market Analysis, Insights and Forecast - by Region
- 5.3.1. North America
- 5.3.2. South America
- 5.3.3. Europe
- 5.3.4. Middle East & Africa
- 5.3.5. Asia Pacific
- 5.1. Market Analysis, Insights and Forecast - by Source
- 6. North America North Africa Green Energy Industry Analysis, Insights and Forecast, 2019-2031
- 6.1. Market Analysis, Insights and Forecast - by Source
- 6.1.1. Solar
- 6.1.2. Wind
- 6.1.3. Others
- 6.2. Market Analysis, Insights and Forecast - by Geogrpahy
- 6.2.1. Morocco
- 6.2.2. Egypt
- 6.2.3. Algeria
- 6.2.4. Rest of North Africa
- 6.1. Market Analysis, Insights and Forecast - by Source
- 7. South America North Africa Green Energy Industry Analysis, Insights and Forecast, 2019-2031
- 7.1. Market Analysis, Insights and Forecast - by Source
- 7.1.1. Solar
- 7.1.2. Wind
- 7.1.3. Others
- 7.2. Market Analysis, Insights and Forecast - by Geogrpahy
- 7.2.1. Morocco
- 7.2.2. Egypt
- 7.2.3. Algeria
- 7.2.4. Rest of North Africa
- 7.1. Market Analysis, Insights and Forecast - by Source
- 8. Europe North Africa Green Energy Industry Analysis, Insights and Forecast, 2019-2031
- 8.1. Market Analysis, Insights and Forecast - by Source
- 8.1.1. Solar
- 8.1.2. Wind
- 8.1.3. Others
- 8.2. Market Analysis, Insights and Forecast - by Geogrpahy
- 8.2.1. Morocco
- 8.2.2. Egypt
- 8.2.3. Algeria
- 8.2.4. Rest of North Africa
- 8.1. Market Analysis, Insights and Forecast - by Source
- 9. Middle East & Africa North Africa Green Energy Industry Analysis, Insights and Forecast, 2019-2031
- 9.1. Market Analysis, Insights and Forecast - by Source
- 9.1.1. Solar
- 9.1.2. Wind
- 9.1.3. Others
- 9.2. Market Analysis, Insights and Forecast - by Geogrpahy
- 9.2.1. Morocco
- 9.2.2. Egypt
- 9.2.3. Algeria
- 9.2.4. Rest of North Africa
- 9.1. Market Analysis, Insights and Forecast - by Source
- 10. Asia Pacific North Africa Green Energy Industry Analysis, Insights and Forecast, 2019-2031
- 10.1. Market Analysis, Insights and Forecast - by Source
- 10.1.1. Solar
- 10.1.2. Wind
- 10.1.3. Others
- 10.2. Market Analysis, Insights and Forecast - by Geogrpahy
- 10.2.1. Morocco
- 10.2.2. Egypt
- 10.2.3. Algeria
- 10.2.4. Rest of North Africa
- 10.1. Market Analysis, Insights and Forecast - by Source
- 11. South Africa North Africa Green Energy Industry Analysis, Insights and Forecast, 2019-2031
- 12. Sudan North Africa Green Energy Industry Analysis, Insights and Forecast, 2019-2031
- 13. Uganda North Africa Green Energy Industry Analysis, Insights and Forecast, 2019-2031
- 14. Tanzania North Africa Green Energy Industry Analysis, Insights and Forecast, 2019-2031
- 15. Kenya North Africa Green Energy Industry Analysis, Insights and Forecast, 2019-2031
- 16. Rest of Africa North Africa Green Energy Industry Analysis, Insights and Forecast, 2019-2031
- 17. Competitive Analysis
- 17.1. Global Market Share Analysis 2024
- 17.2. Company Profiles
- 17.2.1 JinkoSolar Holding Co Ltd
- 17.2.1.1. Overview
- 17.2.1.2. Products
- 17.2.1.3. SWOT Analysis
- 17.2.1.4. Recent Developments
- 17.2.1.5. Financials (Based on Availability)
- 17.2.2 First Solar Inc
- 17.2.2.1. Overview
- 17.2.2.2. Products
- 17.2.2.3. SWOT Analysis
- 17.2.2.4. Recent Developments
- 17.2.2.5. Financials (Based on Availability)
- 17.2.3 ACWA Power Barka SAOG
- 17.2.3.1. Overview
- 17.2.3.2. Products
- 17.2.3.3. SWOT Analysis
- 17.2.3.4. Recent Developments
- 17.2.3.5. Financials (Based on Availability)
- 17.2.4 Vestas Wind Systems A/S
- 17.2.4.1. Overview
- 17.2.4.2. Products
- 17.2.4.3. SWOT Analysis
- 17.2.4.4. Recent Developments
- 17.2.4.5. Financials (Based on Availability)
- 17.2.5 Juwi Solar Inc
- 17.2.5.1. Overview
- 17.2.5.2. Products
- 17.2.5.3. SWOT Analysis
- 17.2.5.4. Recent Developments
- 17.2.5.5. Financials (Based on Availability)
- 17.2.6 SkyPower Ltd
- 17.2.6.1. Overview
- 17.2.6.2. Products
- 17.2.6.3. SWOT Analysis
- 17.2.6.4. Recent Developments
- 17.2.6.5. Financials (Based on Availability)
- 17.2.7 Siemens Gamesa Renewable Energy SA
- 17.2.7.1. Overview
- 17.2.7.2. Products
- 17.2.7.3. SWOT Analysis
- 17.2.7.4. Recent Developments
- 17.2.7.5. Financials (Based on Availability)
- 17.2.8 Canadian Solar Inc
- 17.2.8.1. Overview
- 17.2.8.2. Products
- 17.2.8.3. SWOT Analysis
- 17.2.8.4. Recent Developments
- 17.2.8.5. Financials (Based on Availability)
- 17.2.9 Scatec Solar ASA
- 17.2.9.1. Overview
- 17.2.9.2. Products
- 17.2.9.3. SWOT Analysis
- 17.2.9.4. Recent Developments
- 17.2.9.5. Financials (Based on Availability)
- 17.2.1 JinkoSolar Holding Co Ltd
List of Figures
- Figure 1: Global North Africa Green Energy Industry Revenue Breakdown (Million, %) by Region 2024 & 2032
- Figure 2: Global North Africa Green Energy Industry Volume Breakdown (Gigawatte, %) by Region 2024 & 2032
- Figure 3: Africa North Africa Green Energy Industry Revenue (Million), by Country 2024 & 2032
- Figure 4: Africa North Africa Green Energy Industry Volume (Gigawatte), by Country 2024 & 2032
- Figure 5: Africa North Africa Green Energy Industry Revenue Share (%), by Country 2024 & 2032
- Figure 6: Africa North Africa Green Energy Industry Volume Share (%), by Country 2024 & 2032
- Figure 7: North America North Africa Green Energy Industry Revenue (Million), by Source 2024 & 2032
- Figure 8: North America North Africa Green Energy Industry Volume (Gigawatte), by Source 2024 & 2032
- Figure 9: North America North Africa Green Energy Industry Revenue Share (%), by Source 2024 & 2032
- Figure 10: North America North Africa Green Energy Industry Volume Share (%), by Source 2024 & 2032
- Figure 11: North America North Africa Green Energy Industry Revenue (Million), by Geogrpahy 2024 & 2032
- Figure 12: North America North Africa Green Energy Industry Volume (Gigawatte), by Geogrpahy 2024 & 2032
- Figure 13: North America North Africa Green Energy Industry Revenue Share (%), by Geogrpahy 2024 & 2032
- Figure 14: North America North Africa Green Energy Industry Volume Share (%), by Geogrpahy 2024 & 2032
- Figure 15: North America North Africa Green Energy Industry Revenue (Million), by Country 2024 & 2032
- Figure 16: North America North Africa Green Energy Industry Volume (Gigawatte), by Country 2024 & 2032
- Figure 17: North America North Africa Green Energy Industry Revenue Share (%), by Country 2024 & 2032
- Figure 18: North America North Africa Green Energy Industry Volume Share (%), by Country 2024 & 2032
- Figure 19: South America North Africa Green Energy Industry Revenue (Million), by Source 2024 & 2032
- Figure 20: South America North Africa Green Energy Industry Volume (Gigawatte), by Source 2024 & 2032
- Figure 21: South America North Africa Green Energy Industry Revenue Share (%), by Source 2024 & 2032
- Figure 22: South America North Africa Green Energy Industry Volume Share (%), by Source 2024 & 2032
- Figure 23: South America North Africa Green Energy Industry Revenue (Million), by Geogrpahy 2024 & 2032
- Figure 24: South America North Africa Green Energy Industry Volume (Gigawatte), by Geogrpahy 2024 & 2032
- Figure 25: South America North Africa Green Energy Industry Revenue Share (%), by Geogrpahy 2024 & 2032
- Figure 26: South America North Africa Green Energy Industry Volume Share (%), by Geogrpahy 2024 & 2032
- Figure 27: South America North Africa Green Energy Industry Revenue (Million), by Country 2024 & 2032
- Figure 28: South America North Africa Green Energy Industry Volume (Gigawatte), by Country 2024 & 2032
- Figure 29: South America North Africa Green Energy Industry Revenue Share (%), by Country 2024 & 2032
- Figure 30: South America North Africa Green Energy Industry Volume Share (%), by Country 2024 & 2032
- Figure 31: Europe North Africa Green Energy Industry Revenue (Million), by Source 2024 & 2032
- Figure 32: Europe North Africa Green Energy Industry Volume (Gigawatte), by Source 2024 & 2032
- Figure 33: Europe North Africa Green Energy Industry Revenue Share (%), by Source 2024 & 2032
- Figure 34: Europe North Africa Green Energy Industry Volume Share (%), by Source 2024 & 2032
- Figure 35: Europe North Africa Green Energy Industry Revenue (Million), by Geogrpahy 2024 & 2032
- Figure 36: Europe North Africa Green Energy Industry Volume (Gigawatte), by Geogrpahy 2024 & 2032
- Figure 37: Europe North Africa Green Energy Industry Revenue Share (%), by Geogrpahy 2024 & 2032
- Figure 38: Europe North Africa Green Energy Industry Volume Share (%), by Geogrpahy 2024 & 2032
- Figure 39: Europe North Africa Green Energy Industry Revenue (Million), by Country 2024 & 2032
- Figure 40: Europe North Africa Green Energy Industry Volume (Gigawatte), by Country 2024 & 2032
- Figure 41: Europe North Africa Green Energy Industry Revenue Share (%), by Country 2024 & 2032
- Figure 42: Europe North Africa Green Energy Industry Volume Share (%), by Country 2024 & 2032
- Figure 43: Middle East & Africa North Africa Green Energy Industry Revenue (Million), by Source 2024 & 2032
- Figure 44: Middle East & Africa North Africa Green Energy Industry Volume (Gigawatte), by Source 2024 & 2032
- Figure 45: Middle East & Africa North Africa Green Energy Industry Revenue Share (%), by Source 2024 & 2032
- Figure 46: Middle East & Africa North Africa Green Energy Industry Volume Share (%), by Source 2024 & 2032
- Figure 47: Middle East & Africa North Africa Green Energy Industry Revenue (Million), by Geogrpahy 2024 & 2032
- Figure 48: Middle East & Africa North Africa Green Energy Industry Volume (Gigawatte), by Geogrpahy 2024 & 2032
- Figure 49: Middle East & Africa North Africa Green Energy Industry Revenue Share (%), by Geogrpahy 2024 & 2032
- Figure 50: Middle East & Africa North Africa Green Energy Industry Volume Share (%), by Geogrpahy 2024 & 2032
- Figure 51: Middle East & Africa North Africa Green Energy Industry Revenue (Million), by Country 2024 & 2032
- Figure 52: Middle East & Africa North Africa Green Energy Industry Volume (Gigawatte), by Country 2024 & 2032
- Figure 53: Middle East & Africa North Africa Green Energy Industry Revenue Share (%), by Country 2024 & 2032
- Figure 54: Middle East & Africa North Africa Green Energy Industry Volume Share (%), by Country 2024 & 2032
- Figure 55: Asia Pacific North Africa Green Energy Industry Revenue (Million), by Source 2024 & 2032
- Figure 56: Asia Pacific North Africa Green Energy Industry Volume (Gigawatte), by Source 2024 & 2032
- Figure 57: Asia Pacific North Africa Green Energy Industry Revenue Share (%), by Source 2024 & 2032
- Figure 58: Asia Pacific North Africa Green Energy Industry Volume Share (%), by Source 2024 & 2032
- Figure 59: Asia Pacific North Africa Green Energy Industry Revenue (Million), by Geogrpahy 2024 & 2032
- Figure 60: Asia Pacific North Africa Green Energy Industry Volume (Gigawatte), by Geogrpahy 2024 & 2032
- Figure 61: Asia Pacific North Africa Green Energy Industry Revenue Share (%), by Geogrpahy 2024 & 2032
- Figure 62: Asia Pacific North Africa Green Energy Industry Volume Share (%), by Geogrpahy 2024 & 2032
- Figure 63: Asia Pacific North Africa Green Energy Industry Revenue (Million), by Country 2024 & 2032
- Figure 64: Asia Pacific North Africa Green Energy Industry Volume (Gigawatte), by Country 2024 & 2032
- Figure 65: Asia Pacific North Africa Green Energy Industry Revenue Share (%), by Country 2024 & 2032
- Figure 66: Asia Pacific North Africa Green Energy Industry Volume Share (%), by Country 2024 & 2032
List of Tables
- Table 1: Global North Africa Green Energy Industry Revenue Million Forecast, by Region 2019 & 2032
- Table 2: Global North Africa Green Energy Industry Volume Gigawatte Forecast, by Region 2019 & 2032
- Table 3: Global North Africa Green Energy Industry Revenue Million Forecast, by Source 2019 & 2032
- Table 4: Global North Africa Green Energy Industry Volume Gigawatte Forecast, by Source 2019 & 2032
- Table 5: Global North Africa Green Energy Industry Revenue Million Forecast, by Geogrpahy 2019 & 2032
- Table 6: Global North Africa Green Energy Industry Volume Gigawatte Forecast, by Geogrpahy 2019 & 2032
- Table 7: Global North Africa Green Energy Industry Revenue Million Forecast, by Region 2019 & 2032
- Table 8: Global North Africa Green Energy Industry Volume Gigawatte Forecast, by Region 2019 & 2032
- Table 9: Global North Africa Green Energy Industry Revenue Million Forecast, by Country 2019 & 2032
- Table 10: Global North Africa Green Energy Industry Volume Gigawatte Forecast, by Country 2019 & 2032
- Table 11: South Africa North Africa Green Energy Industry Revenue (Million) Forecast, by Application 2019 & 2032
- Table 12: South Africa North Africa Green Energy Industry Volume (Gigawatte) Forecast, by Application 2019 & 2032
- Table 13: Sudan North Africa Green Energy Industry Revenue (Million) Forecast, by Application 2019 & 2032
- Table 14: Sudan North Africa Green Energy Industry Volume (Gigawatte) Forecast, by Application 2019 & 2032
- Table 15: Uganda North Africa Green Energy Industry Revenue (Million) Forecast, by Application 2019 & 2032
- Table 16: Uganda North Africa Green Energy Industry Volume (Gigawatte) Forecast, by Application 2019 & 2032
- Table 17: Tanzania North Africa Green Energy Industry Revenue (Million) Forecast, by Application 2019 & 2032
- Table 18: Tanzania North Africa Green Energy Industry Volume (Gigawatte) Forecast, by Application 2019 & 2032
- Table 19: Kenya North Africa Green Energy Industry Revenue (Million) Forecast, by Application 2019 & 2032
- Table 20: Kenya North Africa Green Energy Industry Volume (Gigawatte) Forecast, by Application 2019 & 2032
- Table 21: Rest of Africa North Africa Green Energy Industry Revenue (Million) Forecast, by Application 2019 & 2032
- Table 22: Rest of Africa North Africa Green Energy Industry Volume (Gigawatte) Forecast, by Application 2019 & 2032
- Table 23: Global North Africa Green Energy Industry Revenue Million Forecast, by Source 2019 & 2032
- Table 24: Global North Africa Green Energy Industry Volume Gigawatte Forecast, by Source 2019 & 2032
- Table 25: Global North Africa Green Energy Industry Revenue Million Forecast, by Geogrpahy 2019 & 2032
- Table 26: Global North Africa Green Energy Industry Volume Gigawatte Forecast, by Geogrpahy 2019 & 2032
- Table 27: Global North Africa Green Energy Industry Revenue Million Forecast, by Country 2019 & 2032
- Table 28: Global North Africa Green Energy Industry Volume Gigawatte Forecast, by Country 2019 & 2032
- Table 29: United States North Africa Green Energy Industry Revenue (Million) Forecast, by Application 2019 & 2032
- Table 30: United States North Africa Green Energy Industry Volume (Gigawatte) Forecast, by Application 2019 & 2032
- Table 31: Canada North Africa Green Energy Industry Revenue (Million) Forecast, by Application 2019 & 2032
- Table 32: Canada North Africa Green Energy Industry Volume (Gigawatte) Forecast, by Application 2019 & 2032
- Table 33: Mexico North Africa Green Energy Industry Revenue (Million) Forecast, by Application 2019 & 2032
- Table 34: Mexico North Africa Green Energy Industry Volume (Gigawatte) Forecast, by Application 2019 & 2032
- Table 35: Global North Africa Green Energy Industry Revenue Million Forecast, by Source 2019 & 2032
- Table 36: Global North Africa Green Energy Industry Volume Gigawatte Forecast, by Source 2019 & 2032
- Table 37: Global North Africa Green Energy Industry Revenue Million Forecast, by Geogrpahy 2019 & 2032
- Table 38: Global North Africa Green Energy Industry Volume Gigawatte Forecast, by Geogrpahy 2019 & 2032
- Table 39: Global North Africa Green Energy Industry Revenue Million Forecast, by Country 2019 & 2032
- Table 40: Global North Africa Green Energy Industry Volume Gigawatte Forecast, by Country 2019 & 2032
- Table 41: Brazil North Africa Green Energy Industry Revenue (Million) Forecast, by Application 2019 & 2032
- Table 42: Brazil North Africa Green Energy Industry Volume (Gigawatte) Forecast, by Application 2019 & 2032
- Table 43: Argentina North Africa Green Energy Industry Revenue (Million) Forecast, by Application 2019 & 2032
- Table 44: Argentina North Africa Green Energy Industry Volume (Gigawatte) Forecast, by Application 2019 & 2032
- Table 45: Rest of South America North Africa Green Energy Industry Revenue (Million) Forecast, by Application 2019 & 2032
- Table 46: Rest of South America North Africa Green Energy Industry Volume (Gigawatte) Forecast, by Application 2019 & 2032
- Table 47: Global North Africa Green Energy Industry Revenue Million Forecast, by Source 2019 & 2032
- Table 48: Global North Africa Green Energy Industry Volume Gigawatte Forecast, by Source 2019 & 2032
- Table 49: Global North Africa Green Energy Industry Revenue Million Forecast, by Geogrpahy 2019 & 2032
- Table 50: Global North Africa Green Energy Industry Volume Gigawatte Forecast, by Geogrpahy 2019 & 2032
- Table 51: Global North Africa Green Energy Industry Revenue Million Forecast, by Country 2019 & 2032
- Table 52: Global North Africa Green Energy Industry Volume Gigawatte Forecast, by Country 2019 & 2032
- Table 53: United Kingdom North Africa Green Energy Industry Revenue (Million) Forecast, by Application 2019 & 2032
- Table 54: United Kingdom North Africa Green Energy Industry Volume (Gigawatte) Forecast, by Application 2019 & 2032
- Table 55: Germany North Africa Green Energy Industry Revenue (Million) Forecast, by Application 2019 & 2032
- Table 56: Germany North Africa Green Energy Industry Volume (Gigawatte) Forecast, by Application 2019 & 2032
- Table 57: France North Africa Green Energy Industry Revenue (Million) Forecast, by Application 2019 & 2032
- Table 58: France North Africa Green Energy Industry Volume (Gigawatte) Forecast, by Application 2019 & 2032
- Table 59: Italy North Africa Green Energy Industry Revenue (Million) Forecast, by Application 2019 & 2032
- Table 60: Italy North Africa Green Energy Industry Volume (Gigawatte) Forecast, by Application 2019 & 2032
- Table 61: Spain North Africa Green Energy Industry Revenue (Million) Forecast, by Application 2019 & 2032
- Table 62: Spain North Africa Green Energy Industry Volume (Gigawatte) Forecast, by Application 2019 & 2032
- Table 63: Russia North Africa Green Energy Industry Revenue (Million) Forecast, by Application 2019 & 2032
- Table 64: Russia North Africa Green Energy Industry Volume (Gigawatte) Forecast, by Application 2019 & 2032
- Table 65: Benelux North Africa Green Energy Industry Revenue (Million) Forecast, by Application 2019 & 2032
- Table 66: Benelux North Africa Green Energy Industry Volume (Gigawatte) Forecast, by Application 2019 & 2032
- Table 67: Nordics North Africa Green Energy Industry Revenue (Million) Forecast, by Application 2019 & 2032
- Table 68: Nordics North Africa Green Energy Industry Volume (Gigawatte) Forecast, by Application 2019 & 2032
- Table 69: Rest of Europe North Africa Green Energy Industry Revenue (Million) Forecast, by Application 2019 & 2032
- Table 70: Rest of Europe North Africa Green Energy Industry Volume (Gigawatte) Forecast, by Application 2019 & 2032
- Table 71: Global North Africa Green Energy Industry Revenue Million Forecast, by Source 2019 & 2032
- Table 72: Global North Africa Green Energy Industry Volume Gigawatte Forecast, by Source 2019 & 2032
- Table 73: Global North Africa Green Energy Industry Revenue Million Forecast, by Geogrpahy 2019 & 2032
- Table 74: Global North Africa Green Energy Industry Volume Gigawatte Forecast, by Geogrpahy 2019 & 2032
- Table 75: Global North Africa Green Energy Industry Revenue Million Forecast, by Country 2019 & 2032
- Table 76: Global North Africa Green Energy Industry Volume Gigawatte Forecast, by Country 2019 & 2032
- Table 77: Turkey North Africa Green Energy Industry Revenue (Million) Forecast, by Application 2019 & 2032
- Table 78: Turkey North Africa Green Energy Industry Volume (Gigawatte) Forecast, by Application 2019 & 2032
- Table 79: Israel North Africa Green Energy Industry Revenue (Million) Forecast, by Application 2019 & 2032
- Table 80: Israel North Africa Green Energy Industry Volume (Gigawatte) Forecast, by Application 2019 & 2032
- Table 81: GCC North Africa Green Energy Industry Revenue (Million) Forecast, by Application 2019 & 2032
- Table 82: GCC North Africa Green Energy Industry Volume (Gigawatte) Forecast, by Application 2019 & 2032
- Table 83: North Africa North Africa Green Energy Industry Revenue (Million) Forecast, by Application 2019 & 2032
- Table 84: North Africa North Africa Green Energy Industry Volume (Gigawatte) Forecast, by Application 2019 & 2032
- Table 85: South Africa North Africa Green Energy Industry Revenue (Million) Forecast, by Application 2019 & 2032
- Table 86: South Africa North Africa Green Energy Industry Volume (Gigawatte) Forecast, by Application 2019 & 2032
- Table 87: Rest of Middle East & Africa North Africa Green Energy Industry Revenue (Million) Forecast, by Application 2019 & 2032
- Table 88: Rest of Middle East & Africa North Africa Green Energy Industry Volume (Gigawatte) Forecast, by Application 2019 & 2032
- Table 89: Global North Africa Green Energy Industry Revenue Million Forecast, by Source 2019 & 2032
- Table 90: Global North Africa Green Energy Industry Volume Gigawatte Forecast, by Source 2019 & 2032
- Table 91: Global North Africa Green Energy Industry Revenue Million Forecast, by Geogrpahy 2019 & 2032
- Table 92: Global North Africa Green Energy Industry Volume Gigawatte Forecast, by Geogrpahy 2019 & 2032
- Table 93: Global North Africa Green Energy Industry Revenue Million Forecast, by Country 2019 & 2032
- Table 94: Global North Africa Green Energy Industry Volume Gigawatte Forecast, by Country 2019 & 2032
- Table 95: China North Africa Green Energy Industry Revenue (Million) Forecast, by Application 2019 & 2032
- Table 96: China North Africa Green Energy Industry Volume (Gigawatte) Forecast, by Application 2019 & 2032
- Table 97: India North Africa Green Energy Industry Revenue (Million) Forecast, by Application 2019 & 2032
- Table 98: India North Africa Green Energy Industry Volume (Gigawatte) Forecast, by Application 2019 & 2032
- Table 99: Japan North Africa Green Energy Industry Revenue (Million) Forecast, by Application 2019 & 2032
- Table 100: Japan North Africa Green Energy Industry Volume (Gigawatte) Forecast, by Application 2019 & 2032
- Table 101: South Korea North Africa Green Energy Industry Revenue (Million) Forecast, by Application 2019 & 2032
- Table 102: South Korea North Africa Green Energy Industry Volume (Gigawatte) Forecast, by Application 2019 & 2032
- Table 103: ASEAN North Africa Green Energy Industry Revenue (Million) Forecast, by Application 2019 & 2032
- Table 104: ASEAN North Africa Green Energy Industry Volume (Gigawatte) Forecast, by Application 2019 & 2032
- Table 105: Oceania North Africa Green Energy Industry Revenue (Million) Forecast, by Application 2019 & 2032
- Table 106: Oceania North Africa Green Energy Industry Volume (Gigawatte) Forecast, by Application 2019 & 2032
- Table 107: Rest of Asia Pacific North Africa Green Energy Industry Revenue (Million) Forecast, by Application 2019 & 2032
- Table 108: Rest of Asia Pacific North Africa Green Energy Industry Volume (Gigawatte) Forecast, by Application 2019 & 2032
Frequently Asked Questions
1. What is the projected Compound Annual Growth Rate (CAGR) of the North Africa Green Energy Industry?
The projected CAGR is approximately > 6.00%.
2. Which companies are prominent players in the North Africa Green Energy Industry?
Key companies in the market include JinkoSolar Holding Co Ltd, First Solar Inc, ACWA Power Barka SAOG, Vestas Wind Systems A/S, Juwi Solar Inc, SkyPower Ltd, Siemens Gamesa Renewable Energy SA, Canadian Solar Inc, Scatec Solar ASA.
3. What are the main segments of the North Africa Green Energy Industry?
The market segments include Source, Geogrpahy.
4. Can you provide details about the market size?
The market size is estimated to be USD XX Million as of 2022.
5. What are some drivers contributing to market growth?
4.; Demand for Solar Photovoltaic Installations4.; Growing Investments.
6. What are the notable trends driving market growth?
Solar Energy is Expected to Dominate the Market.
7. Are there any restraints impacting market growth?
4.; Increasing Wind Energy Installations.
8. Can you provide examples of recent developments in the market?
December 2022: a British company, Xlinks, has announced the installation of a 10.5 GWh solar power plant. Similarly, TuNur, a renewable energy developer, announced its plans to generate 4.5 GWh of electricity from a solar power plant in Tunisia and export it to export to Italy, France, and Malta with an aim to reduce European CO emissions.
9. What pricing options are available for accessing the report?
Pricing options include single-user, multi-user, and enterprise licenses priced at USD 4750, USD 5250, and USD 8750 respectively.
10. Is the market size provided in terms of value or volume?
The market size is provided in terms of value, measured in Million and volume, measured in Gigawatte.
11. Are there any specific market keywords associated with the report?
Yes, the market keyword associated with the report is "North Africa Green Energy Industry," which aids in identifying and referencing the specific market segment covered.
12. How do I determine which pricing option suits my needs best?
The pricing options vary based on user requirements and access needs. Individual users may opt for single-user licenses, while businesses requiring broader access may choose multi-user or enterprise licenses for cost-effective access to the report.
13. Are there any additional resources or data provided in the North Africa Green Energy Industry report?
While the report offers comprehensive insights, it's advisable to review the specific contents or supplementary materials provided to ascertain if additional resources or data are available.
14. How can I stay updated on further developments or reports in the North Africa Green Energy Industry?
To stay informed about further developments, trends, and reports in the North Africa Green Energy Industry, consider subscribing to industry newsletters, following relevant companies and organizations, or regularly checking reputable industry news sources and publications.
Methodology
Step 1 - Identification of Relevant Samples Size from Population Database


Step 2 - Approaches for Defining Global Market Size (Value, Volume* & Price*)

Note*: In applicable scenarios
Step 3 - Data Sources
Primary Research
- Web Analytics
- Survey Reports
- Research Institute
- Latest Research Reports
- Opinion Leaders
Secondary Research
- Annual Reports
- White Paper
- Latest Press Release
- Industry Association
- Paid Database
- Investor Presentations

Step 4 - Data Triangulation
Involves using different sources of information in order to increase the validity of a study
These sources are likely to be stakeholders in a program - participants, other researchers, program staff, other community members, and so on.
Then we put all data in single framework & apply various statistical tools to find out the dynamic on the market.
During the analysis stage, feedback from the stakeholder groups would be compared to determine areas of agreement as well as areas of divergence


