
Key Insights
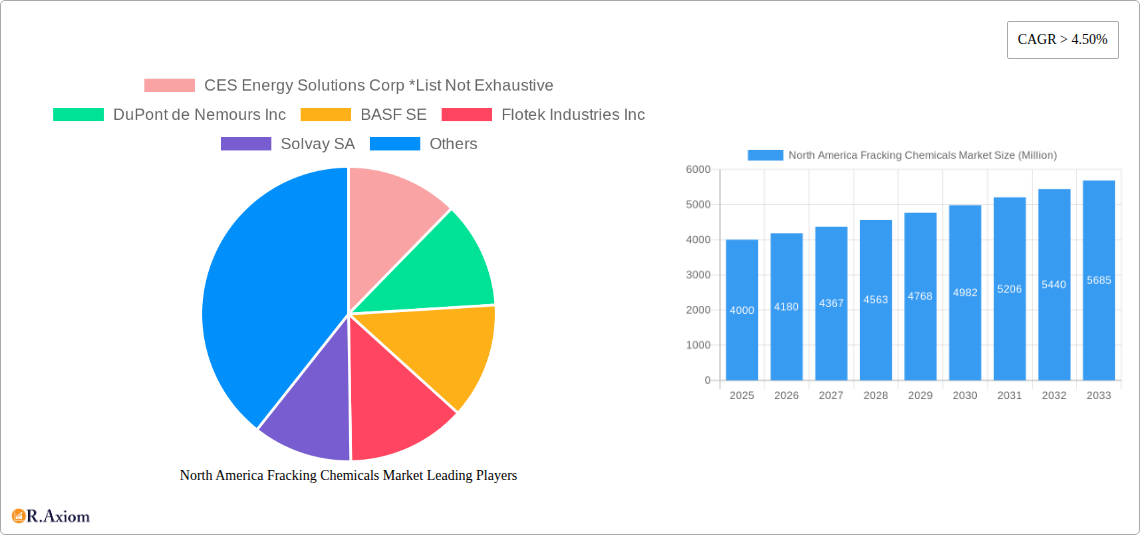
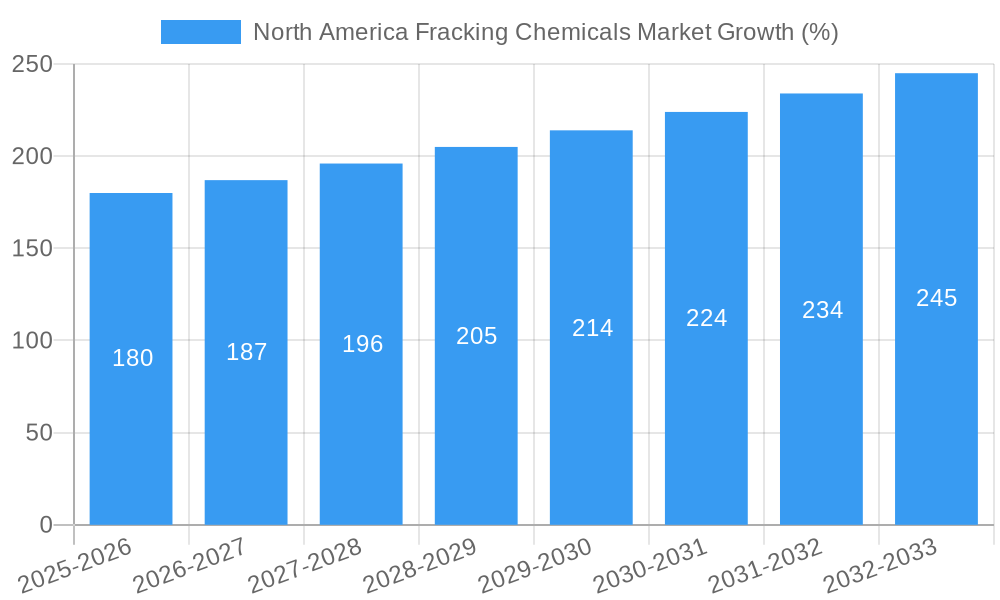
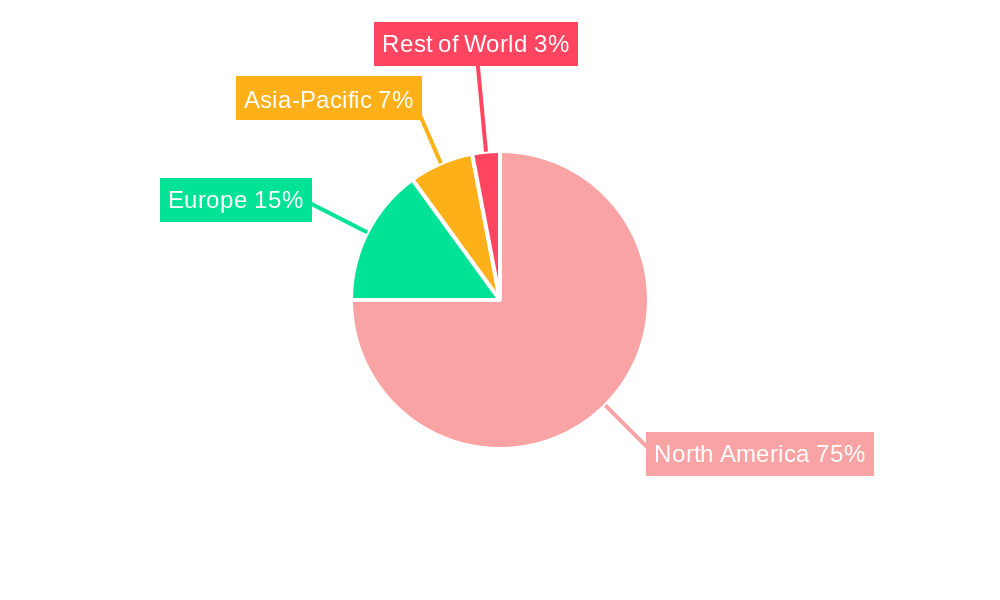
The North America fracking chemicals market, valued at approximately $4 billion in 2025, is projected to experience robust growth, with a Compound Annual Growth Rate (CAGR) exceeding 4.5% from 2025 to 2033. This expansion is primarily driven by the increasing demand for shale gas and oil extraction in the region, fueled by sustained energy consumption and government initiatives supporting domestic energy production. Significant technological advancements in hydraulic fracturing techniques, leading to improved efficiency and reduced water usage, further contribute to market growth. The market is segmented by fluid type (water-based, foam-based, and other fluid types) and well type (vertical, horizontal, and directional), with horizontal and directional wells dominating due to their higher yield. Growth is also influenced by the increasing adoption of environmentally friendly chemicals and stricter regulations regarding chemical composition, pushing manufacturers toward innovation in sustainable solutions. Competition is intense, with major players like Halliburton, Schlumberger, and Dow Chemical competing alongside specialized chemical suppliers. The United States constitutes the largest share of the North American market, followed by Canada and Mexico.
However, several factors restrain market growth. Fluctuations in oil and gas prices directly impact investment in fracking operations, creating uncertainty in the market. Environmental concerns surrounding fracking's impact on water resources and the potential for groundwater contamination pose a significant challenge. Stringent environmental regulations and increasing scrutiny from environmental agencies can lead to higher operational costs and potentially limit the use of certain chemicals. Further, the development and adoption of alternative energy sources could potentially moderate the long-term growth trajectory of the fracking chemicals market. Despite these constraints, the continued demand for energy and the ongoing exploration and extraction of shale resources in North America are expected to maintain a positive growth outlook for the foreseeable future.
This comprehensive report provides a detailed analysis of the North America fracking chemicals market, offering in-depth insights into market dynamics, competitive landscape, and future growth prospects. The study covers the period from 2019 to 2033, with a base year of 2025 and a forecast period spanning 2025-2033. The report utilizes a robust methodology, combining primary and secondary research to provide accurate and reliable data. It's an invaluable resource for industry stakeholders, investors, and researchers seeking a comprehensive understanding of this dynamic market.
North America Fracking Chemicals Market Market Concentration & Innovation
This section analyzes the market concentration, innovation drivers, regulatory frameworks, product substitutes, end-user trends, and M&A activities within the North American fracking chemicals market. The market exhibits a moderately concentrated structure, with a few major players holding significant market share. However, the presence of numerous smaller companies contributes to competitive intensity. Innovation is a key driver, with companies constantly developing new chemicals to improve efficiency, reduce environmental impact, and enhance well productivity. Stringent regulatory frameworks governing chemical usage and environmental protection influence market dynamics. The market witnesses ongoing M&A activity, with larger companies acquiring smaller ones to expand their product portfolios and market reach. For example, the acquisition of Ascend Performance Materials' fracking chemicals business by SNF Group in 2020 illustrates this trend. Market share data for key players will be detailed within the full report. Estimated M&A deal values in the period 2019-2024 totalled approximately $xx Million. Further analysis includes exploring the impact of alternative technologies and emerging substitutes on market growth. The evolving preferences of end-users, particularly towards environmentally friendly solutions, significantly shape product development and market strategies.
North America Fracking Chemicals Market Industry Trends & Insights
This section delves into the key industry trends and insights shaping the North American fracking chemicals market. Market growth is primarily driven by increasing shale gas and oil production, coupled with technological advancements leading to improved efficiency and reduced environmental footprint of fracking operations. The market has experienced a CAGR of xx% during the historical period (2019-2024), and this trend is projected to continue, albeit at a potentially moderated pace, during the forecast period (2025-2033). The market penetration of advanced fracking chemicals, such as those designed to improve well productivity and reduce water usage, is increasing steadily. Technological disruptions, such as the introduction of digital platforms for real-time data analysis and optimization, are transforming industry practices. Competitive dynamics are characterized by intense rivalry among established players and emerging entrants, resulting in continuous innovation and price competition.
Dominant Markets & Segments in North America Fracking Chemicals Market
This section identifies the dominant regions, countries, and segments within the North American fracking chemicals market. The analysis focuses on fluid type (water-based, foam-based, other fluid types) and well type (vertical, horizontal or directional).
Fluid Type: Water-based fluids currently dominate the market due to their cost-effectiveness and widespread use. However, foam-based fluids are gaining traction owing to their enhanced efficiency and reduced environmental impact. The "other fluid types" segment represents a niche market with specialized applications.
Well Type: Horizontal and directional wells account for the largest market share, driven by the increasing prevalence of shale gas and tight oil extraction. Vertical wells remain a significant segment, primarily in conventional oil and gas production.
Key Drivers: Economic policies supporting energy production, and robust infrastructure facilitating transportation and logistics, significantly contribute to market growth in key regions like Texas and Pennsylvania. The full report details the dominant regions and provides a comprehensive dominance analysis for each segment, considering factors like regulatory environment, resource availability, and technological advancements.
North America Fracking Chemicals Market Product Developments
Recent product innovations focus on enhancing well productivity, reducing environmental impact, and optimizing operational efficiency. New high-performance chemicals are being developed to improve the effectiveness of fracturing fluids, reduce water usage, and minimize the risk of formation damage. The incorporation of nanotechnology and other advanced materials improves the performance of fracturing fluids and reduces their environmental footprint. This aligns with growing industry demand for sustainable and environmentally responsible fracking solutions.
Report Scope & Segmentation Analysis
This report segments the North American fracking chemicals market based on fluid type (water-based, foam-based, other fluid types) and well type (vertical, horizontal or directional). Each segment's growth projections, market size estimates (in Million), and competitive dynamics are thoroughly analyzed. Market size for Water-based fluids is estimated to be $xx Million in 2025. The Foam-based segment is projected to grow at a CAGR of xx% during the forecast period. The Horizontal well type is dominant, representing a significant portion of the market.
Key Drivers of North America Fracking Chemicals Market Growth
The growth of the North American fracking chemicals market is propelled by several key drivers. These include:
- Increased shale gas and oil production: The ongoing expansion of shale gas and tight oil extraction activities fuels demand for fracking chemicals.
- Technological advancements: Innovations in chemical formulations and delivery systems enhance efficiency and reduce environmental impact.
- Favorable government policies: Supportive regulatory frameworks and policies encourage exploration and production.
Challenges in the North America Fracking Chemicals Market Sector
The North American fracking chemicals market faces several challenges:
- Stringent environmental regulations: Increasingly strict regulations regarding water usage and chemical disposal impose operational constraints.
- Fluctuations in oil and gas prices: Price volatility in the energy sector influences investment decisions and market demand.
- Competition: Intense competition among established players and new entrants puts downward pressure on prices.
Emerging Opportunities in North America Fracking Chemicals Market
Several opportunities exist for growth and innovation within the market:
- Development of environmentally friendly chemicals: The demand for sustainable and less harmful chemicals presents significant opportunities for innovation.
- Expansion into new geographic regions: Exploration and production in previously untapped areas create new market potential.
- Integration of digital technologies: The use of data analytics and automation enhances efficiency and reduces costs.
Leading Players in the North America Fracking Chemicals Market Market
- CES Energy Solutions Corp
- DuPont de Nemours Inc
- BASF SE
- Flotek Industries Inc
- Solvay SA
- Parchem Fine & Specialty Chemicals Inc
- Halliburton Company
- Dow Chemical Company
- SNF Group
- Schlumberger Limited
Key Developments in North America Fracking Chemicals Market Industry
- 2022: Halliburton Company launched Halliburton Evolve, a digital platform for optimizing fracking operations.
- 2021: Dow Chemical Company introduced a new line of high-performance fracking chemicals with improved well productivity and reduced environmental impact.
- 2020: SNF Group acquired Ascend Performance Materials' fracking chemicals business, expanding its market presence.
Strategic Outlook for North America Fracking Chemicals Market Market
The North American fracking chemicals market is poised for continued growth, driven by the increasing demand for shale gas and oil, technological advancements, and the expansion of production activities into new areas. Opportunities abound for companies that can develop environmentally friendly solutions, improve operational efficiency, and effectively leverage digital technologies. The market is expected to witness consolidation through mergers and acquisitions, leading to a more concentrated landscape.
North America Fracking Chemicals Market Segmentation
-
1. Fluid Type
- 1.1. Water-based
- 1.2. Foam-based
- 1.3. Other Fluid Types
-
2. Well Type
- 2.1. Vertical
- 2.2. Horizontal or Directional
-
3. Geography
- 3.1. United States
- 3.2. Canada
- 3.3. Rest of North America
North America Fracking Chemicals Market Segmentation By Geography
- 1. United States
- 2. Canada
- 3. Rest of North America
North America Fracking Chemicals Market REPORT HIGHLIGHTS
| Aspects | Details |
|---|---|
| Study Period | 2019-2033 |
| Base Year | 2024 |
| Estimated Year | 2025 |
| Forecast Period | 2025-2033 |
| Historical Period | 2019-2024 |
| Growth Rate | CAGR of > 4.50% from 2019-2033 |
| Segmentation |
|
Table of Contents
- 1. Introduction
- 1.1. Research Scope
- 1.2. Market Segmentation
- 1.3. Research Methodology
- 1.4. Definitions and Assumptions
- 2. Executive Summary
- 2.1. Introduction
- 3. Market Dynamics
- 3.1. Introduction
- 3.2. Market Drivers
- 3.2.1. 4.; Increasing Investments in Water Treatment by Developing Countries4.; Growing Demand for the Various End-Use Sectors
- 3.3. Market Restrains
- 3.3.1. 4.; Availability of Cheap and Alternative Pumps
- 3.4. Market Trends
- 3.4.1. Horizontal or Directional Segment Expected to Dominate the Market
- 4. Market Factor Analysis
- 4.1. Porters Five Forces
- 4.2. Supply/Value Chain
- 4.3. PESTEL analysis
- 4.4. Market Entropy
- 4.5. Patent/Trademark Analysis
- 5. North America Fracking Chemicals Market Analysis, Insights and Forecast, 2019-2031
- 5.1. Market Analysis, Insights and Forecast - by Fluid Type
- 5.1.1. Water-based
- 5.1.2. Foam-based
- 5.1.3. Other Fluid Types
- 5.2. Market Analysis, Insights and Forecast - by Well Type
- 5.2.1. Vertical
- 5.2.2. Horizontal or Directional
- 5.3. Market Analysis, Insights and Forecast - by Geography
- 5.3.1. United States
- 5.3.2. Canada
- 5.3.3. Rest of North America
- 5.4. Market Analysis, Insights and Forecast - by Region
- 5.4.1. United States
- 5.4.2. Canada
- 5.4.3. Rest of North America
- 5.1. Market Analysis, Insights and Forecast - by Fluid Type
- 6. United States North America Fracking Chemicals Market Analysis, Insights and Forecast, 2019-2031
- 6.1. Market Analysis, Insights and Forecast - by Fluid Type
- 6.1.1. Water-based
- 6.1.2. Foam-based
- 6.1.3. Other Fluid Types
- 6.2. Market Analysis, Insights and Forecast - by Well Type
- 6.2.1. Vertical
- 6.2.2. Horizontal or Directional
- 6.3. Market Analysis, Insights and Forecast - by Geography
- 6.3.1. United States
- 6.3.2. Canada
- 6.3.3. Rest of North America
- 6.1. Market Analysis, Insights and Forecast - by Fluid Type
- 7. Canada North America Fracking Chemicals Market Analysis, Insights and Forecast, 2019-2031
- 7.1. Market Analysis, Insights and Forecast - by Fluid Type
- 7.1.1. Water-based
- 7.1.2. Foam-based
- 7.1.3. Other Fluid Types
- 7.2. Market Analysis, Insights and Forecast - by Well Type
- 7.2.1. Vertical
- 7.2.2. Horizontal or Directional
- 7.3. Market Analysis, Insights and Forecast - by Geography
- 7.3.1. United States
- 7.3.2. Canada
- 7.3.3. Rest of North America
- 7.1. Market Analysis, Insights and Forecast - by Fluid Type
- 8. Rest of North America North America Fracking Chemicals Market Analysis, Insights and Forecast, 2019-2031
- 8.1. Market Analysis, Insights and Forecast - by Fluid Type
- 8.1.1. Water-based
- 8.1.2. Foam-based
- 8.1.3. Other Fluid Types
- 8.2. Market Analysis, Insights and Forecast - by Well Type
- 8.2.1. Vertical
- 8.2.2. Horizontal or Directional
- 8.3. Market Analysis, Insights and Forecast - by Geography
- 8.3.1. United States
- 8.3.2. Canada
- 8.3.3. Rest of North America
- 8.1. Market Analysis, Insights and Forecast - by Fluid Type
- 9. United States North America Fracking Chemicals Market Analysis, Insights and Forecast, 2019-2031
- 10. Canada North America Fracking Chemicals Market Analysis, Insights and Forecast, 2019-2031
- 11. Mexico North America Fracking Chemicals Market Analysis, Insights and Forecast, 2019-2031
- 12. Rest of North America North America Fracking Chemicals Market Analysis, Insights and Forecast, 2019-2031
- 13. Competitive Analysis
- 13.1. Market Share Analysis 2024
- 13.2. Company Profiles
- 13.2.1 CES Energy Solutions Corp *List Not Exhaustive
- 13.2.1.1. Overview
- 13.2.1.2. Products
- 13.2.1.3. SWOT Analysis
- 13.2.1.4. Recent Developments
- 13.2.1.5. Financials (Based on Availability)
- 13.2.2 DuPont de Nemours Inc
- 13.2.2.1. Overview
- 13.2.2.2. Products
- 13.2.2.3. SWOT Analysis
- 13.2.2.4. Recent Developments
- 13.2.2.5. Financials (Based on Availability)
- 13.2.3 BASF SE
- 13.2.3.1. Overview
- 13.2.3.2. Products
- 13.2.3.3. SWOT Analysis
- 13.2.3.4. Recent Developments
- 13.2.3.5. Financials (Based on Availability)
- 13.2.4 Flotek Industries Inc
- 13.2.4.1. Overview
- 13.2.4.2. Products
- 13.2.4.3. SWOT Analysis
- 13.2.4.4. Recent Developments
- 13.2.4.5. Financials (Based on Availability)
- 13.2.5 Solvay SA
- 13.2.5.1. Overview
- 13.2.5.2. Products
- 13.2.5.3. SWOT Analysis
- 13.2.5.4. Recent Developments
- 13.2.5.5. Financials (Based on Availability)
- 13.2.6 Parchem Fine & Specialty Chemicals Inc
- 13.2.6.1. Overview
- 13.2.6.2. Products
- 13.2.6.3. SWOT Analysis
- 13.2.6.4. Recent Developments
- 13.2.6.5. Financials (Based on Availability)
- 13.2.7 Halliburton Company
- 13.2.7.1. Overview
- 13.2.7.2. Products
- 13.2.7.3. SWOT Analysis
- 13.2.7.4. Recent Developments
- 13.2.7.5. Financials (Based on Availability)
- 13.2.8 Dow Chemical Company
- 13.2.8.1. Overview
- 13.2.8.2. Products
- 13.2.8.3. SWOT Analysis
- 13.2.8.4. Recent Developments
- 13.2.8.5. Financials (Based on Availability)
- 13.2.9 SNF Group
- 13.2.9.1. Overview
- 13.2.9.2. Products
- 13.2.9.3. SWOT Analysis
- 13.2.9.4. Recent Developments
- 13.2.9.5. Financials (Based on Availability)
- 13.2.10 Schlumberger Limited
- 13.2.10.1. Overview
- 13.2.10.2. Products
- 13.2.10.3. SWOT Analysis
- 13.2.10.4. Recent Developments
- 13.2.10.5. Financials (Based on Availability)
- 13.2.1 CES Energy Solutions Corp *List Not Exhaustive
List of Figures
- Figure 1: North America Fracking Chemicals Market Revenue Breakdown (Million, %) by Product 2024 & 2032
- Figure 2: North America Fracking Chemicals Market Share (%) by Company 2024
List of Tables
- Table 1: North America Fracking Chemicals Market Revenue Million Forecast, by Region 2019 & 2032
- Table 2: North America Fracking Chemicals Market Volume K Tons Forecast, by Region 2019 & 2032
- Table 3: North America Fracking Chemicals Market Revenue Million Forecast, by Fluid Type 2019 & 2032
- Table 4: North America Fracking Chemicals Market Volume K Tons Forecast, by Fluid Type 2019 & 2032
- Table 5: North America Fracking Chemicals Market Revenue Million Forecast, by Well Type 2019 & 2032
- Table 6: North America Fracking Chemicals Market Volume K Tons Forecast, by Well Type 2019 & 2032
- Table 7: North America Fracking Chemicals Market Revenue Million Forecast, by Geography 2019 & 2032
- Table 8: North America Fracking Chemicals Market Volume K Tons Forecast, by Geography 2019 & 2032
- Table 9: North America Fracking Chemicals Market Revenue Million Forecast, by Region 2019 & 2032
- Table 10: North America Fracking Chemicals Market Volume K Tons Forecast, by Region 2019 & 2032
- Table 11: North America Fracking Chemicals Market Revenue Million Forecast, by Country 2019 & 2032
- Table 12: North America Fracking Chemicals Market Volume K Tons Forecast, by Country 2019 & 2032
- Table 13: United States North America Fracking Chemicals Market Revenue (Million) Forecast, by Application 2019 & 2032
- Table 14: United States North America Fracking Chemicals Market Volume (K Tons) Forecast, by Application 2019 & 2032
- Table 15: Canada North America Fracking Chemicals Market Revenue (Million) Forecast, by Application 2019 & 2032
- Table 16: Canada North America Fracking Chemicals Market Volume (K Tons) Forecast, by Application 2019 & 2032
- Table 17: Mexico North America Fracking Chemicals Market Revenue (Million) Forecast, by Application 2019 & 2032
- Table 18: Mexico North America Fracking Chemicals Market Volume (K Tons) Forecast, by Application 2019 & 2032
- Table 19: Rest of North America North America Fracking Chemicals Market Revenue (Million) Forecast, by Application 2019 & 2032
- Table 20: Rest of North America North America Fracking Chemicals Market Volume (K Tons) Forecast, by Application 2019 & 2032
- Table 21: North America Fracking Chemicals Market Revenue Million Forecast, by Fluid Type 2019 & 2032
- Table 22: North America Fracking Chemicals Market Volume K Tons Forecast, by Fluid Type 2019 & 2032
- Table 23: North America Fracking Chemicals Market Revenue Million Forecast, by Well Type 2019 & 2032
- Table 24: North America Fracking Chemicals Market Volume K Tons Forecast, by Well Type 2019 & 2032
- Table 25: North America Fracking Chemicals Market Revenue Million Forecast, by Geography 2019 & 2032
- Table 26: North America Fracking Chemicals Market Volume K Tons Forecast, by Geography 2019 & 2032
- Table 27: North America Fracking Chemicals Market Revenue Million Forecast, by Country 2019 & 2032
- Table 28: North America Fracking Chemicals Market Volume K Tons Forecast, by Country 2019 & 2032
- Table 29: North America Fracking Chemicals Market Revenue Million Forecast, by Fluid Type 2019 & 2032
- Table 30: North America Fracking Chemicals Market Volume K Tons Forecast, by Fluid Type 2019 & 2032
- Table 31: North America Fracking Chemicals Market Revenue Million Forecast, by Well Type 2019 & 2032
- Table 32: North America Fracking Chemicals Market Volume K Tons Forecast, by Well Type 2019 & 2032
- Table 33: North America Fracking Chemicals Market Revenue Million Forecast, by Geography 2019 & 2032
- Table 34: North America Fracking Chemicals Market Volume K Tons Forecast, by Geography 2019 & 2032
- Table 35: North America Fracking Chemicals Market Revenue Million Forecast, by Country 2019 & 2032
- Table 36: North America Fracking Chemicals Market Volume K Tons Forecast, by Country 2019 & 2032
- Table 37: North America Fracking Chemicals Market Revenue Million Forecast, by Fluid Type 2019 & 2032
- Table 38: North America Fracking Chemicals Market Volume K Tons Forecast, by Fluid Type 2019 & 2032
- Table 39: North America Fracking Chemicals Market Revenue Million Forecast, by Well Type 2019 & 2032
- Table 40: North America Fracking Chemicals Market Volume K Tons Forecast, by Well Type 2019 & 2032
- Table 41: North America Fracking Chemicals Market Revenue Million Forecast, by Geography 2019 & 2032
- Table 42: North America Fracking Chemicals Market Volume K Tons Forecast, by Geography 2019 & 2032
- Table 43: North America Fracking Chemicals Market Revenue Million Forecast, by Country 2019 & 2032
- Table 44: North America Fracking Chemicals Market Volume K Tons Forecast, by Country 2019 & 2032
Frequently Asked Questions
1. What is the projected Compound Annual Growth Rate (CAGR) of the North America Fracking Chemicals Market?
The projected CAGR is approximately > 4.50%.
2. Which companies are prominent players in the North America Fracking Chemicals Market?
Key companies in the market include CES Energy Solutions Corp *List Not Exhaustive, DuPont de Nemours Inc, BASF SE, Flotek Industries Inc, Solvay SA, Parchem Fine & Specialty Chemicals Inc, Halliburton Company, Dow Chemical Company, SNF Group, Schlumberger Limited.
3. What are the main segments of the North America Fracking Chemicals Market?
The market segments include Fluid Type, Well Type, Geography.
4. Can you provide details about the market size?
The market size is estimated to be USD XX Million as of 2022.
5. What are some drivers contributing to market growth?
4.; Increasing Investments in Water Treatment by Developing Countries4.; Growing Demand for the Various End-Use Sectors.
6. What are the notable trends driving market growth?
Horizontal or Directional Segment Expected to Dominate the Market.
7. Are there any restraints impacting market growth?
4.; Availability of Cheap and Alternative Pumps.
8. Can you provide examples of recent developments in the market?
In 2022, Halliburton Company announced the launch of Halliburton Evolve, a new digital platform that provides real-time data and analytics to optimize fracking operations.
9. What pricing options are available for accessing the report?
Pricing options include single-user, multi-user, and enterprise licenses priced at USD 4750, USD 5250, and USD 8750 respectively.
10. Is the market size provided in terms of value or volume?
The market size is provided in terms of value, measured in Million and volume, measured in K Tons.
11. Are there any specific market keywords associated with the report?
Yes, the market keyword associated with the report is "North America Fracking Chemicals Market," which aids in identifying and referencing the specific market segment covered.
12. How do I determine which pricing option suits my needs best?
The pricing options vary based on user requirements and access needs. Individual users may opt for single-user licenses, while businesses requiring broader access may choose multi-user or enterprise licenses for cost-effective access to the report.
13. Are there any additional resources or data provided in the North America Fracking Chemicals Market report?
While the report offers comprehensive insights, it's advisable to review the specific contents or supplementary materials provided to ascertain if additional resources or data are available.
14. How can I stay updated on further developments or reports in the North America Fracking Chemicals Market?
To stay informed about further developments, trends, and reports in the North America Fracking Chemicals Market, consider subscribing to industry newsletters, following relevant companies and organizations, or regularly checking reputable industry news sources and publications.
Methodology
Step 1 - Identification of Relevant Samples Size from Population Database


Step 2 - Approaches for Defining Global Market Size (Value, Volume* & Price*)

Note*: In applicable scenarios
Step 3 - Data Sources
Primary Research
- Web Analytics
- Survey Reports
- Research Institute
- Latest Research Reports
- Opinion Leaders
Secondary Research
- Annual Reports
- White Paper
- Latest Press Release
- Industry Association
- Paid Database
- Investor Presentations

Step 4 - Data Triangulation
Involves using different sources of information in order to increase the validity of a study
These sources are likely to be stakeholders in a program - participants, other researchers, program staff, other community members, and so on.
Then we put all data in single framework & apply various statistical tools to find out the dynamic on the market.
During the analysis stage, feedback from the stakeholder groups would be compared to determine areas of agreement as well as areas of divergence


