

Key Insights
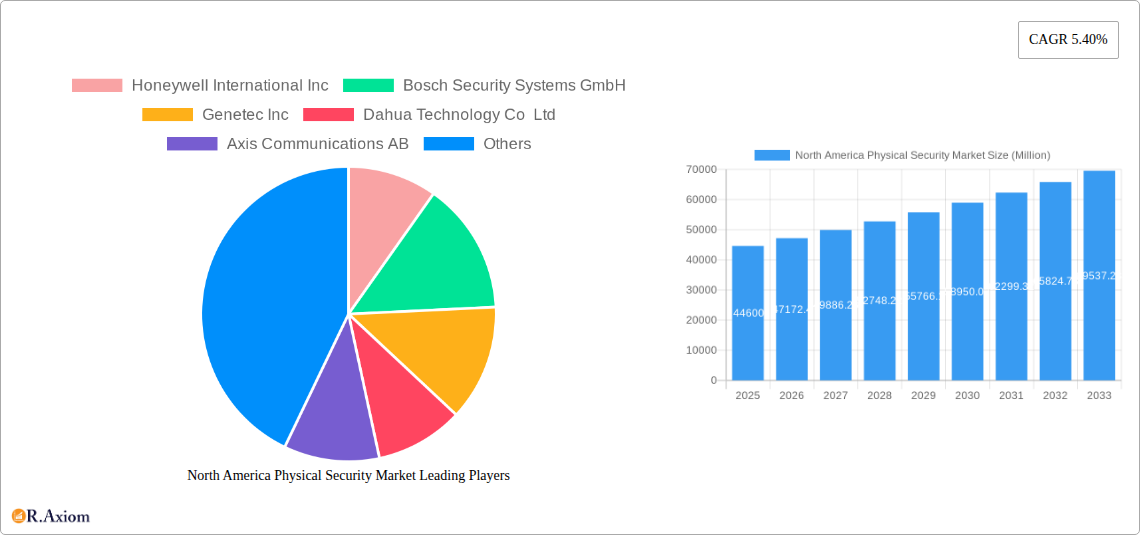
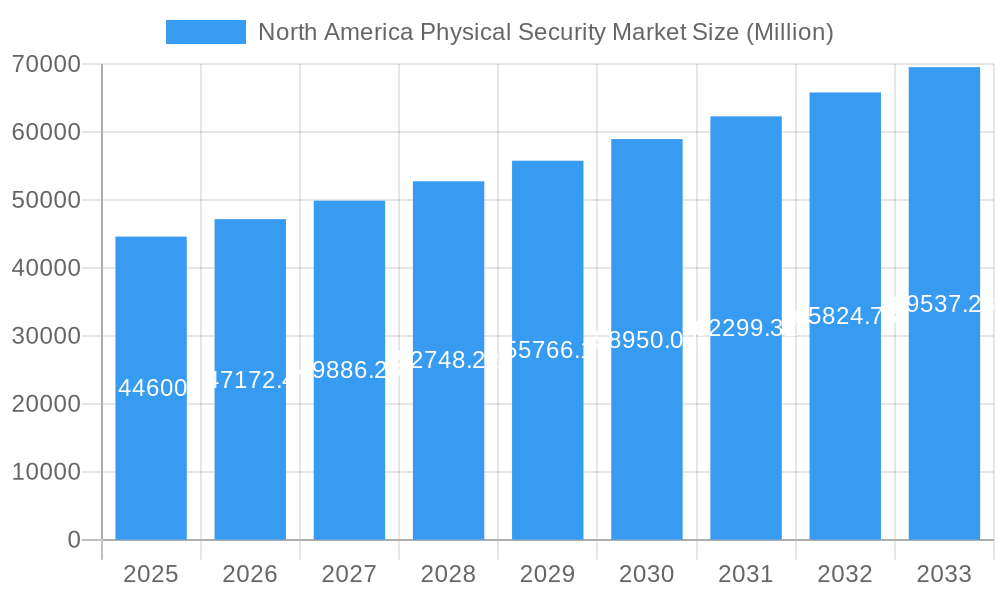
The North American physical security market, valued at approximately $44.60 billion in 2025, is projected to experience robust growth, driven by increasing concerns over cybersecurity threats, rising adoption of smart technologies, and the expanding need for robust security solutions across various sectors. The market's Compound Annual Growth Rate (CAGR) of 5.40% from 2025 to 2033 indicates a significant expansion in market size over the forecast period. Key drivers include the growing adoption of advanced surveillance technologies like video analytics and AI-powered security systems, coupled with the increasing demand for integrated security solutions that combine access control, video surveillance, and intrusion detection. Furthermore, the rise of cloud-based security platforms and the increasing prevalence of cyber threats are propelling market growth. While data breaches and cybersecurity incidents pose a significant challenge to organizations, the resulting demand for sophisticated physical security measures is contributing positively to market expansion. Government initiatives promoting national security and infrastructure protection further strengthen the growth trajectory.
North America Physical Security Market Market Size (In Billion)
The market segmentation likely includes various technologies (e.g., video surveillance, access control, intrusion detection, perimeter security), end-user industries (e.g., government, commercial, residential, critical infrastructure), and service offerings (e.g., installation, maintenance, monitoring). Leading companies like Honeywell, Bosch, and Hikvision are strategically investing in research and development to enhance their product offerings and expand their market share. Competitive pressures are driving innovation and compelling companies to offer integrated and comprehensive security solutions tailored to the specific needs of diverse customer segments. The North American market is expected to remain a significant contributor to global physical security revenue, influenced by factors including robust economic activity, advanced technological adoption, and the increasing awareness of security risks.
North America Physical Security Market Company Market Share
North America Physical Security Market: A Comprehensive Report (2019-2033)
This comprehensive report provides an in-depth analysis of the North America physical security market, covering the period from 2019 to 2033. It offers invaluable insights for industry stakeholders, including manufacturers, investors, and government agencies, seeking to understand market trends, opportunities, and challenges. The report leverages extensive data analysis and expert forecasts to deliver actionable intelligence, focusing on market size, segmentation, growth drivers, competitive landscape, and key developments. The estimated market size in 2025 is xx Million, with a projected CAGR of xx% from 2025 to 2033.
North America Physical Security Market Concentration & Innovation
The North America physical security market exhibits a moderately concentrated landscape, with key players holding significant market share. Honeywell International Inc., Bosch Security Systems GmbH, and Johnson Controls are among the leading companies, commanding a combined market share of approximately xx%. However, the market is also characterized by the presence of several smaller, specialized companies, particularly in niche segments such as access control and video surveillance.
Market Concentration Metrics:
- Top 3 Players Market Share: xx%
- Top 5 Players Market Share: xx%
- Average M&A Deal Value (2019-2024): xx Million
Innovation Drivers:
- Increasing adoption of advanced technologies like AI, IoT, and cloud computing.
- Growing demand for integrated security solutions.
- Stringent regulatory frameworks promoting security upgrades.
- Rise of sophisticated cyber threats.
- Growing preference for proactive and preventative security measures.
Regulatory Frameworks & Product Substitutes:
The market is subject to various regulatory frameworks related to data privacy and security compliance. The emergence of new technologies, such as advanced analytics and biometrics, is creating substitutes for traditional security solutions. The ongoing consolidation through M&A activities is also influencing the market structure and competitive dynamics, driving innovation and efficiency.
North America Physical Security Market Industry Trends & Insights
The North America physical security market is experiencing robust growth driven by several key factors. The increasing adoption of sophisticated security solutions across various sectors, including commercial, industrial, and governmental institutions, is a primary driver. Technological advancements such as artificial intelligence (AI), Internet of Things (IoT), and cloud-based platforms are revolutionizing security systems, improving efficiency, and creating new opportunities. These advancements enable real-time monitoring, predictive analytics, and automated threat response.
Market Growth Drivers:
- Rising security concerns due to increased crime rates and terrorist threats.
- Growing demand for perimeter security solutions in critical infrastructure sectors.
- Increased investments in security technologies by both the public and private sectors.
- Growing adoption of cloud-based security solutions for improved scalability and cost-effectiveness.
- Expanding application of video analytics for improved threat detection and response.
Consumer Preferences & Competitive Dynamics:
Consumers are increasingly demanding user-friendly, integrated, and scalable security solutions. The market is characterized by intense competition among established players and emerging technology providers. Strategic partnerships, product innovation, and mergers and acquisitions are shaping the competitive landscape. The market shows a strong preference for solutions that offer seamless integration with existing systems and are easily managed.
Dominant Markets & Segments in North America Physical Security Market
The United States dominates the North America physical security market, followed by Canada and Mexico. The leading segment is access control, driven by increased demand for secure access to buildings and facilities. Video surveillance is another significant segment, driven by advancements in video analytics and improved image quality.
Key Drivers for U.S. Dominance:
- Large and diverse economy.
- High adoption of advanced technologies.
- Stringent security regulations.
- Significant investments in infrastructure.
- High levels of security awareness among consumers and businesses.
Dominance Analysis:
The United States' dominance stems from its large economy, high technological adoption, stringent security regulations, and substantial investments in infrastructure. The market shows robust growth in segments like access control and video surveillance due to increasing security threats and advancements in technology.
North America Physical Security Market Product Developments
The North American physical security market is witnessing a surge in innovative product developments aimed at elevating security efficacy and user experience. Key advancements include the integration of advanced video analytics powered by artificial intelligence (AI), enabling sophisticated threat detection, anomaly identification, and behavioral analysis with unprecedented accuracy. Furthermore, the market is embracing cloud-based access control systems that offer unparalleled flexibility, scalability, and remote management capabilities, catering to the dynamic needs of modern organizations. A significant trend is the development of integrated security platforms that unify diverse security systems – such as video surveillance, access control, intrusion detection, and alarm management – into a single, intuitive management interface. These integrated solutions streamline operations, enhance situational awareness, and facilitate centralized monitoring and control. The overarching emphasis is on creating solutions that are not only more intelligent and robust but also cost-effective and deliver a seamless, user-friendly experience, promoting greater interoperability between different security technologies.
Report Scope & Segmentation Analysis
This report segments the North America physical security market by product type (access control, video surveillance, intrusion detection, perimeter security, and others), end-user (commercial, residential, government, and industrial), and technology (biometrics, video analytics, and others). Each segment's growth projections, market sizes, and competitive dynamics are analyzed to provide a granular understanding of the market. The market is expected to witness significant growth across all segments, driven by technological advancements and increasing security concerns.
Key Drivers of North America Physical Security Market Growth
The expansion of the North America physical security market is fueled by a confluence of potent growth drivers. Foremost among these are rapid technological advancements, particularly the pervasive influence of Artificial Intelligence (AI), the Internet of Things (IoT), and cloud computing. These technologies are fundamentally reshaping the capabilities of security systems, enabling predictive analytics, smarter automation, and enhanced remote accessibility. Government initiatives and stringent regulations focused on bolstering national security, critical infrastructure protection, and public safety are also significant catalysts for market growth. The escalating need for robust security measures across a diverse spectrum of industries, including sensitive sectors like healthcare and finance, as well as educational institutions, retail environments, and commercial properties, is driving substantial demand for sophisticated and comprehensive security solutions. The evolving threat landscape, characterized by increasingly complex and sophisticated security risks, further compels organizations to invest in advanced physical security technologies.
Challenges in the North America Physical Security Market Sector
Despite its impressive growth trajectory, the North America physical security market navigates several significant challenges. The initial investment costs associated with deploying cutting-edge security systems, especially those incorporating AI and advanced analytics, can be substantial, presenting a barrier for some organizations. Potential disruptions in global supply chains can impact the availability and timely delivery of critical components, leading to project delays and increased costs. The increasing complexity of integrating disparate security systems from various vendors into a cohesive and unified platform remains a persistent challenge, demanding specialized expertise and significant configuration effort. Moreover, the escalating sophistication of cybersecurity threats, coupled with the stringent requirements for data privacy and compliance with regulations like GDPR and CCPA, poses a formidable challenge for both manufacturers and end-users. The intensely competitive market landscape, populated by established industry leaders and agile new entrants, continues to exert pressure on pricing strategies and profit margins.
Emerging Opportunities in North America Physical Security Market
The market presents significant opportunities for growth in areas such as the integration of AI and machine learning for improved threat detection, the development of more sophisticated biometric authentication systems, and the adoption of cloud-based security solutions for enhanced scalability and remote management. The growing adoption of smart city initiatives provides opportunities for deploying smart security systems and technologies. Further advancements in cybersecurity technologies are also creating new growth avenues.
Leading Players in the North America Physical Security Market Market
Key Developments in North America Physical Security Market Industry
- October 2023: IDEMIA announced a secure, standards-based converged access card, combining physical and network access, developed in collaboration with HYPR and Wavelynx. This significantly improves user convenience and security.
- March 2023: Genetec Inc. partnered with Axis Communications to launch "Axis Powered by Genetec," an enterprise-grade access control solution integrating Genetec's software and Axis' hardware. This signifies a significant step toward greater system integration and improved efficiency in the market.
Strategic Outlook for North America Physical Security Market Market
The North America physical security market is poised for continued robust growth, driven by technological innovation and increasing security concerns across various sectors. The convergence of physical and cybersecurity, coupled with the rising adoption of AI and cloud-based solutions, will shape the future market landscape. Companies focusing on developing integrated, user-friendly, and highly secure solutions will be well-positioned to capitalize on emerging opportunities. Continued investment in R&D and strategic partnerships will be crucial for maintaining a competitive edge in this dynamic market.
North America Physical Security Market Segmentation
-
1. System Type
-
1.1. Video Surveillance System
- 1.1.1. IP Surveillance
- 1.1.2. Analog Surveillance
- 1.1.3. Hybrid Surveillance
- 1.2. Physical Access Control System (PACS)
- 1.3. Biometric System
- 1.4. Perimeter Security
- 1.5. Intrusion Detection
-
1.1. Video Surveillance System
-
2. Service Type
- 2.1. Access Control as a Service (ACaaS)
- 2.2. Video Surveillance as a Service (VSaaS)
-
3. Type of Deployment
- 3.1. On-Premises
- 3.2. Cloud
-
4. Organization Size
- 4.1. SMEs
- 4.2. Large Enterprises
-
5. End-user Industry
- 5.1. Government Services
- 5.2. Banking and Financial Services
- 5.3. IT and Telecommunications
- 5.4. Transportation and Logistics
- 5.5. Retail
- 5.6. Healthcare
- 5.7. Residential
- 5.8. Other End-user Industries
North America Physical Security Market Segmentation By Geography
-
1. North America
- 1.1. United States
- 1.2. Canada
- 1.3. Mexico
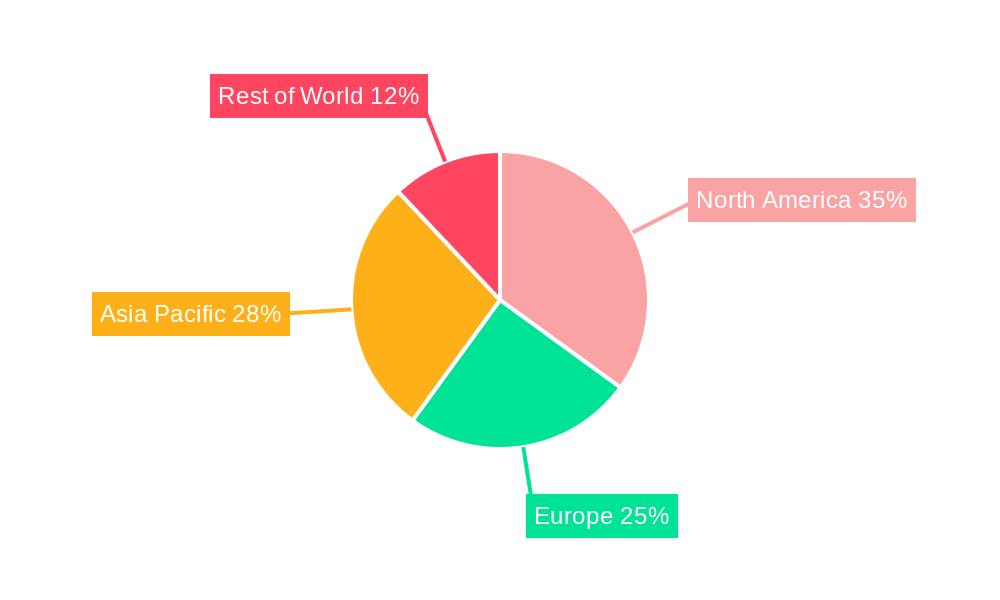
North America Physical Security Market Regional Market Share
Geographic Coverage of North America Physical Security Market
North America Physical Security Market REPORT HIGHLIGHTS
| Aspects | Details |
|---|---|
| Study Period | 2020-2034 |
| Base Year | 2025 |
| Estimated Year | 2026 |
| Forecast Period | 2026-2034 |
| Historical Period | 2020-2025 |
| Growth Rate | CAGR of 5.40% from 2020-2034 |
| Segmentation |
|
Table of Contents
- 1. Introduction
- 1.1. Research Scope
- 1.2. Market Segmentation
- 1.3. Research Objective
- 1.4. Definitions and Assumptions
- 2. Executive Summary
- 2.1. Market Snapshot
- 3. Market Dynamics
- 3.1. Market Drivers
- 3.2. Market Restrains
- 3.3. Market Trends
- 3.4. Market Opportunities
- 4. Market Factor Analysis
- 4.1. Porters Five Forces
- 4.1.1. Bargaining Power of Suppliers
- 4.1.2. Bargaining Power of Buyers
- 4.1.3. Threat of New Entrants
- 4.1.4. Threat of Substitutes
- 4.1.5. Competitive Rivalry
- 4.2. PESTEL analysis
- 4.3. BCG Analysis
- 4.3.1. Stars (High Growth, High Market Share)
- 4.3.2. Cash Cows (Low Growth, High Market Share)
- 4.3.3. Question Mark (High Growth, Low Market Share)
- 4.3.4. Dogs (Low Growth, Low Market Share)
- 4.4. Ansoff Matrix Analysis
- 4.5. Supply Chain Analysis
- 4.6. Regulatory Landscape
- 4.7. Current Market Potential and Opportunity Assessment (TAM–SAM–SOM Framework)
- 4.8. RAX Analyst Note
- 4.1. Porters Five Forces
- 5. Market Analysis, Insights and Forecast 2021-2033
- 5.1. Market Analysis, Insights and Forecast - by System Type
- 5.1.1. Video Surveillance System
- 5.1.1.1. IP Surveillance
- 5.1.1.2. Analog Surveillance
- 5.1.1.3. Hybrid Surveillance
- 5.1.2. Physical Access Control System (PACS)
- 5.1.3. Biometric System
- 5.1.4. Perimeter Security
- 5.1.5. Intrusion Detection
- 5.1.1. Video Surveillance System
- 5.2. Market Analysis, Insights and Forecast - by Service Type
- 5.2.1. Access Control as a Service (ACaaS)
- 5.2.2. Video Surveillance as a Service (VSaaS)
- 5.3. Market Analysis, Insights and Forecast - by Type of Deployment
- 5.3.1. On-Premises
- 5.3.2. Cloud
- 5.4. Market Analysis, Insights and Forecast - by Organization Size
- 5.4.1. SMEs
- 5.4.2. Large Enterprises
- 5.5. Market Analysis, Insights and Forecast - by End-user Industry
- 5.5.1. Government Services
- 5.5.2. Banking and Financial Services
- 5.5.3. IT and Telecommunications
- 5.5.4. Transportation and Logistics
- 5.5.5. Retail
- 5.5.6. Healthcare
- 5.5.7. Residential
- 5.5.8. Other End-user Industries
- 5.6. Market Analysis, Insights and Forecast - by Region
- 5.6.1. North America
- 5.1. Market Analysis, Insights and Forecast - by System Type
- 6. North America Physical Security Market Analysis, Insights and Forecast, 2021-2033
- 6.1. Market Analysis, Insights and Forecast - by System Type
- 6.1.1. Video Surveillance System
- 6.1.1.1. IP Surveillance
- 6.1.1.2. Analog Surveillance
- 6.1.1.3. Hybrid Surveillance
- 6.1.2. Physical Access Control System (PACS)
- 6.1.3. Biometric System
- 6.1.4. Perimeter Security
- 6.1.5. Intrusion Detection
- 6.1.1. Video Surveillance System
- 6.2. Market Analysis, Insights and Forecast - by Service Type
- 6.2.1. Access Control as a Service (ACaaS)
- 6.2.2. Video Surveillance as a Service (VSaaS)
- 6.3. Market Analysis, Insights and Forecast - by Type of Deployment
- 6.3.1. On-Premises
- 6.3.2. Cloud
- 6.4. Market Analysis, Insights and Forecast - by Organization Size
- 6.4.1. SMEs
- 6.4.2. Large Enterprises
- 6.5. Market Analysis, Insights and Forecast - by End-user Industry
- 6.5.1. Government Services
- 6.5.2. Banking and Financial Services
- 6.5.3. IT and Telecommunications
- 6.5.4. Transportation and Logistics
- 6.5.5. Retail
- 6.5.6. Healthcare
- 6.5.7. Residential
- 6.5.8. Other End-user Industries
- 6.1. Market Analysis, Insights and Forecast - by System Type
- 7. Competitive Analysis
- 7.1. Company Profiles
- 7.1.1 Honeywell International Inc
- 7.1.1.1. Company Overview
- 7.1.1.2. Products
- 7.1.1.3. Company Financials
- 7.1.1.4. SWOT Analysis
- 7.1.2 Bosch Security Systems GmbH
- 7.1.2.1. Company Overview
- 7.1.2.2. Products
- 7.1.2.3. Company Financials
- 7.1.2.4. SWOT Analysis
- 7.1.3 Genetec Inc
- 7.1.3.1. Company Overview
- 7.1.3.2. Products
- 7.1.3.3. Company Financials
- 7.1.3.4. SWOT Analysis
- 7.1.4 Dahua Technology Co Ltd
- 7.1.4.1. Company Overview
- 7.1.4.2. Products
- 7.1.4.3. Company Financials
- 7.1.4.4. SWOT Analysis
- 7.1.5 Axis Communications AB
- 7.1.5.1. Company Overview
- 7.1.5.2. Products
- 7.1.5.3. Company Financials
- 7.1.5.4. SWOT Analysis
- 7.1.6 Johnson Controls
- 7.1.6.1. Company Overview
- 7.1.6.2. Products
- 7.1.6.3. Company Financials
- 7.1.6.4. SWOT Analysis
- 7.1.7 Kastle Systems
- 7.1.7.1. Company Overview
- 7.1.7.2. Products
- 7.1.7.3. Company Financials
- 7.1.7.4. SWOT Analysis
- 7.1.8 Wesco International (Anixter Inc )
- 7.1.8.1. Company Overview
- 7.1.8.2. Products
- 7.1.8.3. Company Financials
- 7.1.8.4. SWOT Analysis
- 7.1.9 Hangzhou Hikvision Digital Technology Co Ltd
- 7.1.9.1. Company Overview
- 7.1.9.2. Products
- 7.1.9.3. Company Financials
- 7.1.9.4. SWOT Analysis
- 7.1.10 HID Global Corporation
- 7.1.10.1. Company Overview
- 7.1.10.2. Products
- 7.1.10.3. Company Financials
- 7.1.10.4. SWOT Analysis
- 7.1.11 Vidsys Inc
- 7.1.11.1. Company Overview
- 7.1.11.2. Products
- 7.1.11.3. Company Financials
- 7.1.11.4. SWOT Analysis
- 7.1.1 Honeywell International Inc
- 7.2. Market Entropy
- 7.2.1 Company's Key Areas Served
- 7.2.2 Recent Developments
- 7.3. Company Market Share Analysis 2025
- 7.3.1 Top 5 Companies Market Share Analysis
- 7.3.2 Top 3 Companies Market Share Analysis
- 7.4. List of Potential Customers
- 8. Research Methodology
List of Figures
- Figure 1: North America Physical Security Market Revenue Breakdown (Million, %) by Product 2025 & 2033
- Figure 2: North America Physical Security Market Share (%) by Company 2025
List of Tables
- Table 1: North America Physical Security Market Revenue Million Forecast, by System Type 2020 & 2033
- Table 2: North America Physical Security Market Volume Billion Forecast, by System Type 2020 & 2033
- Table 3: North America Physical Security Market Revenue Million Forecast, by Service Type 2020 & 2033
- Table 4: North America Physical Security Market Volume Billion Forecast, by Service Type 2020 & 2033
- Table 5: North America Physical Security Market Revenue Million Forecast, by Type of Deployment 2020 & 2033
- Table 6: North America Physical Security Market Volume Billion Forecast, by Type of Deployment 2020 & 2033
- Table 7: North America Physical Security Market Revenue Million Forecast, by Organization Size 2020 & 2033
- Table 8: North America Physical Security Market Volume Billion Forecast, by Organization Size 2020 & 2033
- Table 9: North America Physical Security Market Revenue Million Forecast, by End-user Industry 2020 & 2033
- Table 10: North America Physical Security Market Volume Billion Forecast, by End-user Industry 2020 & 2033
- Table 11: North America Physical Security Market Revenue Million Forecast, by Region 2020 & 2033
- Table 12: North America Physical Security Market Volume Billion Forecast, by Region 2020 & 2033
- Table 13: North America Physical Security Market Revenue Million Forecast, by System Type 2020 & 2033
- Table 14: North America Physical Security Market Volume Billion Forecast, by System Type 2020 & 2033
- Table 15: North America Physical Security Market Revenue Million Forecast, by Service Type 2020 & 2033
- Table 16: North America Physical Security Market Volume Billion Forecast, by Service Type 2020 & 2033
- Table 17: North America Physical Security Market Revenue Million Forecast, by Type of Deployment 2020 & 2033
- Table 18: North America Physical Security Market Volume Billion Forecast, by Type of Deployment 2020 & 2033
- Table 19: North America Physical Security Market Revenue Million Forecast, by Organization Size 2020 & 2033
- Table 20: North America Physical Security Market Volume Billion Forecast, by Organization Size 2020 & 2033
- Table 21: North America Physical Security Market Revenue Million Forecast, by End-user Industry 2020 & 2033
- Table 22: North America Physical Security Market Volume Billion Forecast, by End-user Industry 2020 & 2033
- Table 23: North America Physical Security Market Revenue Million Forecast, by Country 2020 & 2033
- Table 24: North America Physical Security Market Volume Billion Forecast, by Country 2020 & 2033
- Table 25: United States North America Physical Security Market Revenue (Million) Forecast, by Application 2020 & 2033
- Table 26: United States North America Physical Security Market Volume (Billion) Forecast, by Application 2020 & 2033
- Table 27: Canada North America Physical Security Market Revenue (Million) Forecast, by Application 2020 & 2033
- Table 28: Canada North America Physical Security Market Volume (Billion) Forecast, by Application 2020 & 2033
- Table 29: Mexico North America Physical Security Market Revenue (Million) Forecast, by Application 2020 & 2033
- Table 30: Mexico North America Physical Security Market Volume (Billion) Forecast, by Application 2020 & 2033
Frequently Asked Questions
1. What is the projected Compound Annual Growth Rate (CAGR) of the North America Physical Security Market?
The projected CAGR is approximately 5.40%.
2. Which companies are prominent players in the North America Physical Security Market?
Key companies in the market include Honeywell International Inc, Bosch Security Systems GmbH, Genetec Inc, Dahua Technology Co Ltd, Axis Communications AB, Johnson Controls, Kastle Systems, Wesco International (Anixter Inc ), Hangzhou Hikvision Digital Technology Co Ltd, HID Global Corporation, Vidsys Inc.
3. What are the main segments of the North America Physical Security Market?
The market segments include System Type, Service Type, Type of Deployment, Organization Size, End-user Industry.
4. Can you provide details about the market size?
The market size is estimated to be USD 44.60 Million as of 2022.
5. What are some drivers contributing to market growth?
Growing Awareness Regarding the Physical Security Systems; Increasing usage of IP-Based Cameras for Video Surveillance; Innovations like AI. ML. IoT in Security Solutions.
6. What are the notable trends driving market growth?
Video Surveillance Systems Are Expected to Hold a Significant Market Share.
7. Are there any restraints impacting market growth?
Growing Awareness Regarding the Physical Security Systems; Increasing usage of IP-Based Cameras for Video Surveillance; Innovations like AI. ML. IoT in Security Solutions.
8. Can you provide examples of recent developments in the market?
October 2023: IDEMIA announced the development of a secure and standards-based converged access card for the enterprise access market. This innovation was made possible through a collaborative effort with HYPR, a renowned identity assurance company known for its passwordless authentication solutions, and Wavelynx, a trusted leader in secure and interoperable reader and credential solutions. With this new converged access card, users have the convenience of using a single badge for physical and network access while adhering to open and interoperable standards.
9. What pricing options are available for accessing the report?
Pricing options include single-user, multi-user, and enterprise licenses priced at USD 4750, USD 4950, and USD 6800 respectively.
10. Is the market size provided in terms of value or volume?
The market size is provided in terms of value, measured in Million and volume, measured in Billion.
11. Are there any specific market keywords associated with the report?
Yes, the market keyword associated with the report is "North America Physical Security Market," which aids in identifying and referencing the specific market segment covered.
12. How do I determine which pricing option suits my needs best?
The pricing options vary based on user requirements and access needs. Individual users may opt for single-user licenses, while businesses requiring broader access may choose multi-user or enterprise licenses for cost-effective access to the report.
13. Are there any additional resources or data provided in the North America Physical Security Market report?
While the report offers comprehensive insights, it's advisable to review the specific contents or supplementary materials provided to ascertain if additional resources or data are available.
14. How can I stay updated on further developments or reports in the North America Physical Security Market?
To stay informed about further developments, trends, and reports in the North America Physical Security Market, consider subscribing to industry newsletters, following relevant companies and organizations, or regularly checking reputable industry news sources and publications.
Methodology
Step 1 - Identification of Relevant Samples Size from Population Database


Step 2 - Approaches for Defining Global Market Size (Value, Volume* & Price*)

Note*: In applicable scenarios
Step 3 - Data Sources
Primary Research
- Web Analytics
- Survey Reports
- Research Institute
- Latest Research Reports
- Opinion Leaders
Secondary Research
- Annual Reports
- White Paper
- Latest Press Release
- Industry Association
- Paid Database
- Investor Presentations

Step 4 - Data Triangulation
Involves using different sources of information in order to increase the validity of a study
These sources are likely to be stakeholders in a program - participants, other researchers, program staff, other community members, and so on.
Then we put all data in single framework & apply various statistical tools to find out the dynamic on the market.
During the analysis stage, feedback from the stakeholder groups would be compared to determine areas of agreement as well as areas of divergence