
Key Insights
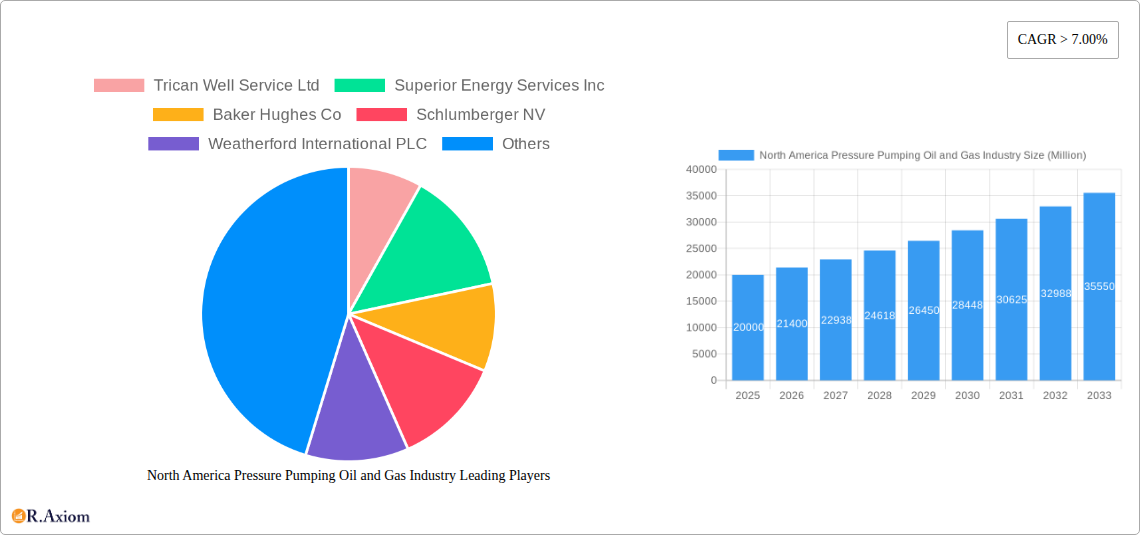
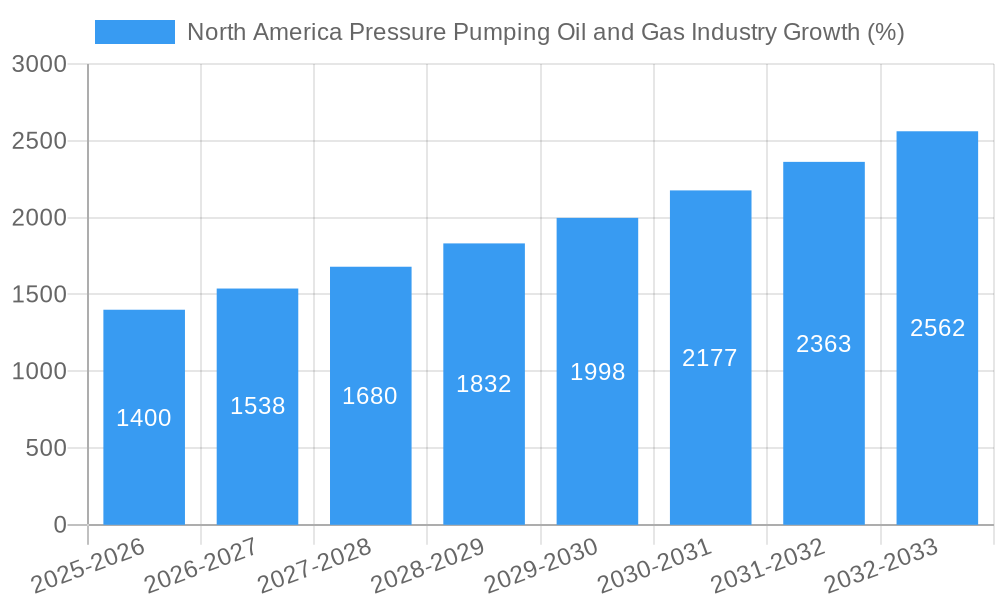
The North American pressure pumping oil and gas industry is experiencing robust growth, driven by increasing demand for oil and gas, particularly in shale formations. The market, valued at approximately $20 billion in 2025, is projected to maintain a Compound Annual Growth Rate (CAGR) exceeding 7% through 2033. This expansion is fueled by several key factors. Firstly, the ongoing exploration and production activities in unconventional oil and gas reservoirs, including shale gas and tight oil, necessitate significant pressure pumping services for hydraulic fracturing and well completion. Secondly, technological advancements in pressure pumping equipment and techniques, such as higher-pressure pumps and improved fracturing fluids, are enhancing efficiency and reducing operational costs. Finally, government policies supporting domestic energy production in North America contribute positively to the market's growth trajectory. The segment breakdown reveals a strong emphasis on horizontal well completions, reflecting the dominant position of shale gas and tight oil development in the region. Major players like Halliburton, Schlumberger, and Baker Hughes are consolidating their market share through technological innovation and strategic acquisitions.
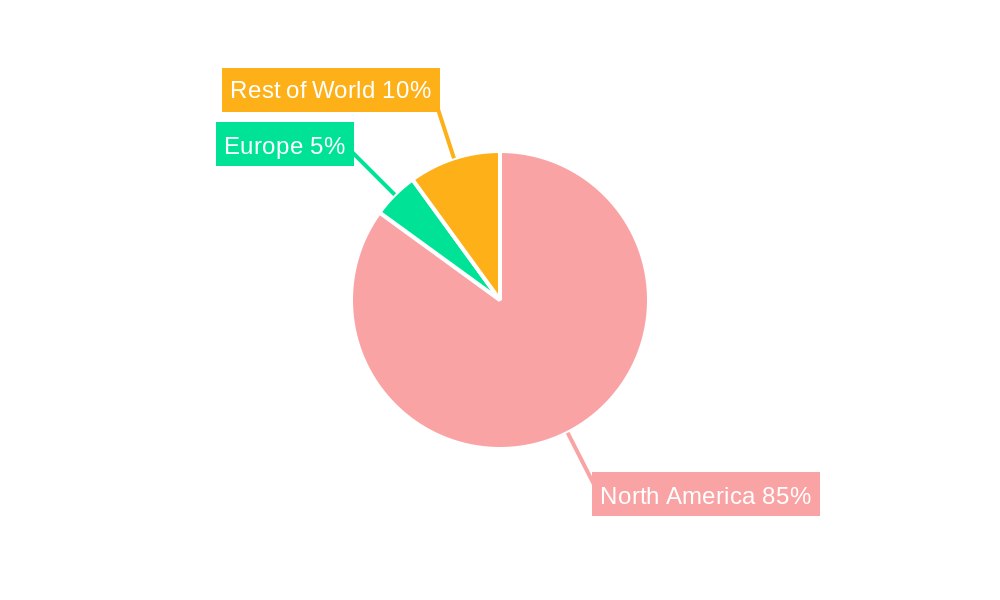
Despite the promising outlook, the industry faces certain challenges. Fluctuations in oil and gas prices can significantly impact investment decisions and operational profitability. Environmental concerns surrounding hydraulic fracturing, coupled with increasingly stringent regulations, pose operational risks and necessitate continuous adaptation by industry players. Furthermore, competition among established players and the emergence of new technologies are intensifying the competitive landscape, requiring ongoing innovation and strategic partnerships to maintain market position. The North American market, particularly the United States and Canada, remains the dominant region, accounting for a significant portion of the overall market share. However, the industry is also seeing modest growth in Mexico, driven by its own energy sector developments. The forecast period of 2025-2033 promises continued growth, offering significant opportunities for established companies and new entrants alike, although careful navigation of market risks and environmental regulations is essential for sustained success.
North America Pressure Pumping Oil and Gas Industry: A Comprehensive Market Report (2019-2033)
This comprehensive report provides an in-depth analysis of the North America pressure pumping oil and gas industry, covering the period from 2019 to 2033. It offers invaluable insights for industry stakeholders, investors, and strategic decision-makers seeking to understand the market dynamics, growth drivers, and future opportunities in this crucial sector. The report leverages extensive data analysis, incorporating historical data (2019-2024), a base year of 2025, and a detailed forecast spanning 2025-2033. Key players analyzed include Trican Well Service Ltd, Superior Energy Services Inc, Baker Hughes Co, Schlumberger NV, Weatherford International PLC, Chevron Corporation, Saipem SpA, Halliburton Company, Shell PLC, Calfrac Well Services Ltd (list not exhaustive).
North America Pressure Pumping Oil and Gas Industry Market Concentration & Innovation
This section analyzes the competitive landscape, focusing on market concentration, innovation, regulatory aspects, and M&A activity within the North American pressure pumping oil and gas market. The report examines market share distribution among key players and assesses the impact of mergers and acquisitions on market structure. Innovation drivers are explored, including technological advancements in pressure pumping equipment and techniques. Regulatory frameworks influencing industry operations and their impact on market growth are also detailed. The analysis incorporates an examination of product substitutes and their potential market penetration, alongside insights into evolving end-user preferences and trends.
- Market Share Analysis: Details on the market share held by leading companies like Halliburton, Schlumberger, and Baker Hughes, with projected changes in market share by 2033.
- M&A Activity: Examination of significant mergers and acquisitions within the industry during the historical period (2019-2024) and forecast period (2025-2033), including deal values (in Millions) where available. xx Million in M&A deals are predicted for the forecast period.
- Innovation Drivers: Analysis of technological innovations such as advancements in hydraulic fracturing techniques and automation, and their impact on efficiency and cost reduction.
- Regulatory Landscape: Discussion of environmental regulations, safety standards, and their influence on market dynamics.
North America Pressure Pumping Oil and Gas Industry Industry Trends & Insights
This section delves into the key trends and insights shaping the North America pressure pumping oil and gas industry. It provides a comprehensive overview of market growth drivers, analyzing factors contributing to the expansion of the market, along with an assessment of technological disruptions and their impact on established business models. Consumer preferences and their evolution are considered, while detailed analysis of competitive dynamics highlights the competitive pressures and strategies employed by market participants. The section includes a projection of the Compound Annual Growth Rate (CAGR) and market penetration rates for key segments.
- Market Growth Drivers: Exploration of factors such as increasing demand for oil and gas, shale gas development, and government policies supporting energy exploration.
- Technological Disruptions: Discussion of technological innovations such as automation, data analytics, and enhanced efficiency impacting the industry.
- Consumer Preferences: Analysis of changes in demand for different types of pressure pumping services based on factors such as environmental concerns and economic conditions.
- Competitive Dynamics: Assessment of strategies employed by leading companies to maintain market share, such as strategic partnerships, technological advancement, and geographic expansion. xx% market penetration is predicted by 2033.
Dominant Markets & Segments in North America Pressure Pumping Oil and Gas Industry
This section identifies the dominant regions, countries, and segments within the North American pressure pumping oil and gas industry. A detailed analysis is provided for each key segment (Service Type: Hydraulic Fracturing, Cementing, Enhanced Oil Recovery; Well Type: Horizontal, Vertical) identifying the leading players and explaining their dominance. The analysis includes an examination of the key factors driving the dominance of specific regions or segments, such as economic policies, infrastructure development, and resource availability.
- Hydraulic Fracturing: This segment is expected to maintain dominance due to increasing shale gas exploration and production. xx Million market size is predicted for 2033.
- Cementing: The cementing segment is experiencing steady growth due to increased drilling activities. xx Million market size is predicted for 2033.
- Enhanced Oil Recovery: This segment is gaining traction due to rising demand for oil and advancements in EOR technologies. xx Million market size is predicted for 2033.
- Horizontal Wells: This segment dominates due to its high efficiency in shale gas extraction. xx Million market size is predicted for 2033.
- Vertical Wells: This segment maintains a stable market share, particularly in conventional oil and gas fields. xx Million market size is predicted for 2033.
North America Pressure Pumping Oil and Gas Industry Product Developments
This section summarizes the latest product innovations, their applications, and competitive advantages within the North America pressure pumping oil and gas industry. It highlights technological trends driving product development, focusing on the improvements in efficiency, cost-effectiveness, and environmental impact. The analysis assesses the market fit of new products and technologies, focusing on their potential to disrupt existing market dynamics.
Report Scope & Segmentation Analysis
This report segments the North American pressure pumping oil and gas market based on service type (Hydraulic Fracturing, Cementing, Enhanced Oil Recovery) and well type (Horizontal, Vertical). Each segment's growth projections, market sizes (in Millions), and competitive dynamics are detailed, providing a comprehensive understanding of market structure and opportunity.
Key Drivers of North America Pressure Pumping Oil and Gas Industry Growth
Several factors drive the growth of the North American pressure pumping oil and gas industry. These include rising energy demand, increasing investments in shale gas exploration, technological advancements improving efficiency and reducing costs, and supportive government policies promoting domestic energy production. The development of new technologies and improved techniques for enhanced oil recovery further contribute to market expansion.
Challenges in the North America Pressure Pumping Oil and Gas Industry Sector
The North American pressure pumping oil and gas industry faces several challenges. Fluctuations in oil and gas prices directly impact industry revenue and investment. Stringent environmental regulations and safety standards increase operational costs and necessitate compliance investments. Furthermore, intense competition from established players and emerging new entrants creates pressure on profit margins. Supply chain disruptions caused by geopolitical events or natural disasters can negatively affect operations.
Emerging Opportunities in North America Pressure Pumping Oil and Gas Industry
Several emerging opportunities are present in the North American pressure pumping oil and gas industry. The adoption of automation and digital technologies offers significant potential for efficiency improvements and cost reduction. Growth in renewable energy sources necessitates innovative solutions for energy storage, creating new opportunities for pressure pumping technologies. Furthermore, the development of more efficient and environmentally friendly pressure pumping techniques is driving innovation and creating new market segments.
Leading Players in the North America Pressure Pumping Oil and Gas Industry Market
- Trican Well Service Ltd
- Superior Energy Services Inc
- Baker Hughes Co
- Schlumberger NV
- Weatherford International PLC
- Chevron Corporation
- Saipem SpA
- Halliburton Company
- Shell PLC
- Calfrac Well Services Ltd
Key Developments in North America Pressure Pumping Oil and Gas Industry Industry
- 2020: Significant extensions and discoveries of proved crude oil reserves in Texas (1.8 Billion barrels), New Mexico (0.7 Billion barrels), and North Dakota (0.2 Billion barrels). This fueled increased demand for pressure pumping services.
- 2020: Alaska experienced a substantial increase in proved natural gas reserves (27 tcf), quadrupling its total from 9 tcf to 36 tcf, creating new opportunities in the region.
Strategic Outlook for North America Pressure Pumping Oil and Gas Industry Market
The North American pressure pumping oil and gas market is poised for continued growth, driven by increasing energy demand and ongoing exploration and production activities. Technological advancements, particularly in automation and data analytics, will improve efficiency and reduce costs. Focus on environmentally friendly practices and sustainable operations will shape industry strategies. This combination of factors points toward a promising outlook for the industry, with significant growth opportunities expected in the forecast period.
North America Pressure Pumping Oil and Gas Industry Segmentation
-
1. Service Type
- 1.1. Hydraulic Fracturing
- 1.2. Cementing
- 1.3. Enhanced Oil Recovery
-
2. Well Type
- 2.1. Horizontal
- 2.2. Vertical
North America Pressure Pumping Oil and Gas Industry Segmentation By Geography
- 1. North America
- 2. Europe
- 3. Asia Pacific
- 4. South America
- 5. Middle East
North America Pressure Pumping Oil and Gas Industry REPORT HIGHLIGHTS
| Aspects | Details |
|---|---|
| Study Period | 2019-2033 |
| Base Year | 2024 |
| Estimated Year | 2025 |
| Forecast Period | 2025-2033 |
| Historical Period | 2019-2024 |
| Growth Rate | CAGR of > 7.00% from 2019-2033 |
| Segmentation |
|
Table of Contents
- 1. Introduction
- 1.1. Research Scope
- 1.2. Market Segmentation
- 1.3. Research Methodology
- 1.4. Definitions and Assumptions
- 2. Executive Summary
- 2.1. Introduction
- 3. Market Dynamics
- 3.1. Introduction
- 3.2. Market Drivers
- 3.2.1. Rapid Recovery in the Oil and Gas and Mining Industries4.; Surge in the Construction Industry
- 3.3. Market Restrains
- 3.3.1. High Maintenance and Operation Costs of Submersible Pump Restrain the Market
- 3.4. Market Trends
- 3.4.1. Hydraulic Fracturing Expected to Dominate the Market
- 4. Market Factor Analysis
- 4.1. Porters Five Forces
- 4.2. Supply/Value Chain
- 4.3. PESTEL analysis
- 4.4. Market Entropy
- 4.5. Patent/Trademark Analysis
- 5. North America Pressure Pumping Oil and Gas Industry Analysis, Insights and Forecast, 2019-2031
- 5.1. Market Analysis, Insights and Forecast - by Service Type
- 5.1.1. Hydraulic Fracturing
- 5.1.2. Cementing
- 5.1.3. Enhanced Oil Recovery
- 5.2. Market Analysis, Insights and Forecast - by Well Type
- 5.2.1. Horizontal
- 5.2.2. Vertical
- 5.3. Market Analysis, Insights and Forecast - by Region
- 5.3.1. North America
- 5.3.2. Europe
- 5.3.3. Asia Pacific
- 5.3.4. South America
- 5.3.5. Middle East
- 5.1. Market Analysis, Insights and Forecast - by Service Type
- 6. North America North America Pressure Pumping Oil and Gas Industry Analysis, Insights and Forecast, 2019-2031
- 6.1. Market Analysis, Insights and Forecast - by Service Type
- 6.1.1. Hydraulic Fracturing
- 6.1.2. Cementing
- 6.1.3. Enhanced Oil Recovery
- 6.2. Market Analysis, Insights and Forecast - by Well Type
- 6.2.1. Horizontal
- 6.2.2. Vertical
- 6.1. Market Analysis, Insights and Forecast - by Service Type
- 7. Europe North America Pressure Pumping Oil and Gas Industry Analysis, Insights and Forecast, 2019-2031
- 7.1. Market Analysis, Insights and Forecast - by Service Type
- 7.1.1. Hydraulic Fracturing
- 7.1.2. Cementing
- 7.1.3. Enhanced Oil Recovery
- 7.2. Market Analysis, Insights and Forecast - by Well Type
- 7.2.1. Horizontal
- 7.2.2. Vertical
- 7.1. Market Analysis, Insights and Forecast - by Service Type
- 8. Asia Pacific North America Pressure Pumping Oil and Gas Industry Analysis, Insights and Forecast, 2019-2031
- 8.1. Market Analysis, Insights and Forecast - by Service Type
- 8.1.1. Hydraulic Fracturing
- 8.1.2. Cementing
- 8.1.3. Enhanced Oil Recovery
- 8.2. Market Analysis, Insights and Forecast - by Well Type
- 8.2.1. Horizontal
- 8.2.2. Vertical
- 8.1. Market Analysis, Insights and Forecast - by Service Type
- 9. South America North America Pressure Pumping Oil and Gas Industry Analysis, Insights and Forecast, 2019-2031
- 9.1. Market Analysis, Insights and Forecast - by Service Type
- 9.1.1. Hydraulic Fracturing
- 9.1.2. Cementing
- 9.1.3. Enhanced Oil Recovery
- 9.2. Market Analysis, Insights and Forecast - by Well Type
- 9.2.1. Horizontal
- 9.2.2. Vertical
- 9.1. Market Analysis, Insights and Forecast - by Service Type
- 10. Middle East North America Pressure Pumping Oil and Gas Industry Analysis, Insights and Forecast, 2019-2031
- 10.1. Market Analysis, Insights and Forecast - by Service Type
- 10.1.1. Hydraulic Fracturing
- 10.1.2. Cementing
- 10.1.3. Enhanced Oil Recovery
- 10.2. Market Analysis, Insights and Forecast - by Well Type
- 10.2.1. Horizontal
- 10.2.2. Vertical
- 10.1. Market Analysis, Insights and Forecast - by Service Type
- 11. United States North America Pressure Pumping Oil and Gas Industry Analysis, Insights and Forecast, 2019-2031
- 12. Canada North America Pressure Pumping Oil and Gas Industry Analysis, Insights and Forecast, 2019-2031
- 13. Mexico North America Pressure Pumping Oil and Gas Industry Analysis, Insights and Forecast, 2019-2031
- 14. Rest of North America North America Pressure Pumping Oil and Gas Industry Analysis, Insights and Forecast, 2019-2031
- 15. Competitive Analysis
- 15.1. Market Share Analysis 2024
- 15.2. Company Profiles
- 15.2.1 Trican Well Service Ltd
- 15.2.1.1. Overview
- 15.2.1.2. Products
- 15.2.1.3. SWOT Analysis
- 15.2.1.4. Recent Developments
- 15.2.1.5. Financials (Based on Availability)
- 15.2.2 Superior Energy Services Inc
- 15.2.2.1. Overview
- 15.2.2.2. Products
- 15.2.2.3. SWOT Analysis
- 15.2.2.4. Recent Developments
- 15.2.2.5. Financials (Based on Availability)
- 15.2.3 Baker Hughes Co
- 15.2.3.1. Overview
- 15.2.3.2. Products
- 15.2.3.3. SWOT Analysis
- 15.2.3.4. Recent Developments
- 15.2.3.5. Financials (Based on Availability)
- 15.2.4 Schlumberger NV
- 15.2.4.1. Overview
- 15.2.4.2. Products
- 15.2.4.3. SWOT Analysis
- 15.2.4.4. Recent Developments
- 15.2.4.5. Financials (Based on Availability)
- 15.2.5 Weatherford International PLC
- 15.2.5.1. Overview
- 15.2.5.2. Products
- 15.2.5.3. SWOT Analysis
- 15.2.5.4. Recent Developments
- 15.2.5.5. Financials (Based on Availability)
- 15.2.6 Chevron Corporation
- 15.2.6.1. Overview
- 15.2.6.2. Products
- 15.2.6.3. SWOT Analysis
- 15.2.6.4. Recent Developments
- 15.2.6.5. Financials (Based on Availability)
- 15.2.7 Saipem SpA
- 15.2.7.1. Overview
- 15.2.7.2. Products
- 15.2.7.3. SWOT Analysis
- 15.2.7.4. Recent Developments
- 15.2.7.5. Financials (Based on Availability)
- 15.2.8 Halliburton Company
- 15.2.8.1. Overview
- 15.2.8.2. Products
- 15.2.8.3. SWOT Analysis
- 15.2.8.4. Recent Developments
- 15.2.8.5. Financials (Based on Availability)
- 15.2.9 Shell PLC*List Not Exhaustive
- 15.2.9.1. Overview
- 15.2.9.2. Products
- 15.2.9.3. SWOT Analysis
- 15.2.9.4. Recent Developments
- 15.2.9.5. Financials (Based on Availability)
- 15.2.10 Calfrac Well Services Ltd
- 15.2.10.1. Overview
- 15.2.10.2. Products
- 15.2.10.3. SWOT Analysis
- 15.2.10.4. Recent Developments
- 15.2.10.5. Financials (Based on Availability)
- 15.2.1 Trican Well Service Ltd
List of Figures
- Figure 1: North America Pressure Pumping Oil and Gas Industry Revenue Breakdown (Million, %) by Product 2024 & 2032
- Figure 2: North America Pressure Pumping Oil and Gas Industry Share (%) by Company 2024
List of Tables
- Table 1: North America Pressure Pumping Oil and Gas Industry Revenue Million Forecast, by Region 2019 & 2032
- Table 2: North America Pressure Pumping Oil and Gas Industry Revenue Million Forecast, by Service Type 2019 & 2032
- Table 3: North America Pressure Pumping Oil and Gas Industry Revenue Million Forecast, by Well Type 2019 & 2032
- Table 4: North America Pressure Pumping Oil and Gas Industry Revenue Million Forecast, by Region 2019 & 2032
- Table 5: North America Pressure Pumping Oil and Gas Industry Revenue Million Forecast, by Country 2019 & 2032
- Table 6: United States North America Pressure Pumping Oil and Gas Industry Revenue (Million) Forecast, by Application 2019 & 2032
- Table 7: Canada North America Pressure Pumping Oil and Gas Industry Revenue (Million) Forecast, by Application 2019 & 2032
- Table 8: Mexico North America Pressure Pumping Oil and Gas Industry Revenue (Million) Forecast, by Application 2019 & 2032
- Table 9: Rest of North America North America Pressure Pumping Oil and Gas Industry Revenue (Million) Forecast, by Application 2019 & 2032
- Table 10: North America Pressure Pumping Oil and Gas Industry Revenue Million Forecast, by Service Type 2019 & 2032
- Table 11: North America Pressure Pumping Oil and Gas Industry Revenue Million Forecast, by Well Type 2019 & 2032
- Table 12: North America Pressure Pumping Oil and Gas Industry Revenue Million Forecast, by Country 2019 & 2032
- Table 13: North America Pressure Pumping Oil and Gas Industry Revenue Million Forecast, by Service Type 2019 & 2032
- Table 14: North America Pressure Pumping Oil and Gas Industry Revenue Million Forecast, by Well Type 2019 & 2032
- Table 15: North America Pressure Pumping Oil and Gas Industry Revenue Million Forecast, by Country 2019 & 2032
- Table 16: North America Pressure Pumping Oil and Gas Industry Revenue Million Forecast, by Service Type 2019 & 2032
- Table 17: North America Pressure Pumping Oil and Gas Industry Revenue Million Forecast, by Well Type 2019 & 2032
- Table 18: North America Pressure Pumping Oil and Gas Industry Revenue Million Forecast, by Country 2019 & 2032
- Table 19: North America Pressure Pumping Oil and Gas Industry Revenue Million Forecast, by Service Type 2019 & 2032
- Table 20: North America Pressure Pumping Oil and Gas Industry Revenue Million Forecast, by Well Type 2019 & 2032
- Table 21: North America Pressure Pumping Oil and Gas Industry Revenue Million Forecast, by Country 2019 & 2032
- Table 22: North America Pressure Pumping Oil and Gas Industry Revenue Million Forecast, by Service Type 2019 & 2032
- Table 23: North America Pressure Pumping Oil and Gas Industry Revenue Million Forecast, by Well Type 2019 & 2032
- Table 24: North America Pressure Pumping Oil and Gas Industry Revenue Million Forecast, by Country 2019 & 2032
Frequently Asked Questions
1. What is the projected Compound Annual Growth Rate (CAGR) of the North America Pressure Pumping Oil and Gas Industry?
The projected CAGR is approximately > 7.00%.
2. Which companies are prominent players in the North America Pressure Pumping Oil and Gas Industry?
Key companies in the market include Trican Well Service Ltd, Superior Energy Services Inc, Baker Hughes Co, Schlumberger NV, Weatherford International PLC, Chevron Corporation, Saipem SpA, Halliburton Company, Shell PLC*List Not Exhaustive, Calfrac Well Services Ltd.
3. What are the main segments of the North America Pressure Pumping Oil and Gas Industry?
The market segments include Service Type, Well Type.
4. Can you provide details about the market size?
The market size is estimated to be USD XX Million as of 2022.
5. What are some drivers contributing to market growth?
Rapid Recovery in the Oil and Gas and Mining Industries4.; Surge in the Construction Industry.
6. What are the notable trends driving market growth?
Hydraulic Fracturing Expected to Dominate the Market.
7. Are there any restraints impacting market growth?
High Maintenance and Operation Costs of Submersible Pump Restrain the Market.
8. Can you provide examples of recent developments in the market?
In 2020, the United States achieved the most significant extensions and discoveries of proved crude oil reserves and lease condensates, which were discovered in Texas, New Mexico, and North Dakota. The operators in Texas added around 1.8 billion barrels, New Mexico had 0.7 billion barrels, and North Dakota had 0.2 billion barrels of extensions and discoveries. The discoveries are likely to give more development and production opportunities to the E&P companies, and hence the pressure pumping services too.
9. What pricing options are available for accessing the report?
Pricing options include single-user, multi-user, and enterprise licenses priced at USD 4750, USD 5250, and USD 8750 respectively.
10. Is the market size provided in terms of value or volume?
The market size is provided in terms of value, measured in Million.
11. Are there any specific market keywords associated with the report?
Yes, the market keyword associated with the report is "North America Pressure Pumping Oil and Gas Industry," which aids in identifying and referencing the specific market segment covered.
12. How do I determine which pricing option suits my needs best?
The pricing options vary based on user requirements and access needs. Individual users may opt for single-user licenses, while businesses requiring broader access may choose multi-user or enterprise licenses for cost-effective access to the report.
13. Are there any additional resources or data provided in the North America Pressure Pumping Oil and Gas Industry report?
While the report offers comprehensive insights, it's advisable to review the specific contents or supplementary materials provided to ascertain if additional resources or data are available.
14. How can I stay updated on further developments or reports in the North America Pressure Pumping Oil and Gas Industry?
To stay informed about further developments, trends, and reports in the North America Pressure Pumping Oil and Gas Industry, consider subscribing to industry newsletters, following relevant companies and organizations, or regularly checking reputable industry news sources and publications.
Methodology
Step 1 - Identification of Relevant Samples Size from Population Database


Step 2 - Approaches for Defining Global Market Size (Value, Volume* & Price*)

Note*: In applicable scenarios
Step 3 - Data Sources
Primary Research
- Web Analytics
- Survey Reports
- Research Institute
- Latest Research Reports
- Opinion Leaders
Secondary Research
- Annual Reports
- White Paper
- Latest Press Release
- Industry Association
- Paid Database
- Investor Presentations

Step 4 - Data Triangulation
Involves using different sources of information in order to increase the validity of a study
These sources are likely to be stakeholders in a program - participants, other researchers, program staff, other community members, and so on.
Then we put all data in single framework & apply various statistical tools to find out the dynamic on the market.
During the analysis stage, feedback from the stakeholder groups would be compared to determine areas of agreement as well as areas of divergence


