Key Insights
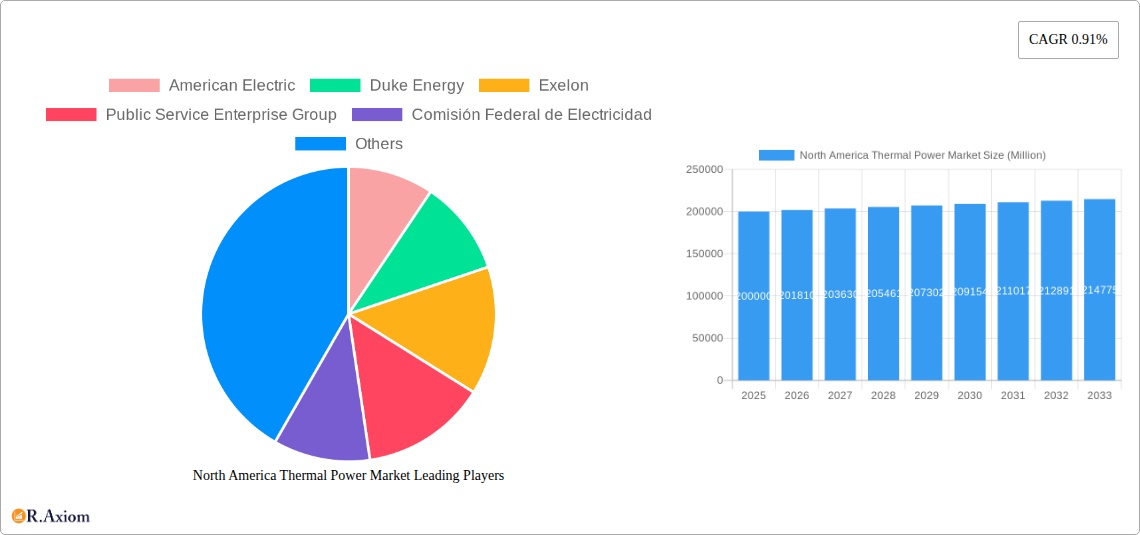
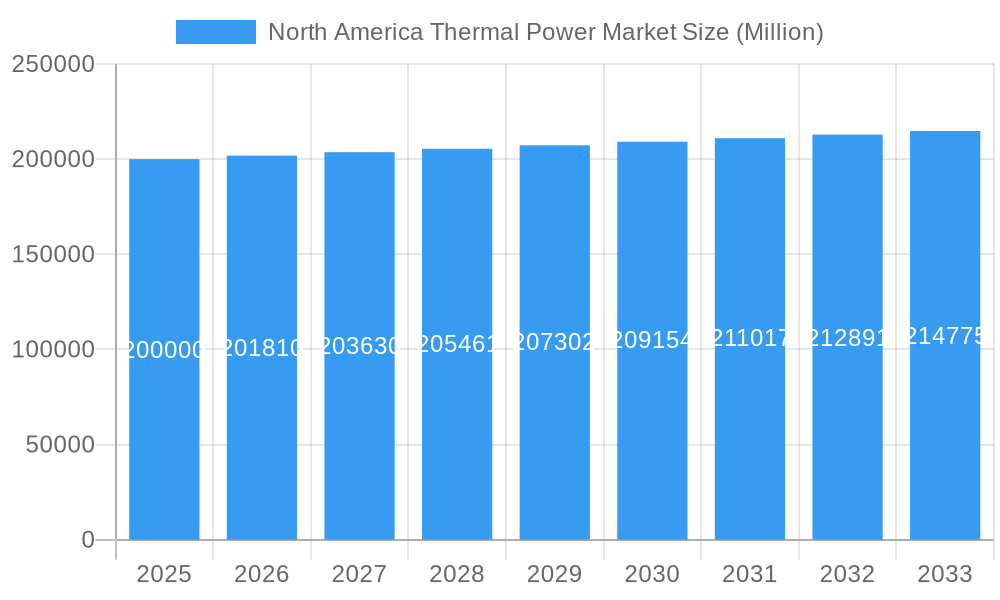
The North American thermal power market, including coal, natural gas, nuclear, and other fuel sources, is projected for steady expansion from 2025 to 2033. With an estimated 2025 market size of $1589.19 billion and a Compound Annual Growth Rate (CAGR) of 0.91%, the sector reflects a dynamic energy transition. Continued reliance on existing thermal power infrastructure, particularly natural gas plants due to their comparatively lower emissions, supports market stability. However, this growth is moderated by the accelerating adoption of renewable energy sources such as solar and wind power, creating downward pressure on the thermal sector. Stringent governmental regulations focused on carbon emission reduction serve as significant market restraints, compelling utility providers to diversify their energy portfolios and potentially retire older, less efficient coal-fired power plants. This strategic shift presents challenges for established entities like American Electric, Duke Energy, and Exelon, necessitating investments in infrastructure modernization and the exploration of alternative energy solutions. Market segmentation by fuel type indicates a declining share for coal, a stable presence for natural gas, and potential modest growth for nuclear energy, driven by energy security considerations and the need for reliable baseload power.
North America Thermal Power Market Market Size (In Million)
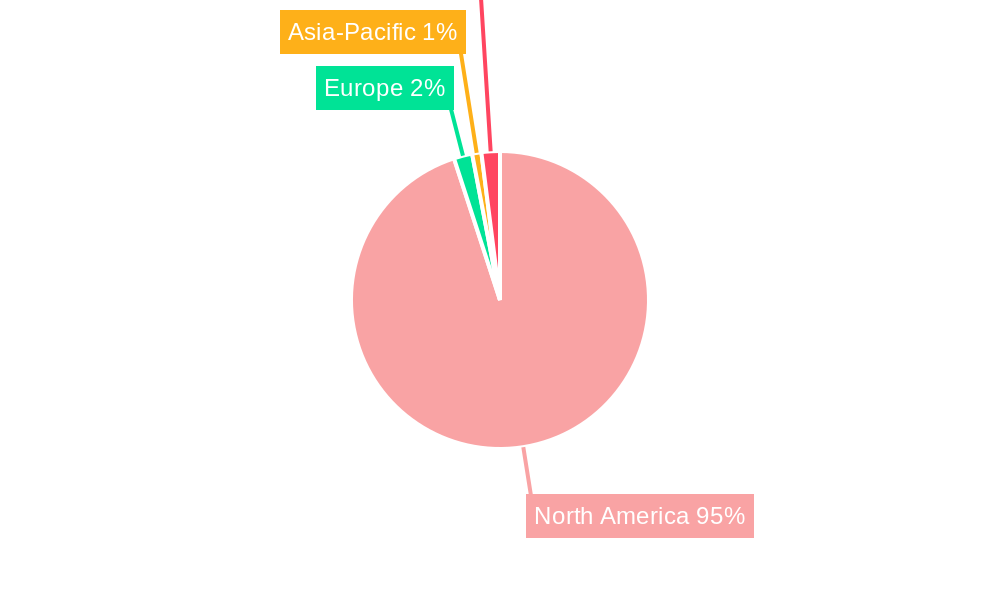
Geographically, the United States commands the largest share of the North American thermal power market, followed by Canada and Mexico. The "Rest of North America" segment comprises smaller utilities and independent power producers with comparatively slower growth trajectories. Within the United States, regulatory frameworks and the pace of renewable energy integration will be pivotal to market expansion. Economic growth and energy infrastructure development will similarly influence market dynamics in other regions. Throughout the forecast period, a gradual market share redistribution is anticipated, with natural gas-fired plants retaining a dominant position while coal plants undergo phased retirement and renewable energy sources steadily increase their contribution. The competitive arena is marked by consolidation, with major utility providers prioritizing efficiency gains and strategic adaptation to the evolving energy landscape.
North America Thermal Power Market Company Market Share
North America Thermal Power Market: A Comprehensive Report (2019-2033)
This in-depth report provides a comprehensive analysis of the North America thermal power market, covering the period from 2019 to 2033. It offers invaluable insights into market dynamics, growth drivers, challenges, and emerging opportunities, equipping stakeholders with actionable intelligence for strategic decision-making. The report encompasses detailed segmentation by fuel type (Coal, Gas, Nuclear, Other Fuel Types), regional analysis, and competitive landscape profiling of key players. With a focus on the latest industry developments and future projections, this report is an essential resource for businesses, investors, and policymakers navigating the evolving North American energy landscape.
North America Thermal Power Market Market Concentration & Innovation
The North American thermal power market exhibits a moderately concentrated structure, with a handful of major players holding significant market share. American Electric, Duke Energy, Exelon, Public Service Enterprise Group, Comisión Federal de Electricidad, Consolidated Edison, Dominion Energy, Xcel Energy, Southern Company, and NextEra Energy are among the dominant forces, collectively controlling an estimated xx% of the market in 2025. However, the market is witnessing increased competition from smaller independent power producers and renewable energy companies.
Market concentration is influenced by factors such as economies of scale, access to capital, regulatory approvals, and strategic acquisitions. Innovation plays a crucial role in shaping the market's trajectory. Technological advancements in gas turbine efficiency, emissions control technologies, and the integration of renewable energy sources (such as green hydrogen) are key drivers. Regulatory frameworks, including emissions standards and renewable portfolio standards, significantly impact market dynamics. The increasing adoption of stricter environmental regulations is driving the shift towards cleaner fuel sources and more efficient technologies. Product substitutes, such as renewable energy sources (solar, wind), are putting pressure on traditional thermal power. End-user trends towards decarbonization are also affecting the market.
Mergers and acquisitions (M&A) activity remains a significant factor. Notable recent transactions include JERA Americas Inc.'s acquisition of thermal power generation projects in Massachusetts and Maine (May 2022). This deal, valued at an estimated xx Million, highlights the ongoing consolidation within the industry. The value of M&A deals in the North American thermal power market averaged xx Million annually over the historical period, with a projected increase in the forecast period due to ongoing industry restructuring.
North America Thermal Power Market Industry Trends & Insights
The North American thermal power market is experiencing a period of significant transformation driven by several key trends. The market experienced a CAGR of xx% during the historical period (2019-2024) and is projected to grow at a CAGR of xx% during the forecast period (2025-2033). This growth is primarily driven by increasing electricity demand, particularly in rapidly developing regions. However, this growth is constrained by increasing environmental concerns and the rapid growth of renewable energy sources. The market penetration of thermal power is expected to decline gradually from xx% in 2025 to xx% by 2033, as cleaner energy sources gain traction.
Technological disruptions, such as the integration of advanced gas turbines and carbon capture technologies, are reshaping the competitive landscape. Consumer preferences for cleaner energy are forcing a shift towards natural gas and exploring innovative solutions like green hydrogen. The increasing cost of coal and stricter environmental regulations have also contributed to the growth of gas-fired thermal power plants. The competitive dynamics are influenced by factors like fuel price volatility, regulatory policies, and the emergence of new technologies.
Dominant Markets & Segments in North America Thermal Power Market
The United States currently dominates the North American thermal power market, accounting for the largest share of installed capacity and electricity generation. This dominance stems from several factors:
- Robust economic activity: The strong US economy fuels high energy demand.
- Extensive existing infrastructure: The country has a well-established network of power plants and transmission lines.
- Government policies: While increasingly focused on renewable energy, government policies continue to support the thermal power sector, especially natural gas.
Within the fuel type segments, natural gas currently holds the largest share due to its relatively lower emissions compared to coal and its abundant supply in North America. Nuclear power maintains a significant share, fueled by the existing fleet of nuclear power plants. Coal's share is declining due to increasing environmental concerns and higher operational costs. The "Other Fuel Types" segment includes biomass and oil, which hold smaller shares.
The future dominance of natural gas is predicted to be gradually eroded by the growth of renewables. However, natural gas is expected to remain a significant player due to its role in providing reliable baseload power and its flexibility for peak demand.
North America Thermal Power Market Product Developments
Recent product innovations focus on enhancing efficiency, reducing emissions, and improving flexibility. Advanced gas turbines with higher efficiency rates and carbon capture technologies are gaining traction. Furthermore, the integration of renewable energy sources like green hydrogen into existing thermal power plants is emerging as a key area of development. This addresses the need for reliable power generation while mitigating environmental concerns. These advancements aim to enhance the competitiveness of thermal power in the evolving energy landscape.
Report Scope & Segmentation Analysis
This report segments the North American thermal power market primarily by fuel type:
Coal: The coal segment is characterized by declining capacity due to environmental regulations and increasing costs. The market size is expected to decrease from xx Million in 2025 to xx Million by 2033. Competition is primarily among existing large players.
Gas: The natural gas segment is the dominant segment, experiencing moderate growth due to its relatively lower emissions and efficient power generation capabilities. The market size is projected to be xx Million in 2025 and xx Million in 2033. Competition is intense among existing players and new entrants focused on gas-fired combined-cycle power plants.
Nuclear: The nuclear segment experiences stable growth with ongoing operations of existing plants. It has a market size of xx Million in 2025 and is projected to reach xx Million in 2033. Competitive dynamics are shaped by regulatory approvals, operational safety, and waste management considerations.
Other Fuel Types: This segment encompasses biomass and oil, with relatively small market sizes and slow growth. Market size is expected to remain relatively stable over the forecast period.
Key Drivers of North America Thermal Power Market Growth
Several factors drive the growth of the North American thermal power market: increasing electricity demand from residential, commercial, and industrial sectors; existing infrastructure supporting thermal power generation; and continued operation of existing power plants, particularly gas-fired plants. Furthermore, the development and implementation of carbon capture technologies and the integration of renewable sources like green hydrogen offer new growth opportunities within the thermal sector, mitigating negative environmental impacts.
Challenges in the North America Thermal Power Market Sector
The North American thermal power market faces challenges: stringent environmental regulations leading to higher compliance costs; fluctuating fuel prices impacting profitability; and competition from renewable energy sources reducing market share. Additionally, concerns over greenhouse gas emissions and the increasing public pressure for decarbonization create significant headwinds for thermal power. The impact of these factors is projected to lead to a reduction in the market share of thermal power in the forecast period.
Emerging Opportunities in North America Thermal Power Market
Emerging opportunities include the integration of renewable energy sources with thermal power plants, the development of carbon capture technologies to reduce emissions, and exploring the use of innovative fuel sources such as green hydrogen. These opportunities offer pathways to mitigate the negative environmental impacts of thermal power generation while maintaining its role in providing reliable electricity supply. Focus on improving efficiency and enhancing flexibility to meet fluctuating energy demands will provide further opportunities for growth.
Leading Players in the North America Thermal Power Market Market
- American Electric Power
- Duke Energy
- Exelon
- Public Service Enterprise Group
- Comisión Federal de Electricidad
- Consolidated Edison
- Dominion Energy
- Xcel Energy
- Southern Company
- NextEra Energy
Key Developments in North America Thermal Power Market Industry
November 2023: GE Vernova’s Gas Power business announced its support for Duke Energy's green hydrogen system at its DeBary plant, representing a significant step towards decarbonizing the thermal power sector. This development signals a shift towards cleaner energy sources within the industry.
November 2022: The addition of 7,775 MW of natural gas-fired CCGT capacity demonstrates continued investment in the sector, although the long-term implications due to decarbonization pressures are yet to be seen.
May 2022: JERA Americas Inc.'s acquisition of thermal power assets highlights ongoing consolidation and investment in the sector, albeit facing potential challenges from increased renewable energy penetration.
Strategic Outlook for North America Thermal Power Market Market
The North American thermal power market is poised for a period of transition. While the market will continue to generate a substantial amount of electricity, its share is expected to decrease gradually due to the increasing adoption of renewable energy and stricter environmental regulations. However, opportunities remain for thermal power generation companies that embrace innovation, focusing on improving efficiency, reducing emissions, and integrating renewable energy sources. The strategic focus should be on adapting to the changing energy landscape by investing in cleaner technologies and flexible power generation solutions to maintain a significant role in the future energy mix.
North America Thermal Power Market Segmentation
-
1. Fuel Type
- 1.1. Coal
- 1.2. Gas
- 1.3. Nuclear
- 1.4. Other Fuel Types
-
2. Geography
- 2.1. United States
- 2.2. Canada
- 2.3. Mexico
North America Thermal Power Market Segmentation By Geography
- 1. United States
- 2. Canada
- 3. Mexico
North America Thermal Power Market Regional Market Share
Geographic Coverage of North America Thermal Power Market
North America Thermal Power Market REPORT HIGHLIGHTS
| Aspects | Details |
|---|---|
| Study Period | 2020-2034 |
| Base Year | 2025 |
| Estimated Year | 2026 |
| Forecast Period | 2026-2034 |
| Historical Period | 2020-2025 |
| Growth Rate | CAGR of 0.91% from 2020-2034 |
| Segmentation |
|
Table of Contents
- 1. Introduction
- 1.1. Research Scope
- 1.2. Market Segmentation
- 1.3. Research Methodology
- 1.4. Definitions and Assumptions
- 2. Executive Summary
- 2.1. Introduction
- 3. Market Dynamics
- 3.1. Introduction
- 3.2. Market Drivers
- 3.2.1. 4.; Increasing Investments in Thermal Power Plants
- 3.3. Market Restrains
- 3.3.1. 4.; Increase in Renewable Energy Share in the Total Power Generation Mix
- 3.4. Market Trends
- 3.4.1. Natural Gas to Dominate the Market
- 4. Market Factor Analysis
- 4.1. Porters Five Forces
- 4.2. Supply/Value Chain
- 4.3. PESTEL analysis
- 4.4. Market Entropy
- 4.5. Patent/Trademark Analysis
- 5. North America Thermal Power Market Analysis, Insights and Forecast, 2020-2032
- 5.1. Market Analysis, Insights and Forecast - by Fuel Type
- 5.1.1. Coal
- 5.1.2. Gas
- 5.1.3. Nuclear
- 5.1.4. Other Fuel Types
- 5.2. Market Analysis, Insights and Forecast - by Geography
- 5.2.1. United States
- 5.2.2. Canada
- 5.2.3. Mexico
- 5.3. Market Analysis, Insights and Forecast - by Region
- 5.3.1. United States
- 5.3.2. Canada
- 5.3.3. Mexico
- 5.1. Market Analysis, Insights and Forecast - by Fuel Type
- 6. United States North America Thermal Power Market Analysis, Insights and Forecast, 2020-2032
- 6.1. Market Analysis, Insights and Forecast - by Fuel Type
- 6.1.1. Coal
- 6.1.2. Gas
- 6.1.3. Nuclear
- 6.1.4. Other Fuel Types
- 6.2. Market Analysis, Insights and Forecast - by Geography
- 6.2.1. United States
- 6.2.2. Canada
- 6.2.3. Mexico
- 6.1. Market Analysis, Insights and Forecast - by Fuel Type
- 7. Canada North America Thermal Power Market Analysis, Insights and Forecast, 2020-2032
- 7.1. Market Analysis, Insights and Forecast - by Fuel Type
- 7.1.1. Coal
- 7.1.2. Gas
- 7.1.3. Nuclear
- 7.1.4. Other Fuel Types
- 7.2. Market Analysis, Insights and Forecast - by Geography
- 7.2.1. United States
- 7.2.2. Canada
- 7.2.3. Mexico
- 7.1. Market Analysis, Insights and Forecast - by Fuel Type
- 8. Mexico North America Thermal Power Market Analysis, Insights and Forecast, 2020-2032
- 8.1. Market Analysis, Insights and Forecast - by Fuel Type
- 8.1.1. Coal
- 8.1.2. Gas
- 8.1.3. Nuclear
- 8.1.4. Other Fuel Types
- 8.2. Market Analysis, Insights and Forecast - by Geography
- 8.2.1. United States
- 8.2.2. Canada
- 8.2.3. Mexico
- 8.1. Market Analysis, Insights and Forecast - by Fuel Type
- 9. Competitive Analysis
- 9.1. Market Share Analysis 2025
- 9.2. Company Profiles
- 9.2.1 American Electric
- 9.2.1.1. Overview
- 9.2.1.2. Products
- 9.2.1.3. SWOT Analysis
- 9.2.1.4. Recent Developments
- 9.2.1.5. Financials (Based on Availability)
- 9.2.2 Duke Energy
- 9.2.2.1. Overview
- 9.2.2.2. Products
- 9.2.2.3. SWOT Analysis
- 9.2.2.4. Recent Developments
- 9.2.2.5. Financials (Based on Availability)
- 9.2.3 Exelon
- 9.2.3.1. Overview
- 9.2.3.2. Products
- 9.2.3.3. SWOT Analysis
- 9.2.3.4. Recent Developments
- 9.2.3.5. Financials (Based on Availability)
- 9.2.4 Public Service Enterprise Group
- 9.2.4.1. Overview
- 9.2.4.2. Products
- 9.2.4.3. SWOT Analysis
- 9.2.4.4. Recent Developments
- 9.2.4.5. Financials (Based on Availability)
- 9.2.5 Comisión Federal de Electricidad
- 9.2.5.1. Overview
- 9.2.5.2. Products
- 9.2.5.3. SWOT Analysis
- 9.2.5.4. Recent Developments
- 9.2.5.5. Financials (Based on Availability)
- 9.2.6 Consolidated Edison
- 9.2.6.1. Overview
- 9.2.6.2. Products
- 9.2.6.3. SWOT Analysis
- 9.2.6.4. Recent Developments
- 9.2.6.5. Financials (Based on Availability)
- 9.2.7 Dominion Energy
- 9.2.7.1. Overview
- 9.2.7.2. Products
- 9.2.7.3. SWOT Analysis
- 9.2.7.4. Recent Developments
- 9.2.7.5. Financials (Based on Availability)
- 9.2.8 Xcel Energy
- 9.2.8.1. Overview
- 9.2.8.2. Products
- 9.2.8.3. SWOT Analysis
- 9.2.8.4. Recent Developments
- 9.2.8.5. Financials (Based on Availability)
- 9.2.9 Southern Company
- 9.2.9.1. Overview
- 9.2.9.2. Products
- 9.2.9.3. SWOT Analysis
- 9.2.9.4. Recent Developments
- 9.2.9.5. Financials (Based on Availability)
- 9.2.10 NextEra Energy
- 9.2.10.1. Overview
- 9.2.10.2. Products
- 9.2.10.3. SWOT Analysis
- 9.2.10.4. Recent Developments
- 9.2.10.5. Financials (Based on Availability)
- 9.2.1 American Electric
List of Figures
- Figure 1: North America Thermal Power Market Revenue Breakdown (billion, %) by Product 2025 & 2033
- Figure 2: North America Thermal Power Market Share (%) by Company 2025
List of Tables
- Table 1: North America Thermal Power Market Revenue billion Forecast, by Fuel Type 2020 & 2033
- Table 2: North America Thermal Power Market Volume gigawatt Forecast, by Fuel Type 2020 & 2033
- Table 3: North America Thermal Power Market Revenue billion Forecast, by Geography 2020 & 2033
- Table 4: North America Thermal Power Market Volume gigawatt Forecast, by Geography 2020 & 2033
- Table 5: North America Thermal Power Market Revenue billion Forecast, by Region 2020 & 2033
- Table 6: North America Thermal Power Market Volume gigawatt Forecast, by Region 2020 & 2033
- Table 7: North America Thermal Power Market Revenue billion Forecast, by Fuel Type 2020 & 2033
- Table 8: North America Thermal Power Market Volume gigawatt Forecast, by Fuel Type 2020 & 2033
- Table 9: North America Thermal Power Market Revenue billion Forecast, by Geography 2020 & 2033
- Table 10: North America Thermal Power Market Volume gigawatt Forecast, by Geography 2020 & 2033
- Table 11: North America Thermal Power Market Revenue billion Forecast, by Country 2020 & 2033
- Table 12: North America Thermal Power Market Volume gigawatt Forecast, by Country 2020 & 2033
- Table 13: North America Thermal Power Market Revenue billion Forecast, by Fuel Type 2020 & 2033
- Table 14: North America Thermal Power Market Volume gigawatt Forecast, by Fuel Type 2020 & 2033
- Table 15: North America Thermal Power Market Revenue billion Forecast, by Geography 2020 & 2033
- Table 16: North America Thermal Power Market Volume gigawatt Forecast, by Geography 2020 & 2033
- Table 17: North America Thermal Power Market Revenue billion Forecast, by Country 2020 & 2033
- Table 18: North America Thermal Power Market Volume gigawatt Forecast, by Country 2020 & 2033
- Table 19: North America Thermal Power Market Revenue billion Forecast, by Fuel Type 2020 & 2033
- Table 20: North America Thermal Power Market Volume gigawatt Forecast, by Fuel Type 2020 & 2033
- Table 21: North America Thermal Power Market Revenue billion Forecast, by Geography 2020 & 2033
- Table 22: North America Thermal Power Market Volume gigawatt Forecast, by Geography 2020 & 2033
- Table 23: North America Thermal Power Market Revenue billion Forecast, by Country 2020 & 2033
- Table 24: North America Thermal Power Market Volume gigawatt Forecast, by Country 2020 & 2033
Frequently Asked Questions
1. What is the projected Compound Annual Growth Rate (CAGR) of the North America Thermal Power Market?
The projected CAGR is approximately 0.91%.
2. Which companies are prominent players in the North America Thermal Power Market?
Key companies in the market include American Electric, Duke Energy, Exelon, Public Service Enterprise Group, Comisión Federal de Electricidad, Consolidated Edison, Dominion Energy, Xcel Energy, Southern Company, NextEra Energy.
3. What are the main segments of the North America Thermal Power Market?
The market segments include Fuel Type, Geography.
4. Can you provide details about the market size?
The market size is estimated to be USD 1589.19 billion as of 2022.
5. What are some drivers contributing to market growth?
4.; Increasing Investments in Thermal Power Plants.
6. What are the notable trends driving market growth?
Natural Gas to Dominate the Market.
7. Are there any restraints impacting market growth?
4.; Increase in Renewable Energy Share in the Total Power Generation Mix.
8. Can you provide examples of recent developments in the market?
November 2023: GE Vernova’s Gas Power business announced that it would support the development of an end-to-end green hydrogen system that Duke Energy plans to build and operate at its DeBary plant, located in Volusia County, Florida, near Orlando. When operational in 2024, the new hydrogen system will provide peak power to Duke’s customers at times of increased electricity demand. The plant is expected to be the first in the United States and among the world’s first power plants to produce and use green hydrogen to power a gas turbine for peaking power applications when the grid requires additional electrical generation to meet demand. The production, storage, and end-use will be co-located at the DeBary power plant. GE Vernova will support the integration of the turbine with green hydrogen, including the upgrade of one of the four GE 7E gas turbines installed at the site to accommodate hydrogen fuel blends of significant volumes.
9. What pricing options are available for accessing the report?
Pricing options include single-user, multi-user, and enterprise licenses priced at USD 4750, USD 5250, and USD 8750 respectively.
10. Is the market size provided in terms of value or volume?
The market size is provided in terms of value, measured in billion and volume, measured in gigawatt.
11. Are there any specific market keywords associated with the report?
Yes, the market keyword associated with the report is "North America Thermal Power Market," which aids in identifying and referencing the specific market segment covered.
12. How do I determine which pricing option suits my needs best?
The pricing options vary based on user requirements and access needs. Individual users may opt for single-user licenses, while businesses requiring broader access may choose multi-user or enterprise licenses for cost-effective access to the report.
13. Are there any additional resources or data provided in the North America Thermal Power Market report?
While the report offers comprehensive insights, it's advisable to review the specific contents or supplementary materials provided to ascertain if additional resources or data are available.
14. How can I stay updated on further developments or reports in the North America Thermal Power Market?
To stay informed about further developments, trends, and reports in the North America Thermal Power Market, consider subscribing to industry newsletters, following relevant companies and organizations, or regularly checking reputable industry news sources and publications.
Methodology
Step 1 - Identification of Relevant Samples Size from Population Database


Step 2 - Approaches for Defining Global Market Size (Value, Volume* & Price*)

Note*: In applicable scenarios
Step 3 - Data Sources
Primary Research
- Web Analytics
- Survey Reports
- Research Institute
- Latest Research Reports
- Opinion Leaders
Secondary Research
- Annual Reports
- White Paper
- Latest Press Release
- Industry Association
- Paid Database
- Investor Presentations

Step 4 - Data Triangulation
Involves using different sources of information in order to increase the validity of a study
These sources are likely to be stakeholders in a program - participants, other researchers, program staff, other community members, and so on.
Then we put all data in single framework & apply various statistical tools to find out the dynamic on the market.
During the analysis stage, feedback from the stakeholder groups would be compared to determine areas of agreement as well as areas of divergence

