
Key Insights
The North Sea oil and gas industry, while facing headwinds, presents a complex and evolving market landscape. The industry's historical period (2019-2024) likely experienced fluctuating growth due to global energy price volatility and the increasing push towards renewable energy sources. However, a CAGR exceeding 3% from 2025 onwards suggests a sustained, albeit moderate, expansion. This growth is likely driven by several factors. Firstly, continued demand for oil and gas, particularly from European markets, remains a significant factor. While renewable energy adoption accelerates, the transition period requires continued reliance on fossil fuels to meet energy demands, thereby supporting North Sea production. Secondly, technological advancements in exploration and extraction, such as improved subsea technologies and enhanced oil recovery techniques, contribute to increased efficiency and profitability. Finally, existing infrastructure and established operational expertise within the region provide a competitive advantage. However, the industry faces considerable constraints. These include depleting reserves in mature fields, stringent environmental regulations and increasing pressure to reduce carbon emissions. The regulatory landscape pushes operators to adopt more sustainable practices, impacting profitability and potentially influencing investment decisions.
Segment-wise, the Upstream sector (exploration and production) will likely remain the largest, though its growth might be tempered by reserve depletion. The Midstream (transportation and storage) sector offers relatively stable growth potential due to the existing pipeline network and its critical role in delivering North Sea resources. The Downstream sector (refining and marketing) is expected to see growth linked to regional demand and global energy price fluctuations. Key players like Equinor ASA, TotalEnergies, BP Plc, and Shell Plc continue to play a significant role, although their strategies are adapting to the evolving energy landscape, with increased investments in renewable energy and carbon capture technologies. The geographic distribution of activity will likely remain concentrated in the UK, Norway, and potentially Denmark, reflecting the location of existing infrastructure and favorable regulatory frameworks. While the overall market exhibits moderate growth, specific segments and geographic areas will experience varying levels of expansion and contraction based on their individual factors.
North Sea Region Oil & Gas Industry: A Comprehensive Market Report (2019-2033)
This in-depth report provides a comprehensive analysis of the North Sea Region Oil & Gas industry, covering the period from 2019 to 2033. It offers actionable insights into market dynamics, competitive landscapes, and future growth opportunities, making it an essential resource for industry stakeholders, investors, and strategic decision-makers. The report leverages robust data analysis and forecasts to illuminate key trends and challenges within the upstream, midstream, and downstream sectors. The study period spans 2019-2033, with 2025 serving as both the base and estimated year. The forecast period is 2025-2033, and the historical period covers 2019-2024. Total market values are expressed in Millions.
North Sea Region Oil & Gas Industry Market Concentration & Innovation
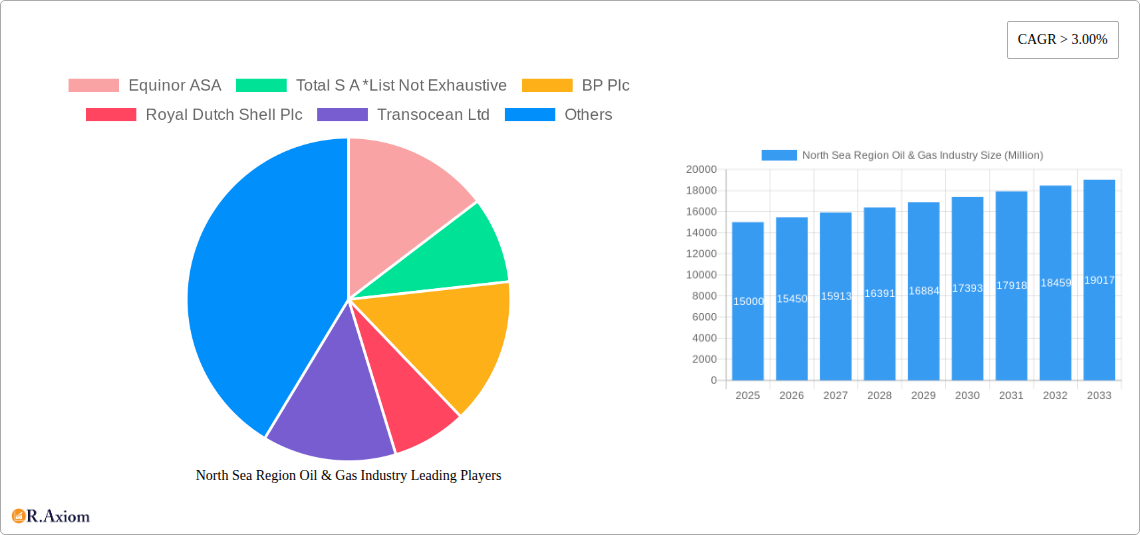
This section analyzes the competitive landscape of the North Sea oil and gas industry, examining market concentration, innovation drivers, regulatory frameworks, product substitutes, end-user trends, and mergers & acquisitions (M&A) activity. Key players, including Equinor ASA, TotalEnergies SE, BP Plc, Royal Dutch Shell Plc, and others, are assessed based on their market share and strategic initiatives.
The market exhibits moderate concentration, with a few major players dominating significant portions of the upstream sector. The combined market share of the top five companies in the upstream segment is estimated at 65% in 2025. M&A activity in the historical period (2019-2024) totalled approximately $XX Million, driven primarily by consolidation in the upstream and midstream segments. Innovation is driven by the need for cost reduction, enhanced recovery techniques, and the growing adoption of digital technologies. Strict regulatory frameworks focused on safety and environmental protection influence industry practices. Substitutes, such as renewable energy sources, pose an increasing challenge, albeit at varying degrees of impact across segments. End-user demand, predominantly driven by industrial and transportation sectors, dictates market volume, albeit with fluctuations based on geopolitical factors.
- Market Share: Top 5 Upstream Companies: 65% (2025 Estimate)
- M&A Activity (2019-2024): $XX Million
- Key Innovation Drivers: Cost reduction, enhanced oil recovery (EOR), digitalization.
- Regulatory Focus: Safety, environmental protection.
North Sea Region Oil & Gas Industry Industry Trends & Insights
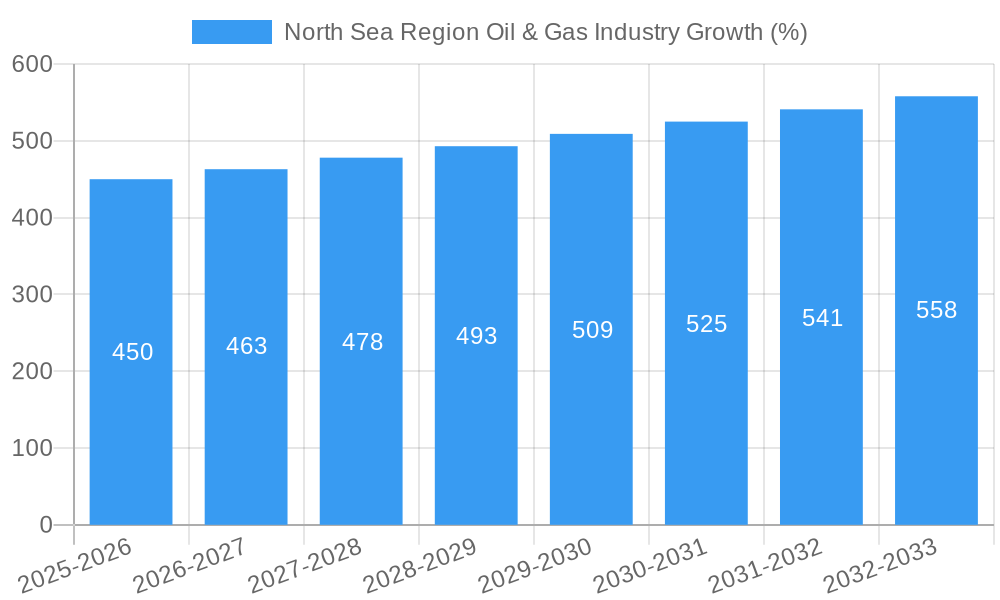
This section delves into the key trends shaping the North Sea oil and gas industry. The compound annual growth rate (CAGR) for the overall market during the forecast period (2025-2033) is projected at 2.5%. Market penetration of new technologies, such as carbon capture and storage (CCS), is slowly increasing but faces challenges. Growth is being driven by factors such as increasing global energy demand (albeit with fluctuations due to economic cycles), the exploration of new reserves, and strategic investments in infrastructure projects. However, the industry is also facing considerable headwinds, including intensifying competition, regulatory hurdles, and the global push towards a low-carbon energy future. Consumer preferences are increasingly aligned with environmental sustainability, putting pressure on companies to adopt cleaner technologies and reduce their carbon footprint. The competitive dynamics are characterized by ongoing consolidation, technological advancements, and a focus on efficiency improvements.
The projected CAGR of 2.5% reflects a moderate yet steady growth trajectory. Further analysis reveals that the upstream segment, although still dominant, will experience a slightly slower growth rate due to depletion of existing reserves. Midstream and downstream segments are projected to show higher growth rates, driven by increasing demand for refined products and investment in pipeline infrastructure. Market penetration of CCS technology, for example, is estimated to reach 5% by 2033, reflecting a slow but steady adoption.
Dominant Markets & Segments in North Sea Region Oil & Gas Industry
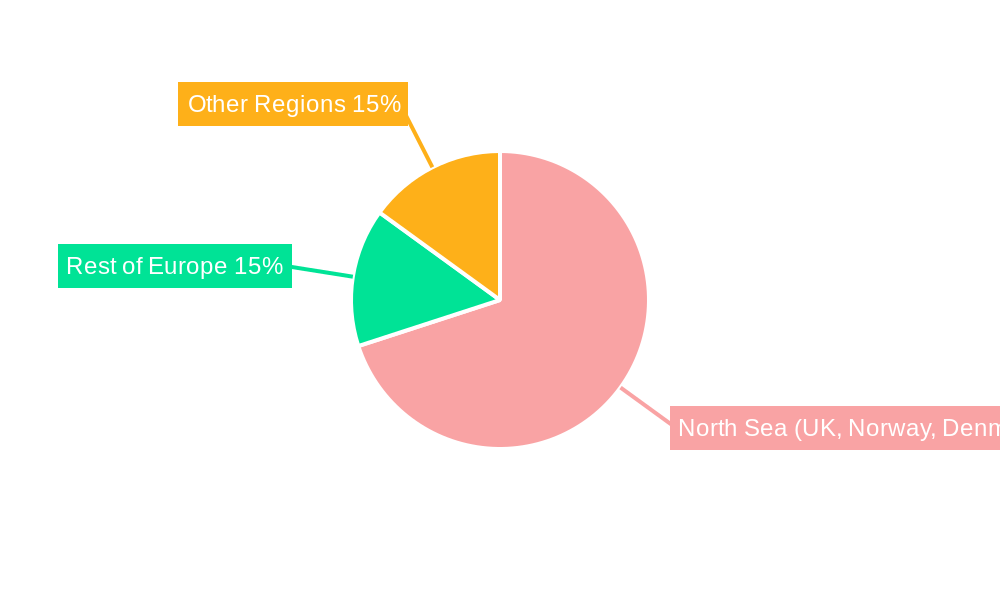
The United Kingdom remains the dominant market in the North Sea region, driven by established infrastructure and a sizable existing resource base. Norway also holds significant importance due to its substantial oil and gas reserves and proactive government policies supportive of the industry.
Upstream Sector Dominance:
- Key Drivers: Established infrastructure, extensive reserves, supportive government policies (e.g., tax incentives).
- Dominant Players: Equinor ASA, BP Plc, Royal Dutch Shell Plc.
Midstream Sector Dominance:
- Key Drivers: Strategic pipeline networks connecting production sites to refineries and export terminals, efficient logistical networks.
- Dominant Players: Various pipeline operators and infrastructure companies.
Downstream Sector Dominance:
- Key Drivers: Proximity to major European markets, robust refining capacity, efficient distribution networks.
- Dominant Players: Refineries owned by major international oil and gas companies and independent operators.
The analysis indicates that the upstream sector, while remaining the largest, will witness a relative decrease in dominance compared to the midstream and downstream sectors over the forecast period. This shift stems from an increasing focus on infrastructure development and value-added activities within the downstream segment.
North Sea Region Oil & Gas Industry Product Developments
Recent product innovations focus on enhancing oil recovery, improving environmental performance, and optimizing operational efficiency. This includes advancements in drilling technology, subsea production systems, and digitalization initiatives that aim to improve safety, reduce costs, and enhance decision-making. The market is witnessing a shift towards more sustainable practices, with an increased emphasis on carbon capture and storage (CCS) technologies and renewable energy integration. These technological improvements enhance the competitiveness of the North Sea oil and gas sector by improving safety, efficiency, and environmental performance.
Report Scope & Segmentation Analysis
This report segments the North Sea oil & gas market into Upstream, Midstream, and Downstream sectors.
Upstream: This segment encompasses exploration, drilling, and production of crude oil and natural gas. It is projected to maintain its largest market share but experience slower growth than other segments due to the mature nature of many North Sea fields.
Midstream: This segment involves the transportation, storage, and processing of oil and gas. This segment's growth is expected to be relatively strong driven by infrastructure investments and growing demand for efficient transportation.
Downstream: This segment includes refining, marketing, and distribution of petroleum products. It is anticipated to witness robust growth due to the increasing demand for refined petroleum products, especially in European markets.
Key Drivers of North Sea Region Oil & Gas Industry Growth
Several factors contribute to the growth of the North Sea oil and gas industry. These include technological advancements leading to enhanced oil recovery, government incentives stimulating exploration and production, and ongoing investment in infrastructure modernization. Furthermore, the strategic location of the North Sea, with proximity to major European energy markets, continues to bolster demand for its resources.
Challenges in the North Sea Region Oil & Gas Industry Sector
The industry faces challenges, including depleting reserves in mature fields, increasing operational costs, stringent environmental regulations, and intense competition. Fluctuations in global oil and gas prices also significantly impact profitability, and the transition toward renewable energy sources poses a long-term threat to traditional fossil fuel businesses. Supply chain disruptions and skilled labor shortages also present operational challenges.
Emerging Opportunities in North Sea Region Oil & Gas Industry
Opportunities exist in enhanced oil recovery techniques, carbon capture and storage technologies, and the exploration of new unconventional resources. The development of offshore wind power and the integration of renewable energy sources within oil and gas operations could offer diversification avenues for companies. Furthermore, digitalization and data analytics offer significant potential for enhancing efficiency and optimizing operations.
Leading Players in the North Sea Region Oil & Gas Industry Market
- Equinor ASA
- TotalEnergies SE
- BP Plc
- Royal Dutch Shell Plc
- Transocean Ltd
- Baker Hughes Company
- Halliburton Company
- Seadrill Ltd
- Schlumberger Limited
- Valaris PLC
Key Developments in North Sea Region Oil & Gas Industry Industry
- 2022-Q4: Equinor ASA announced a significant investment in CCS technology.
- 2023-Q1: BP Plc initiated a major exploration project in the UK sector of the North Sea.
- 2023-Q2: A merger between two smaller exploration companies was completed. (Further details would be added in the full report.)
(Note: A full report would include a more comprehensive list of key developments.)
Strategic Outlook for North Sea Region Oil & Gas Industry Market
The future of the North Sea oil and gas industry will be shaped by the interplay of factors, including technological innovation, government policies, and evolving consumer preferences. While mature fields present challenges, opportunities remain in enhanced oil recovery, new exploration ventures, and the development of lower-carbon technologies. The region's strategic location and existing infrastructure base provide a solid foundation for continued industry activity. The successful integration of renewable energy sources and a focus on sustainability will be essential for ensuring the long-term viability of the sector.
North Sea Region Oil & Gas Industry Segmentation
-
1. Sector
- 1.1. Upstream
- 1.2. Midstream
- 1.3. Downstream
North Sea Region Oil & Gas Industry Segmentation By Geography
- 1. United Kingdom
- 2. Norway
- 3. Rest of North Sea Region
North Sea Region Oil & Gas Industry REPORT HIGHLIGHTS
| Aspects | Details |
|---|---|
| Study Period | 2019-2033 |
| Base Year | 2024 |
| Estimated Year | 2025 |
| Forecast Period | 2025-2033 |
| Historical Period | 2019-2024 |
| Growth Rate | CAGR of > 3.00% from 2019-2033 |
| Segmentation |
|
Table of Contents
- 1. Introduction
- 1.1. Research Scope
- 1.2. Market Segmentation
- 1.3. Research Methodology
- 1.4. Definitions and Assumptions
- 2. Executive Summary
- 2.1. Introduction
- 3. Market Dynamics
- 3.1. Introduction
- 3.2. Market Drivers
- 3.2.1. 4.; Increased Government Regulations for Greenhouse Gas Emissions 4.; Encouraging Production and Consumption of Renewable Aviation Fuel
- 3.3. Market Restrains
- 3.3.1. 4.; The High Costs of Renewable Aviation Fuel
- 3.4. Market Trends
- 3.4.1. Upstream Sector to Dominate the Market
- 4. Market Factor Analysis
- 4.1. Porters Five Forces
- 4.2. Supply/Value Chain
- 4.3. PESTEL analysis
- 4.4. Market Entropy
- 4.5. Patent/Trademark Analysis
- 5. Global North Sea Region Oil & Gas Industry Analysis, Insights and Forecast, 2019-2031
- 5.1. Market Analysis, Insights and Forecast - by Sector
- 5.1.1. Upstream
- 5.1.2. Midstream
- 5.1.3. Downstream
- 5.2. Market Analysis, Insights and Forecast - by Region
- 5.2.1. United Kingdom
- 5.2.2. Norway
- 5.2.3. Rest of North Sea Region
- 5.1. Market Analysis, Insights and Forecast - by Sector
- 6. United Kingdom North Sea Region Oil & Gas Industry Analysis, Insights and Forecast, 2019-2031
- 6.1. Market Analysis, Insights and Forecast - by Sector
- 6.1.1. Upstream
- 6.1.2. Midstream
- 6.1.3. Downstream
- 6.1. Market Analysis, Insights and Forecast - by Sector
- 7. Norway North Sea Region Oil & Gas Industry Analysis, Insights and Forecast, 2019-2031
- 7.1. Market Analysis, Insights and Forecast - by Sector
- 7.1.1. Upstream
- 7.1.2. Midstream
- 7.1.3. Downstream
- 7.1. Market Analysis, Insights and Forecast - by Sector
- 8. Rest of North Sea Region North Sea Region Oil & Gas Industry Analysis, Insights and Forecast, 2019-2031
- 8.1. Market Analysis, Insights and Forecast - by Sector
- 8.1.1. Upstream
- 8.1.2. Midstream
- 8.1.3. Downstream
- 8.1. Market Analysis, Insights and Forecast - by Sector
- 9. North America North Sea Region Oil & Gas Industry Analysis, Insights and Forecast, 2019-2031
- 9.1. Market Analysis, Insights and Forecast - By Country/Sub-region
- 9.1.1 United States
- 9.1.2 Canada
- 9.1.3 Mexico
- 10. Europe North Sea Region Oil & Gas Industry Analysis, Insights and Forecast, 2019-2031
- 10.1. Market Analysis, Insights and Forecast - By Country/Sub-region
- 10.1.1 Germany
- 10.1.2 United Kingdom
- 10.1.3 France
- 10.1.4 Spain
- 10.1.5 Italy
- 10.1.6 Spain
- 10.1.7 Belgium
- 10.1.8 Netherland
- 10.1.9 Nordics
- 10.1.10 Rest of Europe
- 11. Asia Pacific North Sea Region Oil & Gas Industry Analysis, Insights and Forecast, 2019-2031
- 11.1. Market Analysis, Insights and Forecast - By Country/Sub-region
- 11.1.1 China
- 11.1.2 Japan
- 11.1.3 India
- 11.1.4 South Korea
- 11.1.5 Southeast Asia
- 11.1.6 Australia
- 11.1.7 Indonesia
- 11.1.8 Phillipes
- 11.1.9 Singapore
- 11.1.10 Thailandc
- 11.1.11 Rest of Asia Pacific
- 12. South America North Sea Region Oil & Gas Industry Analysis, Insights and Forecast, 2019-2031
- 12.1. Market Analysis, Insights and Forecast - By Country/Sub-region
- 12.1.1 Brazil
- 12.1.2 Argentina
- 12.1.3 Peru
- 12.1.4 Chile
- 12.1.5 Colombia
- 12.1.6 Ecuador
- 12.1.7 Venezuela
- 12.1.8 Rest of South America
- 13. North America North Sea Region Oil & Gas Industry Analysis, Insights and Forecast, 2019-2031
- 13.1. Market Analysis, Insights and Forecast - By Country/Sub-region
- 13.1.1 United States
- 13.1.2 Canada
- 13.1.3 Mexico
- 14. MEA North Sea Region Oil & Gas Industry Analysis, Insights and Forecast, 2019-2031
- 14.1. Market Analysis, Insights and Forecast - By Country/Sub-region
- 14.1.1 United Arab Emirates
- 14.1.2 Saudi Arabia
- 14.1.3 South Africa
- 14.1.4 Rest of Middle East and Africa
- 15. Competitive Analysis
- 15.1. Global Market Share Analysis 2024
- 15.2. Company Profiles
- 15.2.1 Equinor ASA
- 15.2.1.1. Overview
- 15.2.1.2. Products
- 15.2.1.3. SWOT Analysis
- 15.2.1.4. Recent Developments
- 15.2.1.5. Financials (Based on Availability)
- 15.2.2 Total S A *List Not Exhaustive
- 15.2.2.1. Overview
- 15.2.2.2. Products
- 15.2.2.3. SWOT Analysis
- 15.2.2.4. Recent Developments
- 15.2.2.5. Financials (Based on Availability)
- 15.2.3 BP Plc
- 15.2.3.1. Overview
- 15.2.3.2. Products
- 15.2.3.3. SWOT Analysis
- 15.2.3.4. Recent Developments
- 15.2.3.5. Financials (Based on Availability)
- 15.2.4 Royal Dutch Shell Plc
- 15.2.4.1. Overview
- 15.2.4.2. Products
- 15.2.4.3. SWOT Analysis
- 15.2.4.4. Recent Developments
- 15.2.4.5. Financials (Based on Availability)
- 15.2.5 Transocean Ltd
- 15.2.5.1. Overview
- 15.2.5.2. Products
- 15.2.5.3. SWOT Analysis
- 15.2.5.4. Recent Developments
- 15.2.5.5. Financials (Based on Availability)
- 15.2.6 Baker Hughes Company
- 15.2.6.1. Overview
- 15.2.6.2. Products
- 15.2.6.3. SWOT Analysis
- 15.2.6.4. Recent Developments
- 15.2.6.5. Financials (Based on Availability)
- 15.2.7 Halliburton Company
- 15.2.7.1. Overview
- 15.2.7.2. Products
- 15.2.7.3. SWOT Analysis
- 15.2.7.4. Recent Developments
- 15.2.7.5. Financials (Based on Availability)
- 15.2.8 Seadrill Ltd
- 15.2.8.1. Overview
- 15.2.8.2. Products
- 15.2.8.3. SWOT Analysis
- 15.2.8.4. Recent Developments
- 15.2.8.5. Financials (Based on Availability)
- 15.2.9 Schlumberger Limited
- 15.2.9.1. Overview
- 15.2.9.2. Products
- 15.2.9.3. SWOT Analysis
- 15.2.9.4. Recent Developments
- 15.2.9.5. Financials (Based on Availability)
- 15.2.10 Valaris PLC
- 15.2.10.1. Overview
- 15.2.10.2. Products
- 15.2.10.3. SWOT Analysis
- 15.2.10.4. Recent Developments
- 15.2.10.5. Financials (Based on Availability)
- 15.2.1 Equinor ASA
List of Figures
- Figure 1: Global North Sea Region Oil & Gas Industry Revenue Breakdown (Million, %) by Region 2024 & 2032
- Figure 2: North America North Sea Region Oil & Gas Industry Revenue (Million), by Country 2024 & 2032
- Figure 3: North America North Sea Region Oil & Gas Industry Revenue Share (%), by Country 2024 & 2032
- Figure 4: Europe North Sea Region Oil & Gas Industry Revenue (Million), by Country 2024 & 2032
- Figure 5: Europe North Sea Region Oil & Gas Industry Revenue Share (%), by Country 2024 & 2032
- Figure 6: Asia Pacific North Sea Region Oil & Gas Industry Revenue (Million), by Country 2024 & 2032
- Figure 7: Asia Pacific North Sea Region Oil & Gas Industry Revenue Share (%), by Country 2024 & 2032
- Figure 8: South America North Sea Region Oil & Gas Industry Revenue (Million), by Country 2024 & 2032
- Figure 9: South America North Sea Region Oil & Gas Industry Revenue Share (%), by Country 2024 & 2032
- Figure 10: North America North Sea Region Oil & Gas Industry Revenue (Million), by Country 2024 & 2032
- Figure 11: North America North Sea Region Oil & Gas Industry Revenue Share (%), by Country 2024 & 2032
- Figure 12: MEA North Sea Region Oil & Gas Industry Revenue (Million), by Country 2024 & 2032
- Figure 13: MEA North Sea Region Oil & Gas Industry Revenue Share (%), by Country 2024 & 2032
- Figure 14: United Kingdom North Sea Region Oil & Gas Industry Revenue (Million), by Sector 2024 & 2032
- Figure 15: United Kingdom North Sea Region Oil & Gas Industry Revenue Share (%), by Sector 2024 & 2032
- Figure 16: United Kingdom North Sea Region Oil & Gas Industry Revenue (Million), by Country 2024 & 2032
- Figure 17: United Kingdom North Sea Region Oil & Gas Industry Revenue Share (%), by Country 2024 & 2032
- Figure 18: Norway North Sea Region Oil & Gas Industry Revenue (Million), by Sector 2024 & 2032
- Figure 19: Norway North Sea Region Oil & Gas Industry Revenue Share (%), by Sector 2024 & 2032
- Figure 20: Norway North Sea Region Oil & Gas Industry Revenue (Million), by Country 2024 & 2032
- Figure 21: Norway North Sea Region Oil & Gas Industry Revenue Share (%), by Country 2024 & 2032
- Figure 22: Rest of North Sea Region North Sea Region Oil & Gas Industry Revenue (Million), by Sector 2024 & 2032
- Figure 23: Rest of North Sea Region North Sea Region Oil & Gas Industry Revenue Share (%), by Sector 2024 & 2032
- Figure 24: Rest of North Sea Region North Sea Region Oil & Gas Industry Revenue (Million), by Country 2024 & 2032
- Figure 25: Rest of North Sea Region North Sea Region Oil & Gas Industry Revenue Share (%), by Country 2024 & 2032
List of Tables
- Table 1: Global North Sea Region Oil & Gas Industry Revenue Million Forecast, by Region 2019 & 2032
- Table 2: Global North Sea Region Oil & Gas Industry Revenue Million Forecast, by Sector 2019 & 2032
- Table 3: Global North Sea Region Oil & Gas Industry Revenue Million Forecast, by Region 2019 & 2032
- Table 4: Global North Sea Region Oil & Gas Industry Revenue Million Forecast, by Country 2019 & 2032
- Table 5: United States North Sea Region Oil & Gas Industry Revenue (Million) Forecast, by Application 2019 & 2032
- Table 6: Canada North Sea Region Oil & Gas Industry Revenue (Million) Forecast, by Application 2019 & 2032
- Table 7: Mexico North Sea Region Oil & Gas Industry Revenue (Million) Forecast, by Application 2019 & 2032
- Table 8: Global North Sea Region Oil & Gas Industry Revenue Million Forecast, by Country 2019 & 2032
- Table 9: Germany North Sea Region Oil & Gas Industry Revenue (Million) Forecast, by Application 2019 & 2032
- Table 10: United Kingdom North Sea Region Oil & Gas Industry Revenue (Million) Forecast, by Application 2019 & 2032
- Table 11: France North Sea Region Oil & Gas Industry Revenue (Million) Forecast, by Application 2019 & 2032
- Table 12: Spain North Sea Region Oil & Gas Industry Revenue (Million) Forecast, by Application 2019 & 2032
- Table 13: Italy North Sea Region Oil & Gas Industry Revenue (Million) Forecast, by Application 2019 & 2032
- Table 14: Spain North Sea Region Oil & Gas Industry Revenue (Million) Forecast, by Application 2019 & 2032
- Table 15: Belgium North Sea Region Oil & Gas Industry Revenue (Million) Forecast, by Application 2019 & 2032
- Table 16: Netherland North Sea Region Oil & Gas Industry Revenue (Million) Forecast, by Application 2019 & 2032
- Table 17: Nordics North Sea Region Oil & Gas Industry Revenue (Million) Forecast, by Application 2019 & 2032
- Table 18: Rest of Europe North Sea Region Oil & Gas Industry Revenue (Million) Forecast, by Application 2019 & 2032
- Table 19: Global North Sea Region Oil & Gas Industry Revenue Million Forecast, by Country 2019 & 2032
- Table 20: China North Sea Region Oil & Gas Industry Revenue (Million) Forecast, by Application 2019 & 2032
- Table 21: Japan North Sea Region Oil & Gas Industry Revenue (Million) Forecast, by Application 2019 & 2032
- Table 22: India North Sea Region Oil & Gas Industry Revenue (Million) Forecast, by Application 2019 & 2032
- Table 23: South Korea North Sea Region Oil & Gas Industry Revenue (Million) Forecast, by Application 2019 & 2032
- Table 24: Southeast Asia North Sea Region Oil & Gas Industry Revenue (Million) Forecast, by Application 2019 & 2032
- Table 25: Australia North Sea Region Oil & Gas Industry Revenue (Million) Forecast, by Application 2019 & 2032
- Table 26: Indonesia North Sea Region Oil & Gas Industry Revenue (Million) Forecast, by Application 2019 & 2032
- Table 27: Phillipes North Sea Region Oil & Gas Industry Revenue (Million) Forecast, by Application 2019 & 2032
- Table 28: Singapore North Sea Region Oil & Gas Industry Revenue (Million) Forecast, by Application 2019 & 2032
- Table 29: Thailandc North Sea Region Oil & Gas Industry Revenue (Million) Forecast, by Application 2019 & 2032
- Table 30: Rest of Asia Pacific North Sea Region Oil & Gas Industry Revenue (Million) Forecast, by Application 2019 & 2032
- Table 31: Global North Sea Region Oil & Gas Industry Revenue Million Forecast, by Country 2019 & 2032
- Table 32: Brazil North Sea Region Oil & Gas Industry Revenue (Million) Forecast, by Application 2019 & 2032
- Table 33: Argentina North Sea Region Oil & Gas Industry Revenue (Million) Forecast, by Application 2019 & 2032
- Table 34: Peru North Sea Region Oil & Gas Industry Revenue (Million) Forecast, by Application 2019 & 2032
- Table 35: Chile North Sea Region Oil & Gas Industry Revenue (Million) Forecast, by Application 2019 & 2032
- Table 36: Colombia North Sea Region Oil & Gas Industry Revenue (Million) Forecast, by Application 2019 & 2032
- Table 37: Ecuador North Sea Region Oil & Gas Industry Revenue (Million) Forecast, by Application 2019 & 2032
- Table 38: Venezuela North Sea Region Oil & Gas Industry Revenue (Million) Forecast, by Application 2019 & 2032
- Table 39: Rest of South America North Sea Region Oil & Gas Industry Revenue (Million) Forecast, by Application 2019 & 2032
- Table 40: Global North Sea Region Oil & Gas Industry Revenue Million Forecast, by Country 2019 & 2032
- Table 41: United States North Sea Region Oil & Gas Industry Revenue (Million) Forecast, by Application 2019 & 2032
- Table 42: Canada North Sea Region Oil & Gas Industry Revenue (Million) Forecast, by Application 2019 & 2032
- Table 43: Mexico North Sea Region Oil & Gas Industry Revenue (Million) Forecast, by Application 2019 & 2032
- Table 44: Global North Sea Region Oil & Gas Industry Revenue Million Forecast, by Country 2019 & 2032
- Table 45: United Arab Emirates North Sea Region Oil & Gas Industry Revenue (Million) Forecast, by Application 2019 & 2032
- Table 46: Saudi Arabia North Sea Region Oil & Gas Industry Revenue (Million) Forecast, by Application 2019 & 2032
- Table 47: South Africa North Sea Region Oil & Gas Industry Revenue (Million) Forecast, by Application 2019 & 2032
- Table 48: Rest of Middle East and Africa North Sea Region Oil & Gas Industry Revenue (Million) Forecast, by Application 2019 & 2032
- Table 49: Global North Sea Region Oil & Gas Industry Revenue Million Forecast, by Sector 2019 & 2032
- Table 50: Global North Sea Region Oil & Gas Industry Revenue Million Forecast, by Country 2019 & 2032
- Table 51: Global North Sea Region Oil & Gas Industry Revenue Million Forecast, by Sector 2019 & 2032
- Table 52: Global North Sea Region Oil & Gas Industry Revenue Million Forecast, by Country 2019 & 2032
- Table 53: Global North Sea Region Oil & Gas Industry Revenue Million Forecast, by Sector 2019 & 2032
- Table 54: Global North Sea Region Oil & Gas Industry Revenue Million Forecast, by Country 2019 & 2032
Frequently Asked Questions
1. What is the projected Compound Annual Growth Rate (CAGR) of the North Sea Region Oil & Gas Industry?
The projected CAGR is approximately > 3.00%.
2. Which companies are prominent players in the North Sea Region Oil & Gas Industry?
Key companies in the market include Equinor ASA, Total S A *List Not Exhaustive, BP Plc, Royal Dutch Shell Plc, Transocean Ltd, Baker Hughes Company, Halliburton Company, Seadrill Ltd, Schlumberger Limited, Valaris PLC.
3. What are the main segments of the North Sea Region Oil & Gas Industry?
The market segments include Sector.
4. Can you provide details about the market size?
The market size is estimated to be USD XX Million as of 2022.
5. What are some drivers contributing to market growth?
4.; Increased Government Regulations for Greenhouse Gas Emissions 4.; Encouraging Production and Consumption of Renewable Aviation Fuel.
6. What are the notable trends driving market growth?
Upstream Sector to Dominate the Market.
7. Are there any restraints impacting market growth?
4.; The High Costs of Renewable Aviation Fuel.
8. Can you provide examples of recent developments in the market?
N/A
9. What pricing options are available for accessing the report?
Pricing options include single-user, multi-user, and enterprise licenses priced at USD 4750, USD 5250, and USD 8750 respectively.
10. Is the market size provided in terms of value or volume?
The market size is provided in terms of value, measured in Million.
11. Are there any specific market keywords associated with the report?
Yes, the market keyword associated with the report is "North Sea Region Oil & Gas Industry," which aids in identifying and referencing the specific market segment covered.
12. How do I determine which pricing option suits my needs best?
The pricing options vary based on user requirements and access needs. Individual users may opt for single-user licenses, while businesses requiring broader access may choose multi-user or enterprise licenses for cost-effective access to the report.
13. Are there any additional resources or data provided in the North Sea Region Oil & Gas Industry report?
While the report offers comprehensive insights, it's advisable to review the specific contents or supplementary materials provided to ascertain if additional resources or data are available.
14. How can I stay updated on further developments or reports in the North Sea Region Oil & Gas Industry?
To stay informed about further developments, trends, and reports in the North Sea Region Oil & Gas Industry, consider subscribing to industry newsletters, following relevant companies and organizations, or regularly checking reputable industry news sources and publications.
Methodology
Step 1 - Identification of Relevant Samples Size from Population Database


Step 2 - Approaches for Defining Global Market Size (Value, Volume* & Price*)

Note*: In applicable scenarios
Step 3 - Data Sources
Primary Research
- Web Analytics
- Survey Reports
- Research Institute
- Latest Research Reports
- Opinion Leaders
Secondary Research
- Annual Reports
- White Paper
- Latest Press Release
- Industry Association
- Paid Database
- Investor Presentations

Step 4 - Data Triangulation
Involves using different sources of information in order to increase the validity of a study
These sources are likely to be stakeholders in a program - participants, other researchers, program staff, other community members, and so on.
Then we put all data in single framework & apply various statistical tools to find out the dynamic on the market.
During the analysis stage, feedback from the stakeholder groups would be compared to determine areas of agreement as well as areas of divergence


