
Key Insights
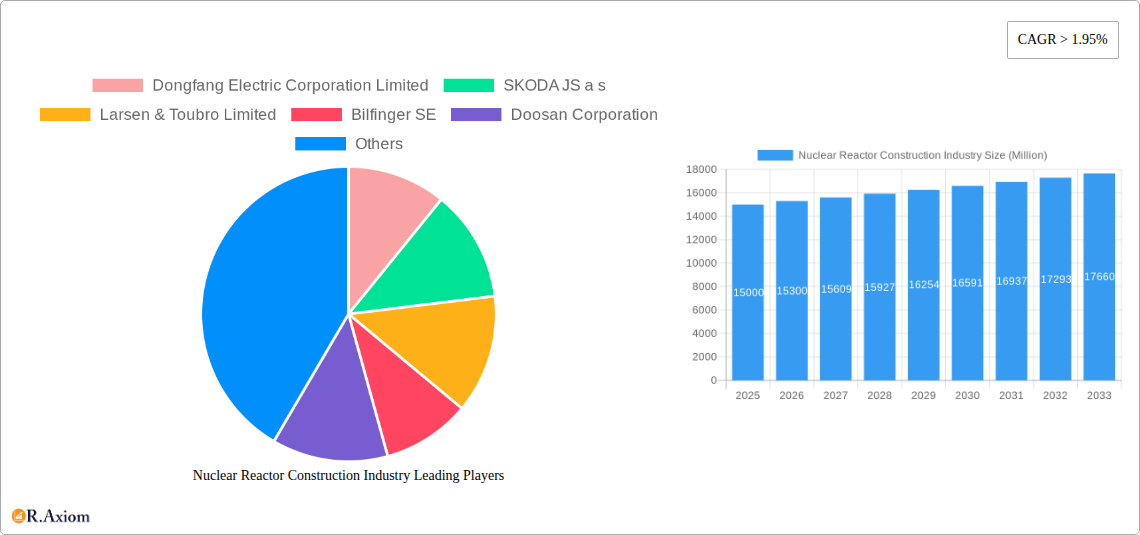
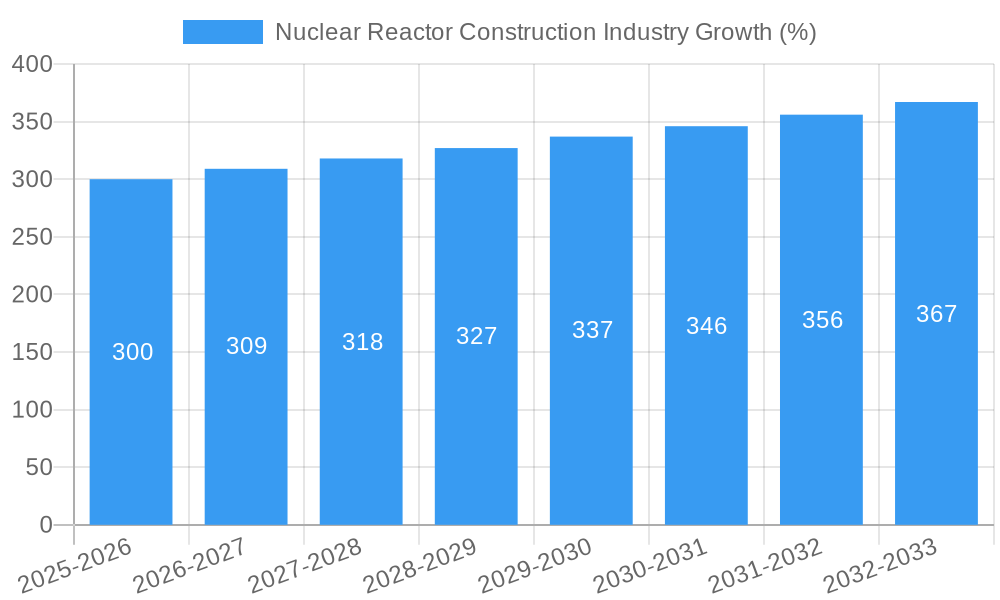
The global nuclear reactor construction industry is experiencing steady growth, projected to maintain a Compound Annual Growth Rate (CAGR) exceeding 1.95% from 2025 to 2033. This expansion is fueled by several key drivers. Firstly, increasing global energy demand coupled with concerns about climate change are driving the adoption of low-carbon energy sources, making nuclear power a compelling alternative. Secondly, advancements in reactor technology, such as the development of Small Modular Reactors (SMRs), are improving safety, reducing construction costs, and streamlining the deployment process. Furthermore, supportive government policies and regulations in several key regions are encouraging investment and facilitating project approvals. However, the industry also faces challenges. High capital costs associated with nuclear power plant construction remain a significant barrier to entry for many countries. Public perception and concerns regarding nuclear safety continue to influence project timelines and approvals. Finally, the fluctuating prices of materials and skilled labor can impact project profitability.
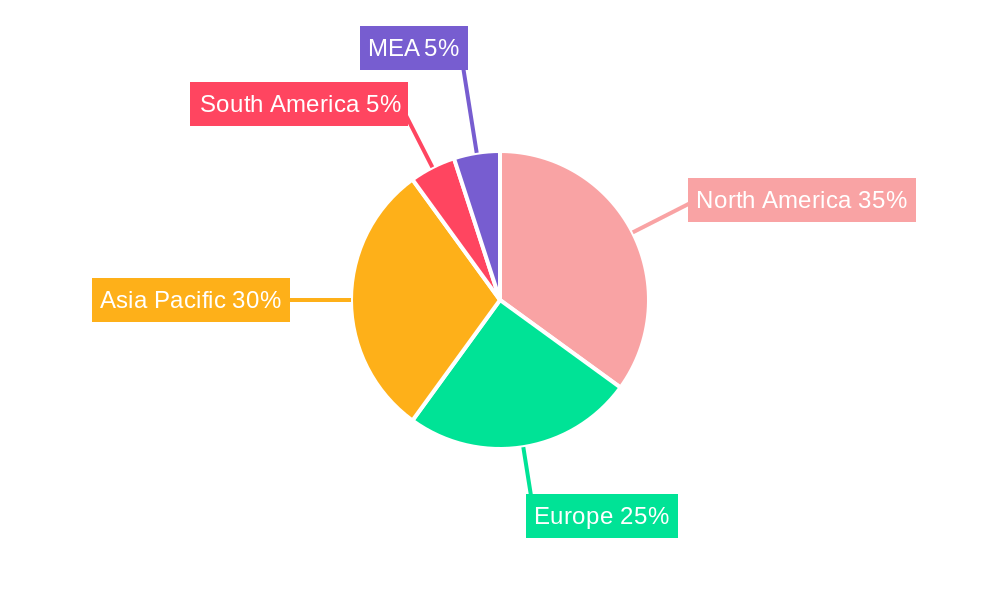
Market segmentation reveals a diverse landscape. The service segment, encompassing engineering, procurement, and construction (EPC) services, holds a substantial share. Within reactor types, Pressurized Water Reactors (PWRs) and Pressurized Heavy Water Reactors (PHWRs) currently dominate the market, but the adoption of Boiling Water Reactors (BWRs) and advanced reactor designs like High-Temperature Gas-Cooled Reactors (HTGRs) and Liquid-Metal Fast-Breeder Reactors (LMFBRs) is expected to grow in the forecast period. Geographically, North America and Asia Pacific are currently the largest markets, driven by strong government support and existing nuclear infrastructure in countries like the US, China, and Japan. However, Europe and other regions are also anticipated to show growth as the global shift towards cleaner energy accelerates. Leading companies, including Dongfang Electric, SKODA JS, Larsen & Toubro, and Westinghouse, are strategically positioning themselves to capitalize on these market opportunities, engaging in technological innovation and expansion strategies. Competition is expected to intensify as the market evolves.
Nuclear Reactor Construction Industry: A Comprehensive Market Report (2019-2033)
This in-depth report provides a comprehensive analysis of the global nuclear reactor construction industry, covering market size, growth projections, key players, technological advancements, and emerging trends from 2019 to 2033. The report leverages extensive primary and secondary research to deliver actionable insights for industry stakeholders, investors, and policymakers. With a focus on key segments like Pressurized Water Reactors (PWRs), Pressurized Heavy Water Reactors (PHWRs), Boiling Water Reactors (BWRs), High-Temperature Gas-Cooled Reactors (HTGRs), and Liquid-Metal Fast-Breeder Reactors (LMFBRs), this report offers a granular understanding of the market landscape. The base year for this analysis is 2025, with a forecast period extending to 2033 and a historical period covering 2019-2024. Market values are expressed in Millions.
Nuclear Reactor Construction Industry Market Concentration & Innovation
The global nuclear reactor construction industry is characterized by a moderately concentrated market structure, with a few dominant players holding significant market share. Companies like Dongfang Electric Corporation Limited, SKODA JS a.s., Larsen & Toubro Limited, Bilfinger SE, Doosan Corporation, China National Nuclear Corporation, Shanghai Electric Group Company Limited, KEPCO Engineering & Construction, Westinghouse Electric Company LLC (Toshiba), Rosatom Corp, Mitsubishi Heavy Industries Ltd, and GE-Hitachi Nuclear Energy Inc lead the market. The combined market share of the top five players is estimated at xx%.
Innovation is driven by the need for enhanced safety, efficiency, and cost-effectiveness. This includes advancements in reactor design, materials science, and digital technologies for improved construction and operation. Regulatory frameworks play a crucial role, influencing safety standards, licensing procedures, and waste management protocols. The industry faces competition from renewable energy sources, but the ongoing need for reliable baseload power continues to drive demand for nuclear power. M&A activity in the sector has been moderate in recent years, with xx Million in deal values recorded between 2019 and 2024. Key M&A drivers include gaining access to technology, expanding geographical reach, and achieving economies of scale.
Nuclear Reactor Construction Industry Industry Trends & Insights
The nuclear reactor construction industry is experiencing steady growth, driven by increasing global energy demand, concerns about climate change, and the need for reliable and carbon-free energy sources. The industry is projected to achieve a Compound Annual Growth Rate (CAGR) of xx% during the forecast period (2025-2033). This growth is fueled by several factors: the rising adoption of nuclear power in developing economies; government support for nuclear energy programs in various countries; and ongoing research and development in advanced reactor technologies like Small Modular Reactors (SMRs). Market penetration of nuclear power is expected to increase from xx% in 2025 to xx% by 2033. Technological disruptions, such as advancements in SMR technology and digitalization of construction processes, are reshaping the industry landscape. Growing consumer preference for sustainable and reliable energy sources further contributes to the industry's growth trajectory. However, competitive dynamics are influenced by the cost of construction, regulatory hurdles, and public perception regarding nuclear safety.
Dominant Markets & Segments in Nuclear Reactor Construction Industry
Asia is currently the dominant market for nuclear reactor construction, driven by strong economic growth, significant investment in infrastructure development, and supportive government policies. China, India, and South Korea are key players in this region.
- Key Drivers in Asia:
- Significant government investment in nuclear energy infrastructure.
- Rapid industrialization and increasing energy demand.
- Favorable economic policies promoting nuclear power development.
- Extensive experience in the construction of large-scale nuclear power plants.
Among the reactor types, Pressurized Water Reactors (PWRs) and Pressurized Heavy Water Reactors (PHWRs) currently hold the largest market share, driven by their proven technology, established supply chains, and operational experience. The Equipment segment within the Service category is also experiencing robust growth, with installation and maintenance services for auxiliary equipment representing a significant portion of the market.
Nuclear Reactor Construction Industry Product Developments
Recent advancements in reactor design focus on improving safety, efficiency, and reducing waste. This includes the development of Small Modular Reactors (SMRs), which offer improved safety features, reduced construction times, and enhanced flexibility for deployment. The integration of advanced digital technologies, like AI and machine learning, into the construction process is leading to enhanced efficiency and quality control. These innovations are enhancing the market fit of nuclear technology, making it more cost-competitive and appealing to a wider range of potential users.
Report Scope & Segmentation Analysis
This report segments the nuclear reactor construction industry based on service type (Equipment, Auxiliary Equipment Installation), reactor type (PWR, PHWR, BWR, HTGR, LMFBR), and geography. Growth projections vary across segments. PWR and PHWR segments are expected to experience consistent growth, driven by established technology and continued demand. The SMR segment is poised for significant growth due to its inherent advantages. Market size and competitive dynamics differ based on regional and technological factors.
Key Drivers of Nuclear Reactor Construction Industry Growth
Several key factors drive the growth of the nuclear reactor construction industry. These include rising global energy demand, the imperative to reduce carbon emissions, and the ongoing need for reliable baseload power. Government support for nuclear energy through subsidies and favorable regulatory frameworks plays a significant role. Technological advancements, especially in SMRs, offer increased efficiency and safety, boosting market adoption. The growing awareness of the environmental impact of fossil fuels and the increasing cost of renewable energy solutions also contribute to the industry's expansion.
Challenges in the Nuclear Reactor Construction Industry Sector
The nuclear reactor construction industry faces challenges including high capital costs, stringent regulatory requirements, and long lead times for project completion. Supply chain disruptions can affect project timelines and budgets significantly. Public perception and safety concerns regarding nuclear power can also hinder project development and approval. Finally, intense competition from other energy sources and the fluctuating costs of materials impact the sector's profitability.
Emerging Opportunities in Nuclear Reactor Construction Industry
Emerging opportunities exist in the development and deployment of SMRs, advanced reactor designs, and digital technologies for construction and operation. The expansion into new markets, particularly in developing countries with growing energy demands, presents significant opportunities. The increasing need for reliable and clean energy solutions will continue to fuel market growth, leading to increased demand for construction services and related technologies.
Leading Players in the Nuclear Reactor Construction Industry Market
- Dongfang Electric Corporation Limited
- SKODA JS a.s.
- Larsen & Toubro Limited
- Bilfinger SE
- Doosan Corporation
- China National Nuclear Corporation
- Shanghai Electric Group Company Limited
- KEPCO Engineering & Construction
- Westinghouse Electric Company LLC (Toshiba)
- Rosatom Corp
- Mitsubishi Heavy Industries Ltd
- GE-Hitachi Nuclear Energy Inc
Key Developments in Nuclear Reactor Construction Industry Industry
- October 2022: The United States and Japan partnered with Ghana to support its SMR deployment goals, signaling a shift towards smaller, more adaptable reactor technologies and international collaboration in the sector.
- March 2022: India announced plans to build reactors in a "fleet mode," signifying a potential increase in construction activity and a focus on economies of scale.
Strategic Outlook for Nuclear Reactor Construction Industry Market
The future of the nuclear reactor construction industry looks promising, driven by several key catalysts. The continued need for reliable baseload power, coupled with environmental concerns, will solidify the role of nuclear energy in the global energy mix. Innovations in reactor technology, particularly SMRs, will drive market growth, while digitalization and improved project management techniques will improve efficiency and reduce costs. Expansion into new markets, especially in developing countries, offers significant growth potential.
Nuclear Reactor Construction Industry Segmentation
-
1. Service
-
1.1. Equipment
- 1.1.1. Island Equipment
- 1.1.2. Auxiliary Equipment
- 1.2. Installation
-
1.1. Equipment
-
2. Reactor Type
- 2.1. Pressuri
- 2.2. Boiling Water Reactor
- 2.3. High-temperature Gas Cooled Reactor
- 2.4. Liquid-metal Fast-Breeder Reactor
Nuclear Reactor Construction Industry Segmentation By Geography
- 1. North America
- 2. Europe
- 3. Asia Pacific
- 4. South America
- 5. Middle East and Africa
Nuclear Reactor Construction Industry REPORT HIGHLIGHTS
| Aspects | Details |
|---|---|
| Study Period | 2019-2033 |
| Base Year | 2024 |
| Estimated Year | 2025 |
| Forecast Period | 2025-2033 |
| Historical Period | 2019-2024 |
| Growth Rate | CAGR of > 1.95% from 2019-2033 |
| Segmentation |
|
Table of Contents
- 1. Introduction
- 1.1. Research Scope
- 1.2. Market Segmentation
- 1.3. Research Methodology
- 1.4. Definitions and Assumptions
- 2. Executive Summary
- 2.1. Introduction
- 3. Market Dynamics
- 3.1. Introduction
- 3.2. Market Drivers
- 3.2.1. 4.; Rising Demand for Reliable Electricity4.; Increasing Government Support for Hydropower Gneeration
- 3.3. Market Restrains
- 3.3.1. 4.; Negative Environmental Consequences of Hydropower Projects
- 3.4. Market Trends
- 3.4.1. Pressurized Water Reactor to Dominate the Market
- 4. Market Factor Analysis
- 4.1. Porters Five Forces
- 4.2. Supply/Value Chain
- 4.3. PESTEL analysis
- 4.4. Market Entropy
- 4.5. Patent/Trademark Analysis
- 5. Global Nuclear Reactor Construction Industry Analysis, Insights and Forecast, 2019-2031
- 5.1. Market Analysis, Insights and Forecast - by Service
- 5.1.1. Equipment
- 5.1.1.1. Island Equipment
- 5.1.1.2. Auxiliary Equipment
- 5.1.2. Installation
- 5.1.1. Equipment
- 5.2. Market Analysis, Insights and Forecast - by Reactor Type
- 5.2.1. Pressuri
- 5.2.2. Boiling Water Reactor
- 5.2.3. High-temperature Gas Cooled Reactor
- 5.2.4. Liquid-metal Fast-Breeder Reactor
- 5.3. Market Analysis, Insights and Forecast - by Region
- 5.3.1. North America
- 5.3.2. Europe
- 5.3.3. Asia Pacific
- 5.3.4. South America
- 5.3.5. Middle East and Africa
- 5.1. Market Analysis, Insights and Forecast - by Service
- 6. North America Nuclear Reactor Construction Industry Analysis, Insights and Forecast, 2019-2031
- 6.1. Market Analysis, Insights and Forecast - by Service
- 6.1.1. Equipment
- 6.1.1.1. Island Equipment
- 6.1.1.2. Auxiliary Equipment
- 6.1.2. Installation
- 6.1.1. Equipment
- 6.2. Market Analysis, Insights and Forecast - by Reactor Type
- 6.2.1. Pressuri
- 6.2.2. Boiling Water Reactor
- 6.2.3. High-temperature Gas Cooled Reactor
- 6.2.4. Liquid-metal Fast-Breeder Reactor
- 6.1. Market Analysis, Insights and Forecast - by Service
- 7. Europe Nuclear Reactor Construction Industry Analysis, Insights and Forecast, 2019-2031
- 7.1. Market Analysis, Insights and Forecast - by Service
- 7.1.1. Equipment
- 7.1.1.1. Island Equipment
- 7.1.1.2. Auxiliary Equipment
- 7.1.2. Installation
- 7.1.1. Equipment
- 7.2. Market Analysis, Insights and Forecast - by Reactor Type
- 7.2.1. Pressuri
- 7.2.2. Boiling Water Reactor
- 7.2.3. High-temperature Gas Cooled Reactor
- 7.2.4. Liquid-metal Fast-Breeder Reactor
- 7.1. Market Analysis, Insights and Forecast - by Service
- 8. Asia Pacific Nuclear Reactor Construction Industry Analysis, Insights and Forecast, 2019-2031
- 8.1. Market Analysis, Insights and Forecast - by Service
- 8.1.1. Equipment
- 8.1.1.1. Island Equipment
- 8.1.1.2. Auxiliary Equipment
- 8.1.2. Installation
- 8.1.1. Equipment
- 8.2. Market Analysis, Insights and Forecast - by Reactor Type
- 8.2.1. Pressuri
- 8.2.2. Boiling Water Reactor
- 8.2.3. High-temperature Gas Cooled Reactor
- 8.2.4. Liquid-metal Fast-Breeder Reactor
- 8.1. Market Analysis, Insights and Forecast - by Service
- 9. South America Nuclear Reactor Construction Industry Analysis, Insights and Forecast, 2019-2031
- 9.1. Market Analysis, Insights and Forecast - by Service
- 9.1.1. Equipment
- 9.1.1.1. Island Equipment
- 9.1.1.2. Auxiliary Equipment
- 9.1.2. Installation
- 9.1.1. Equipment
- 9.2. Market Analysis, Insights and Forecast - by Reactor Type
- 9.2.1. Pressuri
- 9.2.2. Boiling Water Reactor
- 9.2.3. High-temperature Gas Cooled Reactor
- 9.2.4. Liquid-metal Fast-Breeder Reactor
- 9.1. Market Analysis, Insights and Forecast - by Service
- 10. Middle East and Africa Nuclear Reactor Construction Industry Analysis, Insights and Forecast, 2019-2031
- 10.1. Market Analysis, Insights and Forecast - by Service
- 10.1.1. Equipment
- 10.1.1.1. Island Equipment
- 10.1.1.2. Auxiliary Equipment
- 10.1.2. Installation
- 10.1.1. Equipment
- 10.2. Market Analysis, Insights and Forecast - by Reactor Type
- 10.2.1. Pressuri
- 10.2.2. Boiling Water Reactor
- 10.2.3. High-temperature Gas Cooled Reactor
- 10.2.4. Liquid-metal Fast-Breeder Reactor
- 10.1. Market Analysis, Insights and Forecast - by Service
- 11. North America Nuclear Reactor Construction Industry Analysis, Insights and Forecast, 2019-2031
- 11.1. Market Analysis, Insights and Forecast - By Country/Sub-region
- 11.1.1 United States
- 11.1.2 Canada
- 11.1.3 Mexico
- 12. Europe Nuclear Reactor Construction Industry Analysis, Insights and Forecast, 2019-2031
- 12.1. Market Analysis, Insights and Forecast - By Country/Sub-region
- 12.1.1 Germany
- 12.1.2 United Kingdom
- 12.1.3 France
- 12.1.4 Spain
- 12.1.5 Italy
- 12.1.6 Spain
- 12.1.7 Belgium
- 12.1.8 Netherland
- 12.1.9 Nordics
- 12.1.10 Rest of Europe
- 13. Asia Pacific Nuclear Reactor Construction Industry Analysis, Insights and Forecast, 2019-2031
- 13.1. Market Analysis, Insights and Forecast - By Country/Sub-region
- 13.1.1 China
- 13.1.2 Japan
- 13.1.3 India
- 13.1.4 South Korea
- 13.1.5 Southeast Asia
- 13.1.6 Australia
- 13.1.7 Indonesia
- 13.1.8 Phillipes
- 13.1.9 Singapore
- 13.1.10 Thailandc
- 13.1.11 Rest of Asia Pacific
- 14. South America Nuclear Reactor Construction Industry Analysis, Insights and Forecast, 2019-2031
- 14.1. Market Analysis, Insights and Forecast - By Country/Sub-region
- 14.1.1 Brazil
- 14.1.2 Argentina
- 14.1.3 Peru
- 14.1.4 Chile
- 14.1.5 Colombia
- 14.1.6 Ecuador
- 14.1.7 Venezuela
- 14.1.8 Rest of South America
- 15. North America Nuclear Reactor Construction Industry Analysis, Insights and Forecast, 2019-2031
- 15.1. Market Analysis, Insights and Forecast - By Country/Sub-region
- 15.1.1 United States
- 15.1.2 Canada
- 15.1.3 Mexico
- 16. MEA Nuclear Reactor Construction Industry Analysis, Insights and Forecast, 2019-2031
- 16.1. Market Analysis, Insights and Forecast - By Country/Sub-region
- 16.1.1 United Arab Emirates
- 16.1.2 Saudi Arabia
- 16.1.3 South Africa
- 16.1.4 Rest of Middle East and Africa
- 17. Competitive Analysis
- 17.1. Global Market Share Analysis 2024
- 17.2. Company Profiles
- 17.2.1 Dongfang Electric Corporation Limited
- 17.2.1.1. Overview
- 17.2.1.2. Products
- 17.2.1.3. SWOT Analysis
- 17.2.1.4. Recent Developments
- 17.2.1.5. Financials (Based on Availability)
- 17.2.2 SKODA JS a s
- 17.2.2.1. Overview
- 17.2.2.2. Products
- 17.2.2.3. SWOT Analysis
- 17.2.2.4. Recent Developments
- 17.2.2.5. Financials (Based on Availability)
- 17.2.3 Larsen & Toubro Limited
- 17.2.3.1. Overview
- 17.2.3.2. Products
- 17.2.3.3. SWOT Analysis
- 17.2.3.4. Recent Developments
- 17.2.3.5. Financials (Based on Availability)
- 17.2.4 Bilfinger SE
- 17.2.4.1. Overview
- 17.2.4.2. Products
- 17.2.4.3. SWOT Analysis
- 17.2.4.4. Recent Developments
- 17.2.4.5. Financials (Based on Availability)
- 17.2.5 Doosan Corporation
- 17.2.5.1. Overview
- 17.2.5.2. Products
- 17.2.5.3. SWOT Analysis
- 17.2.5.4. Recent Developments
- 17.2.5.5. Financials (Based on Availability)
- 17.2.6 China National Nuclear Corporation
- 17.2.6.1. Overview
- 17.2.6.2. Products
- 17.2.6.3. SWOT Analysis
- 17.2.6.4. Recent Developments
- 17.2.6.5. Financials (Based on Availability)
- 17.2.7 Shanghai Electric Group Company Limited
- 17.2.7.1. Overview
- 17.2.7.2. Products
- 17.2.7.3. SWOT Analysis
- 17.2.7.4. Recent Developments
- 17.2.7.5. Financials (Based on Availability)
- 17.2.8 KEPCO Engineering & Construction
- 17.2.8.1. Overview
- 17.2.8.2. Products
- 17.2.8.3. SWOT Analysis
- 17.2.8.4. Recent Developments
- 17.2.8.5. Financials (Based on Availability)
- 17.2.9 Westinghouse Electric Company LLC (Toshiba)
- 17.2.9.1. Overview
- 17.2.9.2. Products
- 17.2.9.3. SWOT Analysis
- 17.2.9.4. Recent Developments
- 17.2.9.5. Financials (Based on Availability)
- 17.2.10 Rosatom Corp*List Not Exhaustive
- 17.2.10.1. Overview
- 17.2.10.2. Products
- 17.2.10.3. SWOT Analysis
- 17.2.10.4. Recent Developments
- 17.2.10.5. Financials (Based on Availability)
- 17.2.11 Mitsubishi Heavy Industries Ltd
- 17.2.11.1. Overview
- 17.2.11.2. Products
- 17.2.11.3. SWOT Analysis
- 17.2.11.4. Recent Developments
- 17.2.11.5. Financials (Based on Availability)
- 17.2.12 GE-Hitachi Nuclear Energy Inc
- 17.2.12.1. Overview
- 17.2.12.2. Products
- 17.2.12.3. SWOT Analysis
- 17.2.12.4. Recent Developments
- 17.2.12.5. Financials (Based on Availability)
- 17.2.1 Dongfang Electric Corporation Limited
List of Figures
- Figure 1: Global Nuclear Reactor Construction Industry Revenue Breakdown (Million, %) by Region 2024 & 2032
- Figure 2: North America Nuclear Reactor Construction Industry Revenue (Million), by Country 2024 & 2032
- Figure 3: North America Nuclear Reactor Construction Industry Revenue Share (%), by Country 2024 & 2032
- Figure 4: Europe Nuclear Reactor Construction Industry Revenue (Million), by Country 2024 & 2032
- Figure 5: Europe Nuclear Reactor Construction Industry Revenue Share (%), by Country 2024 & 2032
- Figure 6: Asia Pacific Nuclear Reactor Construction Industry Revenue (Million), by Country 2024 & 2032
- Figure 7: Asia Pacific Nuclear Reactor Construction Industry Revenue Share (%), by Country 2024 & 2032
- Figure 8: South America Nuclear Reactor Construction Industry Revenue (Million), by Country 2024 & 2032
- Figure 9: South America Nuclear Reactor Construction Industry Revenue Share (%), by Country 2024 & 2032
- Figure 10: North America Nuclear Reactor Construction Industry Revenue (Million), by Country 2024 & 2032
- Figure 11: North America Nuclear Reactor Construction Industry Revenue Share (%), by Country 2024 & 2032
- Figure 12: MEA Nuclear Reactor Construction Industry Revenue (Million), by Country 2024 & 2032
- Figure 13: MEA Nuclear Reactor Construction Industry Revenue Share (%), by Country 2024 & 2032
- Figure 14: North America Nuclear Reactor Construction Industry Revenue (Million), by Service 2024 & 2032
- Figure 15: North America Nuclear Reactor Construction Industry Revenue Share (%), by Service 2024 & 2032
- Figure 16: North America Nuclear Reactor Construction Industry Revenue (Million), by Reactor Type 2024 & 2032
- Figure 17: North America Nuclear Reactor Construction Industry Revenue Share (%), by Reactor Type 2024 & 2032
- Figure 18: North America Nuclear Reactor Construction Industry Revenue (Million), by Country 2024 & 2032
- Figure 19: North America Nuclear Reactor Construction Industry Revenue Share (%), by Country 2024 & 2032
- Figure 20: Europe Nuclear Reactor Construction Industry Revenue (Million), by Service 2024 & 2032
- Figure 21: Europe Nuclear Reactor Construction Industry Revenue Share (%), by Service 2024 & 2032
- Figure 22: Europe Nuclear Reactor Construction Industry Revenue (Million), by Reactor Type 2024 & 2032
- Figure 23: Europe Nuclear Reactor Construction Industry Revenue Share (%), by Reactor Type 2024 & 2032
- Figure 24: Europe Nuclear Reactor Construction Industry Revenue (Million), by Country 2024 & 2032
- Figure 25: Europe Nuclear Reactor Construction Industry Revenue Share (%), by Country 2024 & 2032
- Figure 26: Asia Pacific Nuclear Reactor Construction Industry Revenue (Million), by Service 2024 & 2032
- Figure 27: Asia Pacific Nuclear Reactor Construction Industry Revenue Share (%), by Service 2024 & 2032
- Figure 28: Asia Pacific Nuclear Reactor Construction Industry Revenue (Million), by Reactor Type 2024 & 2032
- Figure 29: Asia Pacific Nuclear Reactor Construction Industry Revenue Share (%), by Reactor Type 2024 & 2032
- Figure 30: Asia Pacific Nuclear Reactor Construction Industry Revenue (Million), by Country 2024 & 2032
- Figure 31: Asia Pacific Nuclear Reactor Construction Industry Revenue Share (%), by Country 2024 & 2032
- Figure 32: South America Nuclear Reactor Construction Industry Revenue (Million), by Service 2024 & 2032
- Figure 33: South America Nuclear Reactor Construction Industry Revenue Share (%), by Service 2024 & 2032
- Figure 34: South America Nuclear Reactor Construction Industry Revenue (Million), by Reactor Type 2024 & 2032
- Figure 35: South America Nuclear Reactor Construction Industry Revenue Share (%), by Reactor Type 2024 & 2032
- Figure 36: South America Nuclear Reactor Construction Industry Revenue (Million), by Country 2024 & 2032
- Figure 37: South America Nuclear Reactor Construction Industry Revenue Share (%), by Country 2024 & 2032
- Figure 38: Middle East and Africa Nuclear Reactor Construction Industry Revenue (Million), by Service 2024 & 2032
- Figure 39: Middle East and Africa Nuclear Reactor Construction Industry Revenue Share (%), by Service 2024 & 2032
- Figure 40: Middle East and Africa Nuclear Reactor Construction Industry Revenue (Million), by Reactor Type 2024 & 2032
- Figure 41: Middle East and Africa Nuclear Reactor Construction Industry Revenue Share (%), by Reactor Type 2024 & 2032
- Figure 42: Middle East and Africa Nuclear Reactor Construction Industry Revenue (Million), by Country 2024 & 2032
- Figure 43: Middle East and Africa Nuclear Reactor Construction Industry Revenue Share (%), by Country 2024 & 2032
List of Tables
- Table 1: Global Nuclear Reactor Construction Industry Revenue Million Forecast, by Region 2019 & 2032
- Table 2: Global Nuclear Reactor Construction Industry Revenue Million Forecast, by Service 2019 & 2032
- Table 3: Global Nuclear Reactor Construction Industry Revenue Million Forecast, by Reactor Type 2019 & 2032
- Table 4: Global Nuclear Reactor Construction Industry Revenue Million Forecast, by Region 2019 & 2032
- Table 5: Global Nuclear Reactor Construction Industry Revenue Million Forecast, by Country 2019 & 2032
- Table 6: United States Nuclear Reactor Construction Industry Revenue (Million) Forecast, by Application 2019 & 2032
- Table 7: Canada Nuclear Reactor Construction Industry Revenue (Million) Forecast, by Application 2019 & 2032
- Table 8: Mexico Nuclear Reactor Construction Industry Revenue (Million) Forecast, by Application 2019 & 2032
- Table 9: Global Nuclear Reactor Construction Industry Revenue Million Forecast, by Country 2019 & 2032
- Table 10: Germany Nuclear Reactor Construction Industry Revenue (Million) Forecast, by Application 2019 & 2032
- Table 11: United Kingdom Nuclear Reactor Construction Industry Revenue (Million) Forecast, by Application 2019 & 2032
- Table 12: France Nuclear Reactor Construction Industry Revenue (Million) Forecast, by Application 2019 & 2032
- Table 13: Spain Nuclear Reactor Construction Industry Revenue (Million) Forecast, by Application 2019 & 2032
- Table 14: Italy Nuclear Reactor Construction Industry Revenue (Million) Forecast, by Application 2019 & 2032
- Table 15: Spain Nuclear Reactor Construction Industry Revenue (Million) Forecast, by Application 2019 & 2032
- Table 16: Belgium Nuclear Reactor Construction Industry Revenue (Million) Forecast, by Application 2019 & 2032
- Table 17: Netherland Nuclear Reactor Construction Industry Revenue (Million) Forecast, by Application 2019 & 2032
- Table 18: Nordics Nuclear Reactor Construction Industry Revenue (Million) Forecast, by Application 2019 & 2032
- Table 19: Rest of Europe Nuclear Reactor Construction Industry Revenue (Million) Forecast, by Application 2019 & 2032
- Table 20: Global Nuclear Reactor Construction Industry Revenue Million Forecast, by Country 2019 & 2032
- Table 21: China Nuclear Reactor Construction Industry Revenue (Million) Forecast, by Application 2019 & 2032
- Table 22: Japan Nuclear Reactor Construction Industry Revenue (Million) Forecast, by Application 2019 & 2032
- Table 23: India Nuclear Reactor Construction Industry Revenue (Million) Forecast, by Application 2019 & 2032
- Table 24: South Korea Nuclear Reactor Construction Industry Revenue (Million) Forecast, by Application 2019 & 2032
- Table 25: Southeast Asia Nuclear Reactor Construction Industry Revenue (Million) Forecast, by Application 2019 & 2032
- Table 26: Australia Nuclear Reactor Construction Industry Revenue (Million) Forecast, by Application 2019 & 2032
- Table 27: Indonesia Nuclear Reactor Construction Industry Revenue (Million) Forecast, by Application 2019 & 2032
- Table 28: Phillipes Nuclear Reactor Construction Industry Revenue (Million) Forecast, by Application 2019 & 2032
- Table 29: Singapore Nuclear Reactor Construction Industry Revenue (Million) Forecast, by Application 2019 & 2032
- Table 30: Thailandc Nuclear Reactor Construction Industry Revenue (Million) Forecast, by Application 2019 & 2032
- Table 31: Rest of Asia Pacific Nuclear Reactor Construction Industry Revenue (Million) Forecast, by Application 2019 & 2032
- Table 32: Global Nuclear Reactor Construction Industry Revenue Million Forecast, by Country 2019 & 2032
- Table 33: Brazil Nuclear Reactor Construction Industry Revenue (Million) Forecast, by Application 2019 & 2032
- Table 34: Argentina Nuclear Reactor Construction Industry Revenue (Million) Forecast, by Application 2019 & 2032
- Table 35: Peru Nuclear Reactor Construction Industry Revenue (Million) Forecast, by Application 2019 & 2032
- Table 36: Chile Nuclear Reactor Construction Industry Revenue (Million) Forecast, by Application 2019 & 2032
- Table 37: Colombia Nuclear Reactor Construction Industry Revenue (Million) Forecast, by Application 2019 & 2032
- Table 38: Ecuador Nuclear Reactor Construction Industry Revenue (Million) Forecast, by Application 2019 & 2032
- Table 39: Venezuela Nuclear Reactor Construction Industry Revenue (Million) Forecast, by Application 2019 & 2032
- Table 40: Rest of South America Nuclear Reactor Construction Industry Revenue (Million) Forecast, by Application 2019 & 2032
- Table 41: Global Nuclear Reactor Construction Industry Revenue Million Forecast, by Country 2019 & 2032
- Table 42: United States Nuclear Reactor Construction Industry Revenue (Million) Forecast, by Application 2019 & 2032
- Table 43: Canada Nuclear Reactor Construction Industry Revenue (Million) Forecast, by Application 2019 & 2032
- Table 44: Mexico Nuclear Reactor Construction Industry Revenue (Million) Forecast, by Application 2019 & 2032
- Table 45: Global Nuclear Reactor Construction Industry Revenue Million Forecast, by Country 2019 & 2032
- Table 46: United Arab Emirates Nuclear Reactor Construction Industry Revenue (Million) Forecast, by Application 2019 & 2032
- Table 47: Saudi Arabia Nuclear Reactor Construction Industry Revenue (Million) Forecast, by Application 2019 & 2032
- Table 48: South Africa Nuclear Reactor Construction Industry Revenue (Million) Forecast, by Application 2019 & 2032
- Table 49: Rest of Middle East and Africa Nuclear Reactor Construction Industry Revenue (Million) Forecast, by Application 2019 & 2032
- Table 50: Global Nuclear Reactor Construction Industry Revenue Million Forecast, by Service 2019 & 2032
- Table 51: Global Nuclear Reactor Construction Industry Revenue Million Forecast, by Reactor Type 2019 & 2032
- Table 52: Global Nuclear Reactor Construction Industry Revenue Million Forecast, by Country 2019 & 2032
- Table 53: Global Nuclear Reactor Construction Industry Revenue Million Forecast, by Service 2019 & 2032
- Table 54: Global Nuclear Reactor Construction Industry Revenue Million Forecast, by Reactor Type 2019 & 2032
- Table 55: Global Nuclear Reactor Construction Industry Revenue Million Forecast, by Country 2019 & 2032
- Table 56: Global Nuclear Reactor Construction Industry Revenue Million Forecast, by Service 2019 & 2032
- Table 57: Global Nuclear Reactor Construction Industry Revenue Million Forecast, by Reactor Type 2019 & 2032
- Table 58: Global Nuclear Reactor Construction Industry Revenue Million Forecast, by Country 2019 & 2032
- Table 59: Global Nuclear Reactor Construction Industry Revenue Million Forecast, by Service 2019 & 2032
- Table 60: Global Nuclear Reactor Construction Industry Revenue Million Forecast, by Reactor Type 2019 & 2032
- Table 61: Global Nuclear Reactor Construction Industry Revenue Million Forecast, by Country 2019 & 2032
- Table 62: Global Nuclear Reactor Construction Industry Revenue Million Forecast, by Service 2019 & 2032
- Table 63: Global Nuclear Reactor Construction Industry Revenue Million Forecast, by Reactor Type 2019 & 2032
- Table 64: Global Nuclear Reactor Construction Industry Revenue Million Forecast, by Country 2019 & 2032
Frequently Asked Questions
1. What is the projected Compound Annual Growth Rate (CAGR) of the Nuclear Reactor Construction Industry?
The projected CAGR is approximately > 1.95%.
2. Which companies are prominent players in the Nuclear Reactor Construction Industry?
Key companies in the market include Dongfang Electric Corporation Limited, SKODA JS a s, Larsen & Toubro Limited, Bilfinger SE, Doosan Corporation, China National Nuclear Corporation, Shanghai Electric Group Company Limited, KEPCO Engineering & Construction, Westinghouse Electric Company LLC (Toshiba), Rosatom Corp*List Not Exhaustive, Mitsubishi Heavy Industries Ltd, GE-Hitachi Nuclear Energy Inc.
3. What are the main segments of the Nuclear Reactor Construction Industry?
The market segments include Service, Reactor Type.
4. Can you provide details about the market size?
The market size is estimated to be USD XX Million as of 2022.
5. What are some drivers contributing to market growth?
4.; Rising Demand for Reliable Electricity4.; Increasing Government Support for Hydropower Gneeration.
6. What are the notable trends driving market growth?
Pressurized Water Reactor to Dominate the Market.
7. Are there any restraints impacting market growth?
4.; Negative Environmental Consequences of Hydropower Projects.
8. Can you provide examples of recent developments in the market?
October 2022: The United States and Japan announced a partnership with Ghana at the International Atomic Energy Agency Nuclear Power Ministerial Conference in Washington, DC, to support its goal of leading Africa to deploy small modular reactors. Since Ghana's nuclear power program is currently technology neutral, the collaboration will facilitate the deployment of Small Modular Reactor (SMR) technology in Ghana.
9. What pricing options are available for accessing the report?
Pricing options include single-user, multi-user, and enterprise licenses priced at USD 4750, USD 5250, and USD 8750 respectively.
10. Is the market size provided in terms of value or volume?
The market size is provided in terms of value, measured in Million.
11. Are there any specific market keywords associated with the report?
Yes, the market keyword associated with the report is "Nuclear Reactor Construction Industry," which aids in identifying and referencing the specific market segment covered.
12. How do I determine which pricing option suits my needs best?
The pricing options vary based on user requirements and access needs. Individual users may opt for single-user licenses, while businesses requiring broader access may choose multi-user or enterprise licenses for cost-effective access to the report.
13. Are there any additional resources or data provided in the Nuclear Reactor Construction Industry report?
While the report offers comprehensive insights, it's advisable to review the specific contents or supplementary materials provided to ascertain if additional resources or data are available.
14. How can I stay updated on further developments or reports in the Nuclear Reactor Construction Industry?
To stay informed about further developments, trends, and reports in the Nuclear Reactor Construction Industry, consider subscribing to industry newsletters, following relevant companies and organizations, or regularly checking reputable industry news sources and publications.
Methodology
Step 1 - Identification of Relevant Samples Size from Population Database


Step 2 - Approaches for Defining Global Market Size (Value, Volume* & Price*)

Note*: In applicable scenarios
Step 3 - Data Sources
Primary Research
- Web Analytics
- Survey Reports
- Research Institute
- Latest Research Reports
- Opinion Leaders
Secondary Research
- Annual Reports
- White Paper
- Latest Press Release
- Industry Association
- Paid Database
- Investor Presentations

Step 4 - Data Triangulation
Involves using different sources of information in order to increase the validity of a study
These sources are likely to be stakeholders in a program - participants, other researchers, program staff, other community members, and so on.
Then we put all data in single framework & apply various statistical tools to find out the dynamic on the market.
During the analysis stage, feedback from the stakeholder groups would be compared to determine areas of agreement as well as areas of divergence


