
Key Insights
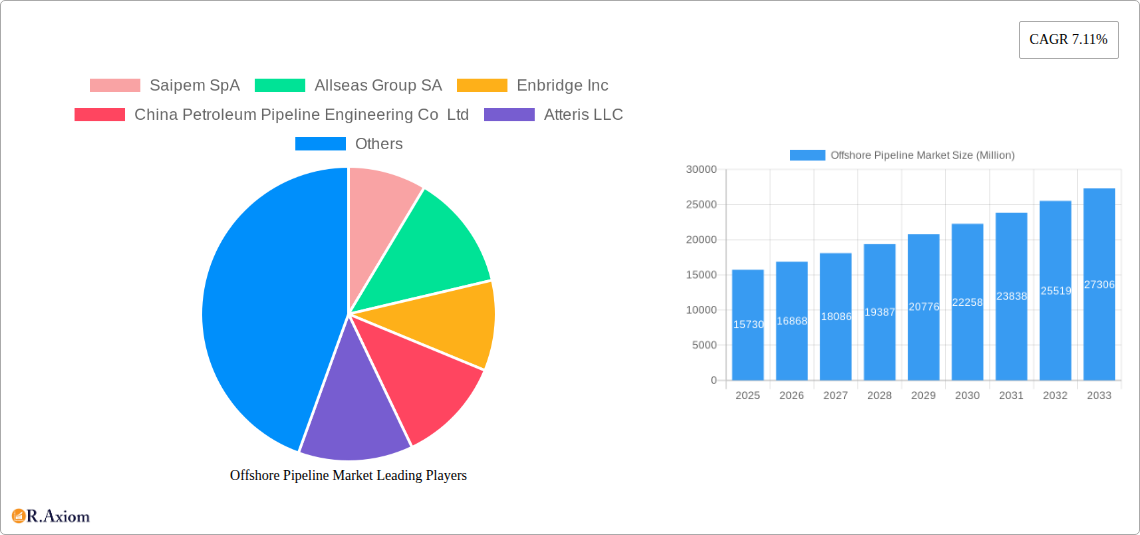
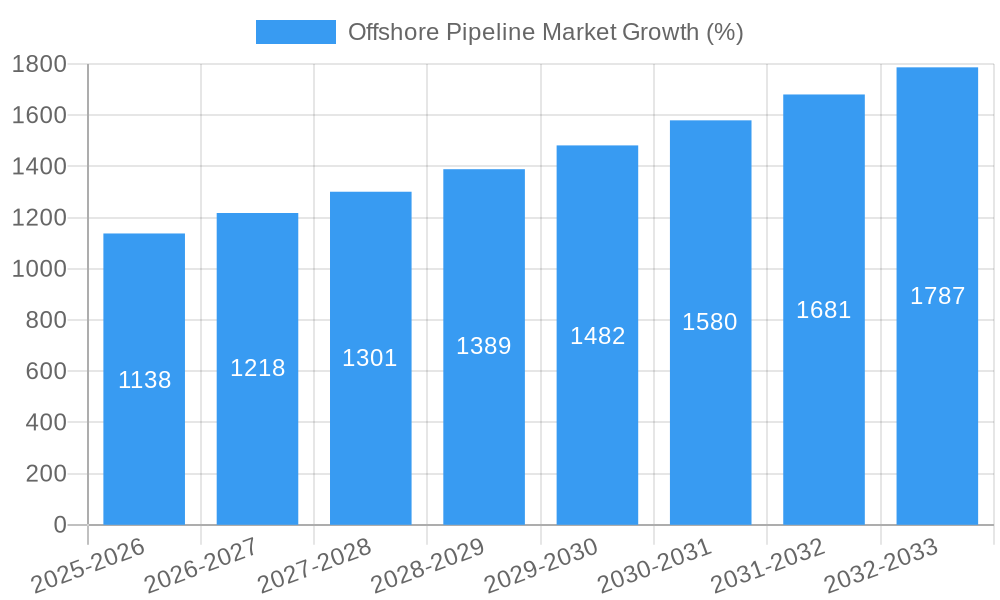
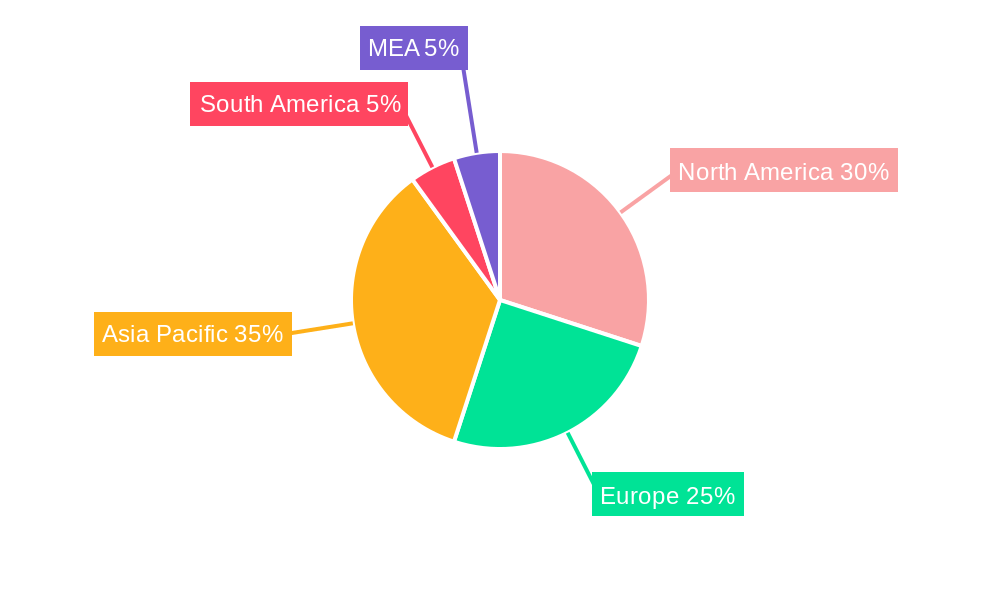
The offshore pipeline market, valued at $15.73 billion in 2025, is projected to experience robust growth, driven by increasing global energy demand and the expansion of offshore oil and gas exploration and production activities. The 7.11% CAGR from 2025-2033 indicates a significant market expansion, fueled primarily by substantial investments in deepwater and ultra-deepwater projects. Government initiatives promoting energy security and the transition towards cleaner energy sources, while seemingly contradictory, are contributing factors. The need for efficient and reliable pipelines to transport newly discovered reserves offsets concerns about phasing out fossil fuels, creating a dynamic market. Technological advancements in pipeline construction and maintenance, like improved materials and remotely operated vehicles (ROVs), are enhancing efficiency and reducing operational costs. However, the market faces challenges, including stringent environmental regulations, fluctuating oil and gas prices, and geopolitical uncertainties impacting project timelines and investments. The market's segmentation by product type (oil and gas) reflects its close ties to the upstream energy sector, with growth closely mirroring the health of the global oil and gas market. Key players like Saipem SpA, Allseas Group SA, and Subsea 7 SA are actively shaping the market landscape through their technological expertise and project execution capabilities. The regional distribution reveals significant opportunities in Asia-Pacific, driven by robust economic growth and energy infrastructure development in countries like China and India. North America, while a mature market, continues to contribute significantly, particularly due to activity in the Gulf of Mexico.
Growth will likely be uneven across regions. North America and Europe, having relatively developed infrastructure, may exhibit moderate growth, while Asia-Pacific is anticipated to experience faster expansion given the region’s considerable energy demands and ongoing pipeline projects. The market's future is closely tied to the overall energy market outlook, with a continued increase in demand for offshore energy resources bolstering market growth. The industry's response to regulatory pressures and technological innovations will play a crucial role in shaping the long-term trajectory of this dynamic sector. The successful navigation of geopolitical risks and economic volatility is critical for sustained market expansion throughout the forecast period.
Offshore Pipeline Market: A Comprehensive Report (2019-2033)
This comprehensive report provides an in-depth analysis of the Offshore Pipeline Market, covering the period 2019-2033, with a focus on the year 2025. It offers actionable insights into market dynamics, key players, technological advancements, and future growth potential. This detailed study is essential for industry stakeholders, investors, and businesses seeking to understand and navigate this dynamic market.
Offshore Pipeline Market Market Concentration & Innovation
The offshore pipeline market exhibits moderate concentration, with several major players dominating the landscape. Market share analysis reveals that Saipem SpA, Allseas Group SA, and Subsea 7 SA hold significant positions, though precise figures require further proprietary data analysis for the report. However, the market shows signs of increasing fragmentation due to the emergence of specialized service providers. Innovation is driven by the need for cost-effective solutions, improved pipeline materials, enhanced safety measures, and the development of technologies enabling operations in deeper waters. Regulatory frameworks, particularly concerning environmental impact assessments and safety standards, significantly influence market dynamics. Product substitutes, such as subsea power cables and LNG transportation, pose competitive challenges, while end-user trends towards cleaner energy sources influence pipeline type demand. Mergers and acquisitions (M&A) activity in the sector is relatively high, with notable deals involving infrastructure upgrades and expansion into new geographical areas. The aggregate value of M&A deals in the last five years has reached approximately USD xx Million.
- Market Share: Saipem SpA, Allseas Group SA, Subsea 7 SA hold significant shares. Precise figures will be detailed in the full report.
- M&A Activity: USD xx Million in aggregate deal value over the last 5 years, detailed analysis and case studies within report.
- Innovation Drivers: Deeper water capabilities, improved materials, enhanced safety, cost reduction strategies.
- Regulatory Influence: Stringent environmental regulations and safety standards.
Offshore Pipeline Market Industry Trends & Insights
The offshore pipeline market is characterized by significant growth, driven by increasing global energy demand, particularly for natural gas, and the development of new offshore oil and gas fields. The Compound Annual Growth Rate (CAGR) for the forecast period (2025-2033) is estimated to be xx%. Technological disruptions, such as the use of advanced materials and robotic technologies for pipeline inspection and repair, are enhancing efficiency and reducing operational costs. Consumer preferences are shifting towards cleaner energy sources, leading to increased focus on gas pipelines compared to oil. Competitive dynamics are intense, with companies focusing on technological innovation, geographical expansion, and strategic partnerships. Market penetration rates are high in established regions, with further growth opportunities in emerging economies. The shift towards renewable energy resources poses a long-term challenge but presents opportunities for companies involved in carbon capture and storage pipeline projects.
Dominant Markets & Segments in Offshore Pipeline Market
The offshore pipeline market demonstrates regional variations in dominance. The Asia-Pacific region is projected to be a leading market, driven by increasing energy demand in countries like China and India. The Middle East and North Africa (MENA) region also shows strong growth potential due to significant oil and gas reserves.
Key Drivers for Dominant Regions:
- Asia-Pacific: Strong energy demand, ongoing infrastructure development, government support for energy projects.
- MENA: Abundant oil and gas reserves, investments in exploration and production, strategic geographical location.
Segment Dominance:
- Product Type: The gas segment is anticipated to dominate the market, driven by the rising global demand for natural gas as a cleaner fuel source compared to oil. Detailed market size projections for both segments will be detailed in the full report.
Offshore Pipeline Market Product Developments
Recent product innovations focus on materials that enhance durability, corrosion resistance, and lifespan. Advanced sensors and monitoring systems are improving pipeline safety and efficiency. This technology enhances predictive maintenance and reduces downtime. Furthermore, the development of remotely operated vehicles (ROVs) and underwater drones is making pipeline inspections and repairs safer and more cost-effective. The integration of these advancements enhances pipeline integrity management, a critical factor in minimizing environmental impact and ensuring operational reliability.
Report Scope & Segmentation Analysis
This report segments the offshore pipeline market by product type: Oil and Gas. The oil segment is expected to exhibit moderate growth due to fluctuating crude oil prices and global efforts to transition towards renewable energy sources. The gas segment, however, is expected to witness significant growth due to the increasing global demand for natural gas. Detailed projections for each segment's market size, growth rate, and competitive landscape will be presented in the full report.
Key Drivers of Offshore Pipeline Market Growth
Several factors contribute to the growth of the offshore pipeline market. These include increasing global energy demand, particularly for natural gas, significant investments in offshore oil and gas exploration and production, and government support for energy infrastructure projects. Technological advancements, like improved pipeline materials and remote monitoring systems, enhance efficiency and reduce risks. Furthermore, supportive regulatory environments in some regions are fostering market expansion.
Challenges in the Offshore Pipeline Market Sector
The offshore pipeline market faces challenges such as high upfront capital costs, stringent environmental regulations, complex permitting processes, and geopolitical risks impacting project development. Supply chain disruptions, particularly for specialized materials and equipment, can lead to project delays and cost overruns. Competitive pressure from alternative energy sources and transportation methods also creates challenges for market growth. These factors contribute to a potentially unpredictable market environment.
Emerging Opportunities in Offshore Pipeline Market
Emerging opportunities exist in the development of deepwater pipelines, pipelines for carbon capture and storage projects, and the expansion into new geographical regions with significant energy resources. Technological advancements in pipeline materials and monitoring systems are creating new market possibilities. Growing demand for natural gas as a transition fuel is driving investment in associated infrastructure projects, including pipelines.
Leading Players in the Offshore Pipeline Market Market
- Saipem SpA
- Allseas Group SA
- Enbridge Inc
- China Petroleum Pipeline Engineering Co Ltd
- Atteris LLC
- Subsea 7 SA
- L&T Hydrocarbon Engineering Limited
- Genesis Energy LP
- Bourbon Corporation SA
- McDermott International Ltd
Key Developments in Offshore Pipeline Market Industry
- January 2023: A Romanian gas pipeline project valued at USD 529.30 Million was announced, aiming to connect offshore Black Sea gas to the national grid. A separate USD 3.8 Billion OMV Petrom project, expected to yield 6 billion cubic meters of gas annually, is anticipated for a mid-2023 final investment decision.
- April 2022: Worley secured a contract for the Nigeria-Morocco Gas Pipeline (NMGP) project's FEED services. This pipeline, planned to be over 4,349 miles long, is projected to become the world's longest offshore pipeline.
Strategic Outlook for Offshore Pipeline Market Market
The offshore pipeline market exhibits strong growth potential driven by increasing energy demand and substantial investment in offshore energy projects. Technological innovations and favorable regulatory frameworks in certain regions are key catalysts. The increasing focus on gas infrastructure for cleaner energy solutions provides sustained growth opportunities. Further exploration and development of new offshore fields in under-served areas will drive long-term expansion of this sector.
Offshore Pipeline Market Segmentation
-
1. Product Type
- 1.1. Oil
- 1.2. Gas
Offshore Pipeline Market Segmentation By Geography
-
1. North America
- 1.1. United States of America
- 1.2. Canada
- 1.3. Rest of the North America
-
2. Europe
- 2.1. United Kingdom
- 2.2. Germany
- 2.3. France
- 2.4. Italy
- 2.5. Norway
- 2.6. Rest of the Europe
-
3. Asia Pacific
- 3.1. China
- 3.2. India
- 3.3. South Korea
- 3.4. Rest of the Asia Pacific
-
4. South America
- 4.1. Brazil
- 4.2. Argentina
- 4.3. Rest of the South America
-
5. Middle East and Africa
- 5.1. Iran
- 5.2. Qatar
- 5.3. Saudi Arabia
- 5.4. United Arab Emirates
- 5.5. Rest of the Middle East and Africa
Offshore Pipeline Market REPORT HIGHLIGHTS
| Aspects | Details |
|---|---|
| Study Period | 2019-2033 |
| Base Year | 2024 |
| Estimated Year | 2025 |
| Forecast Period | 2025-2033 |
| Historical Period | 2019-2024 |
| Growth Rate | CAGR of 7.11% from 2019-2033 |
| Segmentation |
|
Table of Contents
- 1. Introduction
- 1.1. Research Scope
- 1.2. Market Segmentation
- 1.3. Research Methodology
- 1.4. Definitions and Assumptions
- 2. Executive Summary
- 2.1. Introduction
- 3. Market Dynamics
- 3.1. Introduction
- 3.2. Market Drivers
- 3.2.1 4.; Increasing Demand for Crude Oil and Natural Gas4.; Growing Emphasis on Safe
- 3.2.2 Economic
- 3.2.3 and Reliable Connectivity for Oil and Gas Exploration
- 3.3. Market Restrains
- 3.3.1 4.; Technical Challenges Like Construction
- 3.3.2 Deep-Water Challenges
- 3.3.3 and High Construction Costs
- 3.4. Market Trends
- 3.4.1. The Gas Segment is Expected to Witness Significant Growth
- 4. Market Factor Analysis
- 4.1. Porters Five Forces
- 4.2. Supply/Value Chain
- 4.3. PESTEL analysis
- 4.4. Market Entropy
- 4.5. Patent/Trademark Analysis
- 5. Global Offshore Pipeline Market Analysis, Insights and Forecast, 2019-2031
- 5.1. Market Analysis, Insights and Forecast - by Product Type
- 5.1.1. Oil
- 5.1.2. Gas
- 5.2. Market Analysis, Insights and Forecast - by Region
- 5.2.1. North America
- 5.2.2. Europe
- 5.2.3. Asia Pacific
- 5.2.4. South America
- 5.2.5. Middle East and Africa
- 5.1. Market Analysis, Insights and Forecast - by Product Type
- 6. North America Offshore Pipeline Market Analysis, Insights and Forecast, 2019-2031
- 6.1. Market Analysis, Insights and Forecast - by Product Type
- 6.1.1. Oil
- 6.1.2. Gas
- 6.1. Market Analysis, Insights and Forecast - by Product Type
- 7. Europe Offshore Pipeline Market Analysis, Insights and Forecast, 2019-2031
- 7.1. Market Analysis, Insights and Forecast - by Product Type
- 7.1.1. Oil
- 7.1.2. Gas
- 7.1. Market Analysis, Insights and Forecast - by Product Type
- 8. Asia Pacific Offshore Pipeline Market Analysis, Insights and Forecast, 2019-2031
- 8.1. Market Analysis, Insights and Forecast - by Product Type
- 8.1.1. Oil
- 8.1.2. Gas
- 8.1. Market Analysis, Insights and Forecast - by Product Type
- 9. South America Offshore Pipeline Market Analysis, Insights and Forecast, 2019-2031
- 9.1. Market Analysis, Insights and Forecast - by Product Type
- 9.1.1. Oil
- 9.1.2. Gas
- 9.1. Market Analysis, Insights and Forecast - by Product Type
- 10. Middle East and Africa Offshore Pipeline Market Analysis, Insights and Forecast, 2019-2031
- 10.1. Market Analysis, Insights and Forecast - by Product Type
- 10.1.1. Oil
- 10.1.2. Gas
- 10.1. Market Analysis, Insights and Forecast - by Product Type
- 11. North America Offshore Pipeline Market Analysis, Insights and Forecast, 2019-2031
- 11.1. Market Analysis, Insights and Forecast - By Country/Sub-region
- 11.1.1 United States
- 11.1.2 Canada
- 11.1.3 Mexico
- 12. Europe Offshore Pipeline Market Analysis, Insights and Forecast, 2019-2031
- 12.1. Market Analysis, Insights and Forecast - By Country/Sub-region
- 12.1.1 Germany
- 12.1.2 United Kingdom
- 12.1.3 France
- 12.1.4 Spain
- 12.1.5 Italy
- 12.1.6 Spain
- 12.1.7 Belgium
- 12.1.8 Netherland
- 12.1.9 Nordics
- 12.1.10 Rest of Europe
- 13. Asia Pacific Offshore Pipeline Market Analysis, Insights and Forecast, 2019-2031
- 13.1. Market Analysis, Insights and Forecast - By Country/Sub-region
- 13.1.1 China
- 13.1.2 Japan
- 13.1.3 India
- 13.1.4 South Korea
- 13.1.5 Southeast Asia
- 13.1.6 Australia
- 13.1.7 Indonesia
- 13.1.8 Phillipes
- 13.1.9 Singapore
- 13.1.10 Thailandc
- 13.1.11 Rest of Asia Pacific
- 14. South America Offshore Pipeline Market Analysis, Insights and Forecast, 2019-2031
- 14.1. Market Analysis, Insights and Forecast - By Country/Sub-region
- 14.1.1 Brazil
- 14.1.2 Argentina
- 14.1.3 Peru
- 14.1.4 Chile
- 14.1.5 Colombia
- 14.1.6 Ecuador
- 14.1.7 Venezuela
- 14.1.8 Rest of South America
- 15. MEA Offshore Pipeline Market Analysis, Insights and Forecast, 2019-2031
- 15.1. Market Analysis, Insights and Forecast - By Country/Sub-region
- 15.1.1 United Arab Emirates
- 15.1.2 Saudi Arabia
- 15.1.3 South Africa
- 15.1.4 Rest of Middle East and Africa
- 16. Competitive Analysis
- 16.1. Global Market Share Analysis 2024
- 16.2. Company Profiles
- 16.2.1 Saipem SpA
- 16.2.1.1. Overview
- 16.2.1.2. Products
- 16.2.1.3. SWOT Analysis
- 16.2.1.4. Recent Developments
- 16.2.1.5. Financials (Based on Availability)
- 16.2.2 Allseas Group SA
- 16.2.2.1. Overview
- 16.2.2.2. Products
- 16.2.2.3. SWOT Analysis
- 16.2.2.4. Recent Developments
- 16.2.2.5. Financials (Based on Availability)
- 16.2.3 Enbridge Inc
- 16.2.3.1. Overview
- 16.2.3.2. Products
- 16.2.3.3. SWOT Analysis
- 16.2.3.4. Recent Developments
- 16.2.3.5. Financials (Based on Availability)
- 16.2.4 China Petroleum Pipeline Engineering Co Ltd
- 16.2.4.1. Overview
- 16.2.4.2. Products
- 16.2.4.3. SWOT Analysis
- 16.2.4.4. Recent Developments
- 16.2.4.5. Financials (Based on Availability)
- 16.2.5 Atteris LLC
- 16.2.5.1. Overview
- 16.2.5.2. Products
- 16.2.5.3. SWOT Analysis
- 16.2.5.4. Recent Developments
- 16.2.5.5. Financials (Based on Availability)
- 16.2.6 Subsea 7 SA
- 16.2.6.1. Overview
- 16.2.6.2. Products
- 16.2.6.3. SWOT Analysis
- 16.2.6.4. Recent Developments
- 16.2.6.5. Financials (Based on Availability)
- 16.2.7 L&T Hydrocarbon Engineering Limited
- 16.2.7.1. Overview
- 16.2.7.2. Products
- 16.2.7.3. SWOT Analysis
- 16.2.7.4. Recent Developments
- 16.2.7.5. Financials (Based on Availability)
- 16.2.8 Genesis Energy LP
- 16.2.8.1. Overview
- 16.2.8.2. Products
- 16.2.8.3. SWOT Analysis
- 16.2.8.4. Recent Developments
- 16.2.8.5. Financials (Based on Availability)
- 16.2.9 Bourbon Corporation SA
- 16.2.9.1. Overview
- 16.2.9.2. Products
- 16.2.9.3. SWOT Analysis
- 16.2.9.4. Recent Developments
- 16.2.9.5. Financials (Based on Availability)
- 16.2.10 McDermott International Ltd
- 16.2.10.1. Overview
- 16.2.10.2. Products
- 16.2.10.3. SWOT Analysis
- 16.2.10.4. Recent Developments
- 16.2.10.5. Financials (Based on Availability)
- 16.2.1 Saipem SpA
List of Figures
- Figure 1: Global Offshore Pipeline Market Revenue Breakdown (Million, %) by Region 2024 & 2032
- Figure 2: North America Offshore Pipeline Market Revenue (Million), by Country 2024 & 2032
- Figure 3: North America Offshore Pipeline Market Revenue Share (%), by Country 2024 & 2032
- Figure 4: Europe Offshore Pipeline Market Revenue (Million), by Country 2024 & 2032
- Figure 5: Europe Offshore Pipeline Market Revenue Share (%), by Country 2024 & 2032
- Figure 6: Asia Pacific Offshore Pipeline Market Revenue (Million), by Country 2024 & 2032
- Figure 7: Asia Pacific Offshore Pipeline Market Revenue Share (%), by Country 2024 & 2032
- Figure 8: South America Offshore Pipeline Market Revenue (Million), by Country 2024 & 2032
- Figure 9: South America Offshore Pipeline Market Revenue Share (%), by Country 2024 & 2032
- Figure 10: MEA Offshore Pipeline Market Revenue (Million), by Country 2024 & 2032
- Figure 11: MEA Offshore Pipeline Market Revenue Share (%), by Country 2024 & 2032
- Figure 12: North America Offshore Pipeline Market Revenue (Million), by Product Type 2024 & 2032
- Figure 13: North America Offshore Pipeline Market Revenue Share (%), by Product Type 2024 & 2032
- Figure 14: North America Offshore Pipeline Market Revenue (Million), by Country 2024 & 2032
- Figure 15: North America Offshore Pipeline Market Revenue Share (%), by Country 2024 & 2032
- Figure 16: Europe Offshore Pipeline Market Revenue (Million), by Product Type 2024 & 2032
- Figure 17: Europe Offshore Pipeline Market Revenue Share (%), by Product Type 2024 & 2032
- Figure 18: Europe Offshore Pipeline Market Revenue (Million), by Country 2024 & 2032
- Figure 19: Europe Offshore Pipeline Market Revenue Share (%), by Country 2024 & 2032
- Figure 20: Asia Pacific Offshore Pipeline Market Revenue (Million), by Product Type 2024 & 2032
- Figure 21: Asia Pacific Offshore Pipeline Market Revenue Share (%), by Product Type 2024 & 2032
- Figure 22: Asia Pacific Offshore Pipeline Market Revenue (Million), by Country 2024 & 2032
- Figure 23: Asia Pacific Offshore Pipeline Market Revenue Share (%), by Country 2024 & 2032
- Figure 24: South America Offshore Pipeline Market Revenue (Million), by Product Type 2024 & 2032
- Figure 25: South America Offshore Pipeline Market Revenue Share (%), by Product Type 2024 & 2032
- Figure 26: South America Offshore Pipeline Market Revenue (Million), by Country 2024 & 2032
- Figure 27: South America Offshore Pipeline Market Revenue Share (%), by Country 2024 & 2032
- Figure 28: Middle East and Africa Offshore Pipeline Market Revenue (Million), by Product Type 2024 & 2032
- Figure 29: Middle East and Africa Offshore Pipeline Market Revenue Share (%), by Product Type 2024 & 2032
- Figure 30: Middle East and Africa Offshore Pipeline Market Revenue (Million), by Country 2024 & 2032
- Figure 31: Middle East and Africa Offshore Pipeline Market Revenue Share (%), by Country 2024 & 2032
List of Tables
- Table 1: Global Offshore Pipeline Market Revenue Million Forecast, by Region 2019 & 2032
- Table 2: Global Offshore Pipeline Market Revenue Million Forecast, by Product Type 2019 & 2032
- Table 3: Global Offshore Pipeline Market Revenue Million Forecast, by Region 2019 & 2032
- Table 4: Global Offshore Pipeline Market Revenue Million Forecast, by Country 2019 & 2032
- Table 5: United States Offshore Pipeline Market Revenue (Million) Forecast, by Application 2019 & 2032
- Table 6: Canada Offshore Pipeline Market Revenue (Million) Forecast, by Application 2019 & 2032
- Table 7: Mexico Offshore Pipeline Market Revenue (Million) Forecast, by Application 2019 & 2032
- Table 8: Global Offshore Pipeline Market Revenue Million Forecast, by Country 2019 & 2032
- Table 9: Germany Offshore Pipeline Market Revenue (Million) Forecast, by Application 2019 & 2032
- Table 10: United Kingdom Offshore Pipeline Market Revenue (Million) Forecast, by Application 2019 & 2032
- Table 11: France Offshore Pipeline Market Revenue (Million) Forecast, by Application 2019 & 2032
- Table 12: Spain Offshore Pipeline Market Revenue (Million) Forecast, by Application 2019 & 2032
- Table 13: Italy Offshore Pipeline Market Revenue (Million) Forecast, by Application 2019 & 2032
- Table 14: Spain Offshore Pipeline Market Revenue (Million) Forecast, by Application 2019 & 2032
- Table 15: Belgium Offshore Pipeline Market Revenue (Million) Forecast, by Application 2019 & 2032
- Table 16: Netherland Offshore Pipeline Market Revenue (Million) Forecast, by Application 2019 & 2032
- Table 17: Nordics Offshore Pipeline Market Revenue (Million) Forecast, by Application 2019 & 2032
- Table 18: Rest of Europe Offshore Pipeline Market Revenue (Million) Forecast, by Application 2019 & 2032
- Table 19: Global Offshore Pipeline Market Revenue Million Forecast, by Country 2019 & 2032
- Table 20: China Offshore Pipeline Market Revenue (Million) Forecast, by Application 2019 & 2032
- Table 21: Japan Offshore Pipeline Market Revenue (Million) Forecast, by Application 2019 & 2032
- Table 22: India Offshore Pipeline Market Revenue (Million) Forecast, by Application 2019 & 2032
- Table 23: South Korea Offshore Pipeline Market Revenue (Million) Forecast, by Application 2019 & 2032
- Table 24: Southeast Asia Offshore Pipeline Market Revenue (Million) Forecast, by Application 2019 & 2032
- Table 25: Australia Offshore Pipeline Market Revenue (Million) Forecast, by Application 2019 & 2032
- Table 26: Indonesia Offshore Pipeline Market Revenue (Million) Forecast, by Application 2019 & 2032
- Table 27: Phillipes Offshore Pipeline Market Revenue (Million) Forecast, by Application 2019 & 2032
- Table 28: Singapore Offshore Pipeline Market Revenue (Million) Forecast, by Application 2019 & 2032
- Table 29: Thailandc Offshore Pipeline Market Revenue (Million) Forecast, by Application 2019 & 2032
- Table 30: Rest of Asia Pacific Offshore Pipeline Market Revenue (Million) Forecast, by Application 2019 & 2032
- Table 31: Global Offshore Pipeline Market Revenue Million Forecast, by Country 2019 & 2032
- Table 32: Brazil Offshore Pipeline Market Revenue (Million) Forecast, by Application 2019 & 2032
- Table 33: Argentina Offshore Pipeline Market Revenue (Million) Forecast, by Application 2019 & 2032
- Table 34: Peru Offshore Pipeline Market Revenue (Million) Forecast, by Application 2019 & 2032
- Table 35: Chile Offshore Pipeline Market Revenue (Million) Forecast, by Application 2019 & 2032
- Table 36: Colombia Offshore Pipeline Market Revenue (Million) Forecast, by Application 2019 & 2032
- Table 37: Ecuador Offshore Pipeline Market Revenue (Million) Forecast, by Application 2019 & 2032
- Table 38: Venezuela Offshore Pipeline Market Revenue (Million) Forecast, by Application 2019 & 2032
- Table 39: Rest of South America Offshore Pipeline Market Revenue (Million) Forecast, by Application 2019 & 2032
- Table 40: Global Offshore Pipeline Market Revenue Million Forecast, by Country 2019 & 2032
- Table 41: United Arab Emirates Offshore Pipeline Market Revenue (Million) Forecast, by Application 2019 & 2032
- Table 42: Saudi Arabia Offshore Pipeline Market Revenue (Million) Forecast, by Application 2019 & 2032
- Table 43: South Africa Offshore Pipeline Market Revenue (Million) Forecast, by Application 2019 & 2032
- Table 44: Rest of Middle East and Africa Offshore Pipeline Market Revenue (Million) Forecast, by Application 2019 & 2032
- Table 45: Global Offshore Pipeline Market Revenue Million Forecast, by Product Type 2019 & 2032
- Table 46: Global Offshore Pipeline Market Revenue Million Forecast, by Country 2019 & 2032
- Table 47: United States of America Offshore Pipeline Market Revenue (Million) Forecast, by Application 2019 & 2032
- Table 48: Canada Offshore Pipeline Market Revenue (Million) Forecast, by Application 2019 & 2032
- Table 49: Rest of the North America Offshore Pipeline Market Revenue (Million) Forecast, by Application 2019 & 2032
- Table 50: Global Offshore Pipeline Market Revenue Million Forecast, by Product Type 2019 & 2032
- Table 51: Global Offshore Pipeline Market Revenue Million Forecast, by Country 2019 & 2032
- Table 52: United Kingdom Offshore Pipeline Market Revenue (Million) Forecast, by Application 2019 & 2032
- Table 53: Germany Offshore Pipeline Market Revenue (Million) Forecast, by Application 2019 & 2032
- Table 54: France Offshore Pipeline Market Revenue (Million) Forecast, by Application 2019 & 2032
- Table 55: Italy Offshore Pipeline Market Revenue (Million) Forecast, by Application 2019 & 2032
- Table 56: Norway Offshore Pipeline Market Revenue (Million) Forecast, by Application 2019 & 2032
- Table 57: Rest of the Europe Offshore Pipeline Market Revenue (Million) Forecast, by Application 2019 & 2032
- Table 58: Global Offshore Pipeline Market Revenue Million Forecast, by Product Type 2019 & 2032
- Table 59: Global Offshore Pipeline Market Revenue Million Forecast, by Country 2019 & 2032
- Table 60: China Offshore Pipeline Market Revenue (Million) Forecast, by Application 2019 & 2032
- Table 61: India Offshore Pipeline Market Revenue (Million) Forecast, by Application 2019 & 2032
- Table 62: South Korea Offshore Pipeline Market Revenue (Million) Forecast, by Application 2019 & 2032
- Table 63: Rest of the Asia Pacific Offshore Pipeline Market Revenue (Million) Forecast, by Application 2019 & 2032
- Table 64: Global Offshore Pipeline Market Revenue Million Forecast, by Product Type 2019 & 2032
- Table 65: Global Offshore Pipeline Market Revenue Million Forecast, by Country 2019 & 2032
- Table 66: Brazil Offshore Pipeline Market Revenue (Million) Forecast, by Application 2019 & 2032
- Table 67: Argentina Offshore Pipeline Market Revenue (Million) Forecast, by Application 2019 & 2032
- Table 68: Rest of the South America Offshore Pipeline Market Revenue (Million) Forecast, by Application 2019 & 2032
- Table 69: Global Offshore Pipeline Market Revenue Million Forecast, by Product Type 2019 & 2032
- Table 70: Global Offshore Pipeline Market Revenue Million Forecast, by Country 2019 & 2032
- Table 71: Iran Offshore Pipeline Market Revenue (Million) Forecast, by Application 2019 & 2032
- Table 72: Qatar Offshore Pipeline Market Revenue (Million) Forecast, by Application 2019 & 2032
- Table 73: Saudi Arabia Offshore Pipeline Market Revenue (Million) Forecast, by Application 2019 & 2032
- Table 74: United Arab Emirates Offshore Pipeline Market Revenue (Million) Forecast, by Application 2019 & 2032
- Table 75: Rest of the Middle East and Africa Offshore Pipeline Market Revenue (Million) Forecast, by Application 2019 & 2032
Frequently Asked Questions
1. What is the projected Compound Annual Growth Rate (CAGR) of the Offshore Pipeline Market?
The projected CAGR is approximately 7.11%.
2. Which companies are prominent players in the Offshore Pipeline Market?
Key companies in the market include Saipem SpA, Allseas Group SA, Enbridge Inc, China Petroleum Pipeline Engineering Co Ltd, Atteris LLC, Subsea 7 SA, L&T Hydrocarbon Engineering Limited, Genesis Energy LP, Bourbon Corporation SA, McDermott International Ltd.
3. What are the main segments of the Offshore Pipeline Market?
The market segments include Product Type.
4. Can you provide details about the market size?
The market size is estimated to be USD 15.73 Million as of 2022.
5. What are some drivers contributing to market growth?
4.; Increasing Demand for Crude Oil and Natural Gas4.; Growing Emphasis on Safe. Economic. and Reliable Connectivity for Oil and Gas Exploration.
6. What are the notable trends driving market growth?
The Gas Segment is Expected to Witness Significant Growth.
7. Are there any restraints impacting market growth?
4.; Technical Challenges Like Construction. Deep-Water Challenges. and High Construction Costs.
8. Can you provide examples of recent developments in the market?
January 2023: The Romanian gas pipeline operator announced plans to construct a new pipeline worth USD 529.30 million to connect offshore Black Sea gas to the national grid. OMV Petrom, a Romanian oil and gas group majority-owned by Austria's OMV and state-owned Romgaz, is anticipated to make a final investment decision in a long-awaited offshore project by mid-2023. The initiative is expected to cost USD 3.8 billion and generate at least 6 billion cubic meters of gas annually.
9. What pricing options are available for accessing the report?
Pricing options include single-user, multi-user, and enterprise licenses priced at USD 4750, USD 5250, and USD 8750 respectively.
10. Is the market size provided in terms of value or volume?
The market size is provided in terms of value, measured in Million.
11. Are there any specific market keywords associated with the report?
Yes, the market keyword associated with the report is "Offshore Pipeline Market," which aids in identifying and referencing the specific market segment covered.
12. How do I determine which pricing option suits my needs best?
The pricing options vary based on user requirements and access needs. Individual users may opt for single-user licenses, while businesses requiring broader access may choose multi-user or enterprise licenses for cost-effective access to the report.
13. Are there any additional resources or data provided in the Offshore Pipeline Market report?
While the report offers comprehensive insights, it's advisable to review the specific contents or supplementary materials provided to ascertain if additional resources or data are available.
14. How can I stay updated on further developments or reports in the Offshore Pipeline Market?
To stay informed about further developments, trends, and reports in the Offshore Pipeline Market, consider subscribing to industry newsletters, following relevant companies and organizations, or regularly checking reputable industry news sources and publications.
Methodology
Step 1 - Identification of Relevant Samples Size from Population Database


Step 2 - Approaches for Defining Global Market Size (Value, Volume* & Price*)

Note*: In applicable scenarios
Step 3 - Data Sources
Primary Research
- Web Analytics
- Survey Reports
- Research Institute
- Latest Research Reports
- Opinion Leaders
Secondary Research
- Annual Reports
- White Paper
- Latest Press Release
- Industry Association
- Paid Database
- Investor Presentations

Step 4 - Data Triangulation
Involves using different sources of information in order to increase the validity of a study
These sources are likely to be stakeholders in a program - participants, other researchers, program staff, other community members, and so on.
Then we put all data in single framework & apply various statistical tools to find out the dynamic on the market.
During the analysis stage, feedback from the stakeholder groups would be compared to determine areas of agreement as well as areas of divergence


