

Key Insights
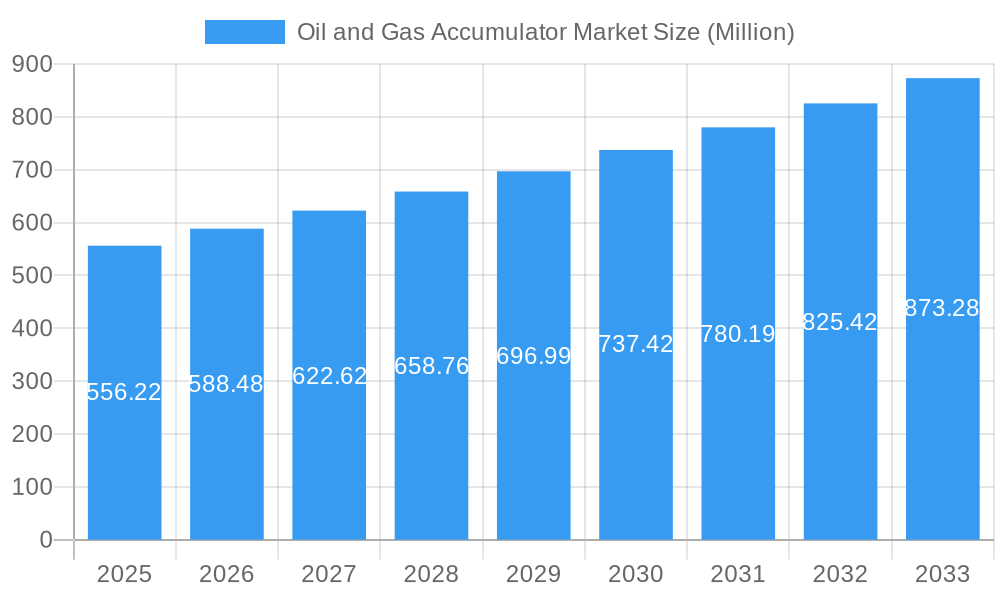
The global oil and gas accumulator market, valued at $629.47 million in 2025, is poised for substantial growth. This expansion is driven by increasing offshore drilling activities and the demand for enhanced safety and efficiency in oil and gas operations. The market is projected to grow at a Compound Annual Growth Rate (CAGR) of 4.86% from 2025 to 2033, fueled by technological advancements in accumulator design and the rising adoption of hydraulic systems in drilling, well workover, and intervention processes. Stringent safety regulations mandating accumulator use to mitigate pressure surges and enhance operational reliability further bolster growth. Despite potential restraints from fluctuating oil prices and the rise of alternative energy, the market outlook remains positive, particularly in key producing regions like North America, Europe, and the Asia-Pacific. While the onshore segment currently dominates, the offshore segment is expected to experience faster growth due to increasing exploration and extraction in offshore locations. Leading players are actively investing in research and development to enhance accumulator performance, efficiency, and durability.
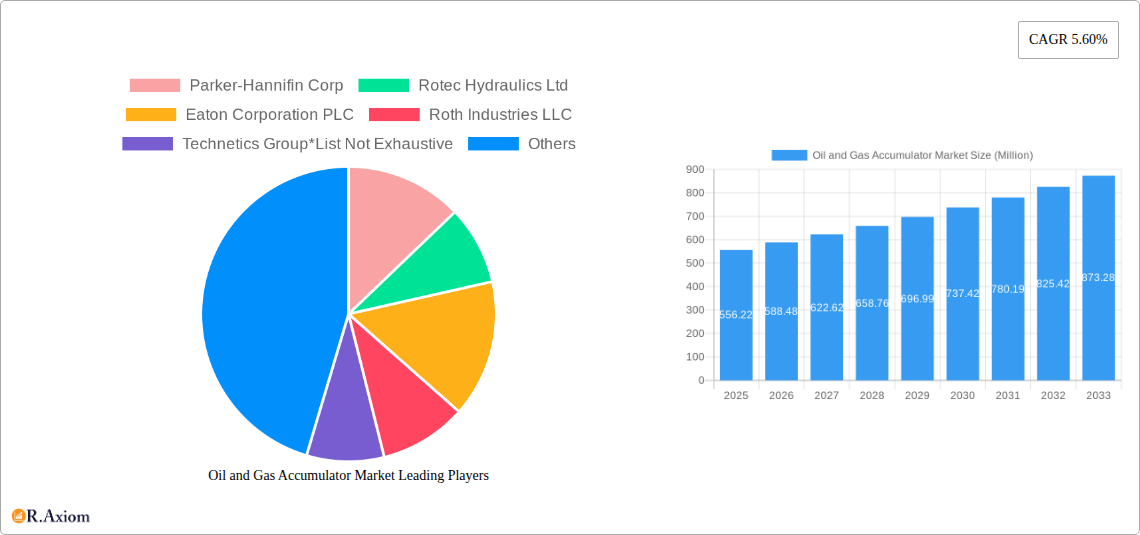
Oil and Gas Accumulator Market Market Size (In Million)
Market segmentation indicates a significant contribution from the drilling application segment, supported by ongoing exploration and production investments. The well workover and intervention segment is also showing healthy growth due to the need for improved equipment reliability and safety during critical operations. Regional analysis highlights substantial growth opportunities in areas with significant oil and gas reserves and ongoing infrastructure development. North America and the Asia-Pacific are expected to be key growth contributors due to considerable oil and gas production and upstream investment. Europe and the Middle East and Africa regions are also anticipated to see a notable increase in demand. The competitive landscape features established and emerging companies focusing on innovation and product differentiation, which is expected to benefit consumers through improved offerings and competitive pricing.
Oil and Gas Accumulator Market Company Market Share
Oil and Gas Accumulator Market: A Comprehensive Analysis (2019-2033)
This comprehensive report provides an in-depth analysis of the global Oil and Gas Accumulator market, offering valuable insights for stakeholders across the energy sector. The study covers the period from 2019 to 2033, with a base year of 2025 and a forecast period of 2025-2033. The report meticulously examines market dynamics, technological advancements, competitive landscape, and future growth prospects. Key market segments, including application (Drilling, Well Workover and Intervention, Others) and location of deployment (Onshore, Offshore), are thoroughly analyzed, providing a granular understanding of market segmentation and growth trajectories. The report also features detailed profiles of key players, including Parker-Hannifin Corp, Rotec Hydraulics Ltd, Eaton Corporation PLC, Roth Industries LLC, Technetics Group, Hydac, Freudenberg Group, Etola Group (Hydroll), Nippon Accumulator Co Ltd, and Paccar.
Oil and Gas Accumulator Market Market Concentration & Innovation
The Oil and Gas Accumulator market exhibits a moderately concentrated structure, with a few major players holding significant market share. However, the presence of numerous smaller players and emerging innovative companies indicates a dynamic competitive landscape. Market share data for 2024 estimates Parker-Hannifin Corp at approximately 18%, Eaton Corporation PLC at 15%, and Hydac at 12%, while the remaining market share is distributed among other players. Innovation is a key driver, fueled by the need for enhanced efficiency, safety, and reliability in oil and gas operations. The introduction of hybrid accumulators and advanced control systems reflects this trend. Regulatory frameworks, particularly concerning environmental compliance and safety standards, significantly impact market dynamics. Product substitutes are limited, with the core function of accumulators remaining largely irreplaceable. End-user trends favor energy-efficient and technologically advanced solutions, driving demand for sophisticated accumulator systems. M&A activity in the sector has been moderate in recent years, with a few notable deals involving smaller players valued at approximately xx Million in 2023, primarily driven by consolidation and expansion of product portfolios.
Oil and Gas Accumulator Market Industry Trends & Insights
The global Oil and Gas Accumulator market is projected to experience robust growth during the forecast period, driven primarily by the expansion of offshore oil and gas exploration and production activities. The rising demand for advanced accumulator systems to improve operational efficiency and safety, coupled with the increasing adoption of hybrid accumulators, contributes significantly to market expansion. Technological disruptions, including advancements in materials science and control systems, continuously reshape market dynamics. Consumer preferences, shaped by a focus on sustainability and operational reliability, influence the demand for technologically superior accumulators. Competitive dynamics are characterized by intense rivalry among established players and the emergence of innovative startups. The market exhibits a CAGR of approximately 6% during the forecast period (2025-2033), with a market penetration rate of approximately 75% in developed regions by 2033. These figures reflect the continuous growth and increasing adoption of accumulator systems within the oil and gas industry.
Dominant Markets & Segments in Oil and Gas Accumulator Market
Leading Region/Country: North America currently holds the largest market share, driven by robust oil and gas exploration and production activities, particularly in the United States. The region's well-established infrastructure and technological advancements contribute to its dominance.
Dominant Segment (Application): The Drilling segment constitutes the largest share of the Oil and Gas Accumulator market. This is primarily due to the critical role of accumulators in ensuring efficient and safe drilling operations. The Well Workover and Intervention segment also experiences significant demand.
Dominant Segment (Location): The Offshore segment is experiencing rapid growth, propelled by the ongoing expansion of offshore oil and gas exploration and production activities. This segment is particularly lucrative due to the demanding operational conditions in offshore environments.
Key Drivers for Dominance:
- North America: Robust oil and gas production, established infrastructure, and technological leadership.
- Drilling (Application): Essential role in drilling operations, driving high demand.
- Offshore (Location): Expansion of offshore activities, necessitating specialized accumulator systems.
Oil and Gas Accumulator Market Product Developments
Recent product innovations in the Oil and Gas Accumulator market emphasize enhanced durability, efficiency, and safety. The introduction of hybrid accumulators combines the advantages of various accumulator types, offering improved performance and cost-effectiveness. Advanced control systems provide precise pressure regulation and optimized energy management. These innovations enhance the overall reliability and operational efficiency of oil and gas operations, offering a significant competitive advantage to manufacturers. The focus on lighter weight, more compact designs enhances portability and adaptability for diverse applications.
Report Scope & Segmentation Analysis
Application: The report segments the market by application into Drilling, Well Workover and Intervention, and Others. The drilling segment is projected to dominate, driven by high demand from oil and gas exploration and production activities. The Well Workover and Intervention segment is also expected to grow significantly. Growth projections for each segment are included in the complete report.
Location of Deployment: The market is segmented by location of deployment into Onshore and Offshore. The Offshore segment is poised for substantial growth due to increasing offshore exploration and production activities. The onshore segment continues to hold significant market share, driven by traditional oil and gas production activities. Market sizes and competitive dynamics for each segment are detailed in the full report.
Key Drivers of Oil and Gas Accumulator Market Growth
The Oil and Gas Accumulator market is propelled by several key drivers. Technological advancements, such as the introduction of hybrid accumulators and advanced control systems, significantly enhance the performance and efficiency of these systems. The ongoing expansion of offshore oil and gas exploration and production activities fuels substantial demand for robust and reliable accumulator solutions. Stringent safety regulations and environmental concerns drive the adoption of advanced accumulators that minimize environmental impact and enhance operational safety.
Challenges in the Oil and Gas Accumulator Market Sector
The Oil and Gas Accumulator market faces several challenges, including volatile oil and gas prices impacting investment decisions. Supply chain disruptions due to geopolitical instability can also lead to production delays and increased costs. Intense competition among established players and emerging companies requires continuous innovation and cost optimization. Furthermore, stringent regulatory compliance requirements necessitate significant investments in product development and certification, adding to operational costs.
Emerging Opportunities in Oil and Gas Accumulator Market
Emerging opportunities lie in the development of highly specialized accumulators for specific applications and regions. The growing focus on environmentally friendly operations creates opportunities for the development of sustainable accumulator technologies. The expanding market for unconventional oil and gas extraction presents significant opportunities for companies that offer robust and adaptable accumulator systems. The integration of advanced monitoring and predictive maintenance capabilities offers substantial potential for growth.
Leading Players in the Oil and Gas Accumulator Market Market
- Parker-Hannifin Corp
- Rotec Hydraulics Ltd
- Eaton Corporation PLC
- Roth Industries LLC
- Technetics Group
- Hydac
- Freudenberg Group
- Etola Group (Hydroll)
- Nippon Accumulator Co Ltd
- Paccar
Key Developments in Oil and Gas Accumulator Market Industry
- 2022 Q4: Parker-Hannifin Corp announces the launch of a new line of hybrid accumulators with enhanced efficiency and durability.
- 2023 Q1: Eaton Corporation PLC unveils advanced control systems for accumulators, improving precision and safety.
- 2024 Q2: Significant expansion of offshore oil and gas exploration projects in the Gulf of Mexico announced, leading to increased demand for specialized accumulator solutions.
Strategic Outlook for Oil and Gas Accumulator Market Market
The Oil and Gas Accumulator market is poised for sustained growth, driven by technological advancements, increasing oil and gas production activities, and the focus on operational efficiency and safety. Opportunities for growth are plentiful, particularly in offshore applications and the development of sustainable accumulator technologies. Companies that invest in research and development, and adapt to changing regulatory environments, are well-positioned to capitalize on the market's potential. The expansion into new geographical markets and diversification of product portfolios will play a crucial role in shaping the future of the industry.
Oil and Gas Accumulator Market Segmentation
-
1. Application
- 1.1. Drilling
- 1.2. Well Workover and Intrervention
- 1.3. Others
-
2. Location of Deployment
- 2.1. Onshore
- 2.2. Offshore
Oil and Gas Accumulator Market Segmentation By Geography
- 1. North America
- 2. Europe
- 3. Asia Pacific
- 4. South America
- 5. Middle East and Africa
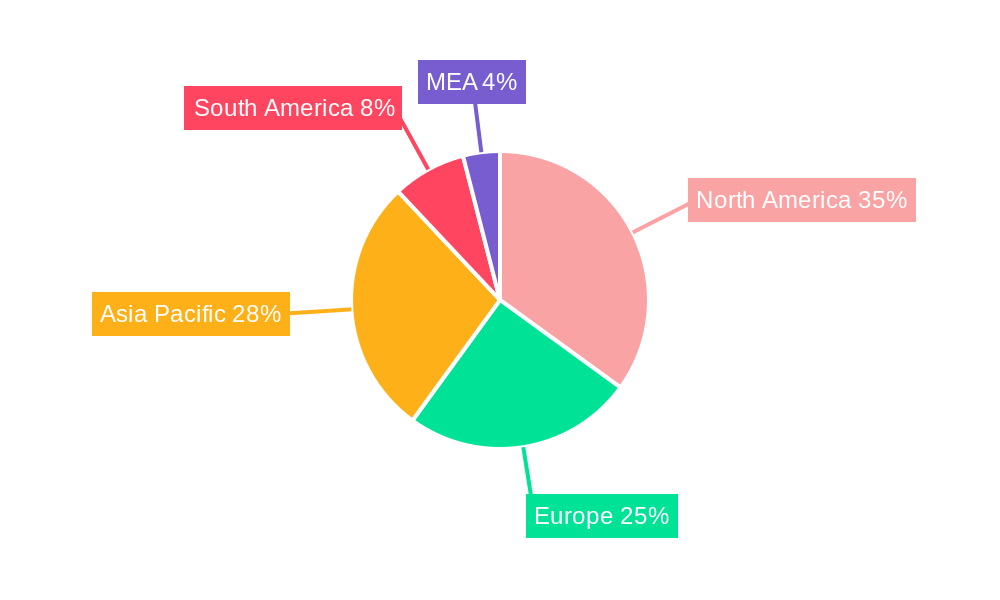
Oil and Gas Accumulator Market Regional Market Share
Geographic Coverage of Oil and Gas Accumulator Market
Oil and Gas Accumulator Market REPORT HIGHLIGHTS
| Aspects | Details |
|---|---|
| Study Period | 2020-2034 |
| Base Year | 2025 |
| Estimated Year | 2026 |
| Forecast Period | 2026-2034 |
| Historical Period | 2020-2025 |
| Growth Rate | CAGR of 4.86% from 2020-2034 |
| Segmentation |
|
Table of Contents
- 1. Introduction
- 1.1. Research Scope
- 1.2. Market Segmentation
- 1.3. Research Methodology
- 1.4. Definitions and Assumptions
- 2. Executive Summary
- 2.1. Introduction
- 3. Market Dynamics
- 3.1. Introduction
- 3.2. Market Drivers
- 3.2.1. 4.; Growing Energy Demand4.; Renewable Energy Transition
- 3.3. Market Restrains
- 3.3.1. 4.; Phasing out of Conventional Sources of Electricity
- 3.4. Market Trends
- 3.4.1. Onshore Segment Expected to Dominate the Market
- 4. Market Factor Analysis
- 4.1. Porters Five Forces
- 4.2. Supply/Value Chain
- 4.3. PESTEL analysis
- 4.4. Market Entropy
- 4.5. Patent/Trademark Analysis
- 5. Global Oil and Gas Accumulator Market Analysis, Insights and Forecast, 2020-2032
- 5.1. Market Analysis, Insights and Forecast - by Application
- 5.1.1. Drilling
- 5.1.2. Well Workover and Intrervention
- 5.1.3. Others
- 5.2. Market Analysis, Insights and Forecast - by Location of Deployment
- 5.2.1. Onshore
- 5.2.2. Offshore
- 5.3. Market Analysis, Insights and Forecast - by Region
- 5.3.1. North America
- 5.3.2. Europe
- 5.3.3. Asia Pacific
- 5.3.4. South America
- 5.3.5. Middle East and Africa
- 5.1. Market Analysis, Insights and Forecast - by Application
- 6. North America Oil and Gas Accumulator Market Analysis, Insights and Forecast, 2020-2032
- 6.1. Market Analysis, Insights and Forecast - by Application
- 6.1.1. Drilling
- 6.1.2. Well Workover and Intrervention
- 6.1.3. Others
- 6.2. Market Analysis, Insights and Forecast - by Location of Deployment
- 6.2.1. Onshore
- 6.2.2. Offshore
- 6.1. Market Analysis, Insights and Forecast - by Application
- 7. Europe Oil and Gas Accumulator Market Analysis, Insights and Forecast, 2020-2032
- 7.1. Market Analysis, Insights and Forecast - by Application
- 7.1.1. Drilling
- 7.1.2. Well Workover and Intrervention
- 7.1.3. Others
- 7.2. Market Analysis, Insights and Forecast - by Location of Deployment
- 7.2.1. Onshore
- 7.2.2. Offshore
- 7.1. Market Analysis, Insights and Forecast - by Application
- 8. Asia Pacific Oil and Gas Accumulator Market Analysis, Insights and Forecast, 2020-2032
- 8.1. Market Analysis, Insights and Forecast - by Application
- 8.1.1. Drilling
- 8.1.2. Well Workover and Intrervention
- 8.1.3. Others
- 8.2. Market Analysis, Insights and Forecast - by Location of Deployment
- 8.2.1. Onshore
- 8.2.2. Offshore
- 8.1. Market Analysis, Insights and Forecast - by Application
- 9. South America Oil and Gas Accumulator Market Analysis, Insights and Forecast, 2020-2032
- 9.1. Market Analysis, Insights and Forecast - by Application
- 9.1.1. Drilling
- 9.1.2. Well Workover and Intrervention
- 9.1.3. Others
- 9.2. Market Analysis, Insights and Forecast - by Location of Deployment
- 9.2.1. Onshore
- 9.2.2. Offshore
- 9.1. Market Analysis, Insights and Forecast - by Application
- 10. Middle East and Africa Oil and Gas Accumulator Market Analysis, Insights and Forecast, 2020-2032
- 10.1. Market Analysis, Insights and Forecast - by Application
- 10.1.1. Drilling
- 10.1.2. Well Workover and Intrervention
- 10.1.3. Others
- 10.2. Market Analysis, Insights and Forecast - by Location of Deployment
- 10.2.1. Onshore
- 10.2.2. Offshore
- 10.1. Market Analysis, Insights and Forecast - by Application
- 11. Competitive Analysis
- 11.1. Global Market Share Analysis 2025
- 11.2. Company Profiles
- 11.2.1 Parker-Hannifin Corp
- 11.2.1.1. Overview
- 11.2.1.2. Products
- 11.2.1.3. SWOT Analysis
- 11.2.1.4. Recent Developments
- 11.2.1.5. Financials (Based on Availability)
- 11.2.2 Rotec Hydraulics Ltd
- 11.2.2.1. Overview
- 11.2.2.2. Products
- 11.2.2.3. SWOT Analysis
- 11.2.2.4. Recent Developments
- 11.2.2.5. Financials (Based on Availability)
- 11.2.3 Eaton Corporation PLC
- 11.2.3.1. Overview
- 11.2.3.2. Products
- 11.2.3.3. SWOT Analysis
- 11.2.3.4. Recent Developments
- 11.2.3.5. Financials (Based on Availability)
- 11.2.4 Roth Industries LLC
- 11.2.4.1. Overview
- 11.2.4.2. Products
- 11.2.4.3. SWOT Analysis
- 11.2.4.4. Recent Developments
- 11.2.4.5. Financials (Based on Availability)
- 11.2.5 Technetics Group*List Not Exhaustive
- 11.2.5.1. Overview
- 11.2.5.2. Products
- 11.2.5.3. SWOT Analysis
- 11.2.5.4. Recent Developments
- 11.2.5.5. Financials (Based on Availability)
- 11.2.6 Hydac
- 11.2.6.1. Overview
- 11.2.6.2. Products
- 11.2.6.3. SWOT Analysis
- 11.2.6.4. Recent Developments
- 11.2.6.5. Financials (Based on Availability)
- 11.2.7 Freudenberg Group
- 11.2.7.1. Overview
- 11.2.7.2. Products
- 11.2.7.3. SWOT Analysis
- 11.2.7.4. Recent Developments
- 11.2.7.5. Financials (Based on Availability)
- 11.2.8 Etola Group (Hydroll)
- 11.2.8.1. Overview
- 11.2.8.2. Products
- 11.2.8.3. SWOT Analysis
- 11.2.8.4. Recent Developments
- 11.2.8.5. Financials (Based on Availability)
- 11.2.9 Nippon Accumulator Co Ltd
- 11.2.9.1. Overview
- 11.2.9.2. Products
- 11.2.9.3. SWOT Analysis
- 11.2.9.4. Recent Developments
- 11.2.9.5. Financials (Based on Availability)
- 11.2.10 Paccar
- 11.2.10.1. Overview
- 11.2.10.2. Products
- 11.2.10.3. SWOT Analysis
- 11.2.10.4. Recent Developments
- 11.2.10.5. Financials (Based on Availability)
- 11.2.1 Parker-Hannifin Corp
List of Figures
- Figure 1: Global Oil and Gas Accumulator Market Revenue Breakdown (million, %) by Region 2025 & 2033
- Figure 2: Global Oil and Gas Accumulator Market Volume Breakdown (K Units, %) by Region 2025 & 2033
- Figure 3: North America Oil and Gas Accumulator Market Revenue (million), by Application 2025 & 2033
- Figure 4: North America Oil and Gas Accumulator Market Volume (K Units), by Application 2025 & 2033
- Figure 5: North America Oil and Gas Accumulator Market Revenue Share (%), by Application 2025 & 2033
- Figure 6: North America Oil and Gas Accumulator Market Volume Share (%), by Application 2025 & 2033
- Figure 7: North America Oil and Gas Accumulator Market Revenue (million), by Location of Deployment 2025 & 2033
- Figure 8: North America Oil and Gas Accumulator Market Volume (K Units), by Location of Deployment 2025 & 2033
- Figure 9: North America Oil and Gas Accumulator Market Revenue Share (%), by Location of Deployment 2025 & 2033
- Figure 10: North America Oil and Gas Accumulator Market Volume Share (%), by Location of Deployment 2025 & 2033
- Figure 11: North America Oil and Gas Accumulator Market Revenue (million), by Country 2025 & 2033
- Figure 12: North America Oil and Gas Accumulator Market Volume (K Units), by Country 2025 & 2033
- Figure 13: North America Oil and Gas Accumulator Market Revenue Share (%), by Country 2025 & 2033
- Figure 14: North America Oil and Gas Accumulator Market Volume Share (%), by Country 2025 & 2033
- Figure 15: Europe Oil and Gas Accumulator Market Revenue (million), by Application 2025 & 2033
- Figure 16: Europe Oil and Gas Accumulator Market Volume (K Units), by Application 2025 & 2033
- Figure 17: Europe Oil and Gas Accumulator Market Revenue Share (%), by Application 2025 & 2033
- Figure 18: Europe Oil and Gas Accumulator Market Volume Share (%), by Application 2025 & 2033
- Figure 19: Europe Oil and Gas Accumulator Market Revenue (million), by Location of Deployment 2025 & 2033
- Figure 20: Europe Oil and Gas Accumulator Market Volume (K Units), by Location of Deployment 2025 & 2033
- Figure 21: Europe Oil and Gas Accumulator Market Revenue Share (%), by Location of Deployment 2025 & 2033
- Figure 22: Europe Oil and Gas Accumulator Market Volume Share (%), by Location of Deployment 2025 & 2033
- Figure 23: Europe Oil and Gas Accumulator Market Revenue (million), by Country 2025 & 2033
- Figure 24: Europe Oil and Gas Accumulator Market Volume (K Units), by Country 2025 & 2033
- Figure 25: Europe Oil and Gas Accumulator Market Revenue Share (%), by Country 2025 & 2033
- Figure 26: Europe Oil and Gas Accumulator Market Volume Share (%), by Country 2025 & 2033
- Figure 27: Asia Pacific Oil and Gas Accumulator Market Revenue (million), by Application 2025 & 2033
- Figure 28: Asia Pacific Oil and Gas Accumulator Market Volume (K Units), by Application 2025 & 2033
- Figure 29: Asia Pacific Oil and Gas Accumulator Market Revenue Share (%), by Application 2025 & 2033
- Figure 30: Asia Pacific Oil and Gas Accumulator Market Volume Share (%), by Application 2025 & 2033
- Figure 31: Asia Pacific Oil and Gas Accumulator Market Revenue (million), by Location of Deployment 2025 & 2033
- Figure 32: Asia Pacific Oil and Gas Accumulator Market Volume (K Units), by Location of Deployment 2025 & 2033
- Figure 33: Asia Pacific Oil and Gas Accumulator Market Revenue Share (%), by Location of Deployment 2025 & 2033
- Figure 34: Asia Pacific Oil and Gas Accumulator Market Volume Share (%), by Location of Deployment 2025 & 2033
- Figure 35: Asia Pacific Oil and Gas Accumulator Market Revenue (million), by Country 2025 & 2033
- Figure 36: Asia Pacific Oil and Gas Accumulator Market Volume (K Units), by Country 2025 & 2033
- Figure 37: Asia Pacific Oil and Gas Accumulator Market Revenue Share (%), by Country 2025 & 2033
- Figure 38: Asia Pacific Oil and Gas Accumulator Market Volume Share (%), by Country 2025 & 2033
- Figure 39: South America Oil and Gas Accumulator Market Revenue (million), by Application 2025 & 2033
- Figure 40: South America Oil and Gas Accumulator Market Volume (K Units), by Application 2025 & 2033
- Figure 41: South America Oil and Gas Accumulator Market Revenue Share (%), by Application 2025 & 2033
- Figure 42: South America Oil and Gas Accumulator Market Volume Share (%), by Application 2025 & 2033
- Figure 43: South America Oil and Gas Accumulator Market Revenue (million), by Location of Deployment 2025 & 2033
- Figure 44: South America Oil and Gas Accumulator Market Volume (K Units), by Location of Deployment 2025 & 2033
- Figure 45: South America Oil and Gas Accumulator Market Revenue Share (%), by Location of Deployment 2025 & 2033
- Figure 46: South America Oil and Gas Accumulator Market Volume Share (%), by Location of Deployment 2025 & 2033
- Figure 47: South America Oil and Gas Accumulator Market Revenue (million), by Country 2025 & 2033
- Figure 48: South America Oil and Gas Accumulator Market Volume (K Units), by Country 2025 & 2033
- Figure 49: South America Oil and Gas Accumulator Market Revenue Share (%), by Country 2025 & 2033
- Figure 50: South America Oil and Gas Accumulator Market Volume Share (%), by Country 2025 & 2033
- Figure 51: Middle East and Africa Oil and Gas Accumulator Market Revenue (million), by Application 2025 & 2033
- Figure 52: Middle East and Africa Oil and Gas Accumulator Market Volume (K Units), by Application 2025 & 2033
- Figure 53: Middle East and Africa Oil and Gas Accumulator Market Revenue Share (%), by Application 2025 & 2033
- Figure 54: Middle East and Africa Oil and Gas Accumulator Market Volume Share (%), by Application 2025 & 2033
- Figure 55: Middle East and Africa Oil and Gas Accumulator Market Revenue (million), by Location of Deployment 2025 & 2033
- Figure 56: Middle East and Africa Oil and Gas Accumulator Market Volume (K Units), by Location of Deployment 2025 & 2033
- Figure 57: Middle East and Africa Oil and Gas Accumulator Market Revenue Share (%), by Location of Deployment 2025 & 2033
- Figure 58: Middle East and Africa Oil and Gas Accumulator Market Volume Share (%), by Location of Deployment 2025 & 2033
- Figure 59: Middle East and Africa Oil and Gas Accumulator Market Revenue (million), by Country 2025 & 2033
- Figure 60: Middle East and Africa Oil and Gas Accumulator Market Volume (K Units), by Country 2025 & 2033
- Figure 61: Middle East and Africa Oil and Gas Accumulator Market Revenue Share (%), by Country 2025 & 2033
- Figure 62: Middle East and Africa Oil and Gas Accumulator Market Volume Share (%), by Country 2025 & 2033
List of Tables
- Table 1: Global Oil and Gas Accumulator Market Revenue million Forecast, by Application 2020 & 2033
- Table 2: Global Oil and Gas Accumulator Market Volume K Units Forecast, by Application 2020 & 2033
- Table 3: Global Oil and Gas Accumulator Market Revenue million Forecast, by Location of Deployment 2020 & 2033
- Table 4: Global Oil and Gas Accumulator Market Volume K Units Forecast, by Location of Deployment 2020 & 2033
- Table 5: Global Oil and Gas Accumulator Market Revenue million Forecast, by Region 2020 & 2033
- Table 6: Global Oil and Gas Accumulator Market Volume K Units Forecast, by Region 2020 & 2033
- Table 7: Global Oil and Gas Accumulator Market Revenue million Forecast, by Application 2020 & 2033
- Table 8: Global Oil and Gas Accumulator Market Volume K Units Forecast, by Application 2020 & 2033
- Table 9: Global Oil and Gas Accumulator Market Revenue million Forecast, by Location of Deployment 2020 & 2033
- Table 10: Global Oil and Gas Accumulator Market Volume K Units Forecast, by Location of Deployment 2020 & 2033
- Table 11: Global Oil and Gas Accumulator Market Revenue million Forecast, by Country 2020 & 2033
- Table 12: Global Oil and Gas Accumulator Market Volume K Units Forecast, by Country 2020 & 2033
- Table 13: Global Oil and Gas Accumulator Market Revenue million Forecast, by Application 2020 & 2033
- Table 14: Global Oil and Gas Accumulator Market Volume K Units Forecast, by Application 2020 & 2033
- Table 15: Global Oil and Gas Accumulator Market Revenue million Forecast, by Location of Deployment 2020 & 2033
- Table 16: Global Oil and Gas Accumulator Market Volume K Units Forecast, by Location of Deployment 2020 & 2033
- Table 17: Global Oil and Gas Accumulator Market Revenue million Forecast, by Country 2020 & 2033
- Table 18: Global Oil and Gas Accumulator Market Volume K Units Forecast, by Country 2020 & 2033
- Table 19: Global Oil and Gas Accumulator Market Revenue million Forecast, by Application 2020 & 2033
- Table 20: Global Oil and Gas Accumulator Market Volume K Units Forecast, by Application 2020 & 2033
- Table 21: Global Oil and Gas Accumulator Market Revenue million Forecast, by Location of Deployment 2020 & 2033
- Table 22: Global Oil and Gas Accumulator Market Volume K Units Forecast, by Location of Deployment 2020 & 2033
- Table 23: Global Oil and Gas Accumulator Market Revenue million Forecast, by Country 2020 & 2033
- Table 24: Global Oil and Gas Accumulator Market Volume K Units Forecast, by Country 2020 & 2033
- Table 25: Global Oil and Gas Accumulator Market Revenue million Forecast, by Application 2020 & 2033
- Table 26: Global Oil and Gas Accumulator Market Volume K Units Forecast, by Application 2020 & 2033
- Table 27: Global Oil and Gas Accumulator Market Revenue million Forecast, by Location of Deployment 2020 & 2033
- Table 28: Global Oil and Gas Accumulator Market Volume K Units Forecast, by Location of Deployment 2020 & 2033
- Table 29: Global Oil and Gas Accumulator Market Revenue million Forecast, by Country 2020 & 2033
- Table 30: Global Oil and Gas Accumulator Market Volume K Units Forecast, by Country 2020 & 2033
- Table 31: Global Oil and Gas Accumulator Market Revenue million Forecast, by Application 2020 & 2033
- Table 32: Global Oil and Gas Accumulator Market Volume K Units Forecast, by Application 2020 & 2033
- Table 33: Global Oil and Gas Accumulator Market Revenue million Forecast, by Location of Deployment 2020 & 2033
- Table 34: Global Oil and Gas Accumulator Market Volume K Units Forecast, by Location of Deployment 2020 & 2033
- Table 35: Global Oil and Gas Accumulator Market Revenue million Forecast, by Country 2020 & 2033
- Table 36: Global Oil and Gas Accumulator Market Volume K Units Forecast, by Country 2020 & 2033
Frequently Asked Questions
1. What is the projected Compound Annual Growth Rate (CAGR) of the Oil and Gas Accumulator Market?
The projected CAGR is approximately 4.86%.
2. Which companies are prominent players in the Oil and Gas Accumulator Market?
Key companies in the market include Parker-Hannifin Corp, Rotec Hydraulics Ltd, Eaton Corporation PLC, Roth Industries LLC, Technetics Group*List Not Exhaustive, Hydac, Freudenberg Group, Etola Group (Hydroll), Nippon Accumulator Co Ltd, Paccar.
3. What are the main segments of the Oil and Gas Accumulator Market?
The market segments include Application, Location of Deployment.
4. Can you provide details about the market size?
The market size is estimated to be USD 629.47 million as of 2022.
5. What are some drivers contributing to market growth?
4.; Growing Energy Demand4.; Renewable Energy Transition.
6. What are the notable trends driving market growth?
Onshore Segment Expected to Dominate the Market.
7. Are there any restraints impacting market growth?
4.; Phasing out of Conventional Sources of Electricity.
8. Can you provide examples of recent developments in the market?
Introduction of hybrid accumulators
9. What pricing options are available for accessing the report?
Pricing options include single-user, multi-user, and enterprise licenses priced at USD 4750, USD 5250, and USD 8750 respectively.
10. Is the market size provided in terms of value or volume?
The market size is provided in terms of value, measured in million and volume, measured in K Units.
11. Are there any specific market keywords associated with the report?
Yes, the market keyword associated with the report is "Oil and Gas Accumulator Market," which aids in identifying and referencing the specific market segment covered.
12. How do I determine which pricing option suits my needs best?
The pricing options vary based on user requirements and access needs. Individual users may opt for single-user licenses, while businesses requiring broader access may choose multi-user or enterprise licenses for cost-effective access to the report.
13. Are there any additional resources or data provided in the Oil and Gas Accumulator Market report?
While the report offers comprehensive insights, it's advisable to review the specific contents or supplementary materials provided to ascertain if additional resources or data are available.
14. How can I stay updated on further developments or reports in the Oil and Gas Accumulator Market?
To stay informed about further developments, trends, and reports in the Oil and Gas Accumulator Market, consider subscribing to industry newsletters, following relevant companies and organizations, or regularly checking reputable industry news sources and publications.
Methodology
Step 1 - Identification of Relevant Samples Size from Population Database


Step 2 - Approaches for Defining Global Market Size (Value, Volume* & Price*)

Note*: In applicable scenarios
Step 3 - Data Sources
Primary Research
- Web Analytics
- Survey Reports
- Research Institute
- Latest Research Reports
- Opinion Leaders
Secondary Research
- Annual Reports
- White Paper
- Latest Press Release
- Industry Association
- Paid Database
- Investor Presentations

Step 4 - Data Triangulation
Involves using different sources of information in order to increase the validity of a study
These sources are likely to be stakeholders in a program - participants, other researchers, program staff, other community members, and so on.
Then we put all data in single framework & apply various statistical tools to find out the dynamic on the market.
During the analysis stage, feedback from the stakeholder groups would be compared to determine areas of agreement as well as areas of divergence