
Key Insights
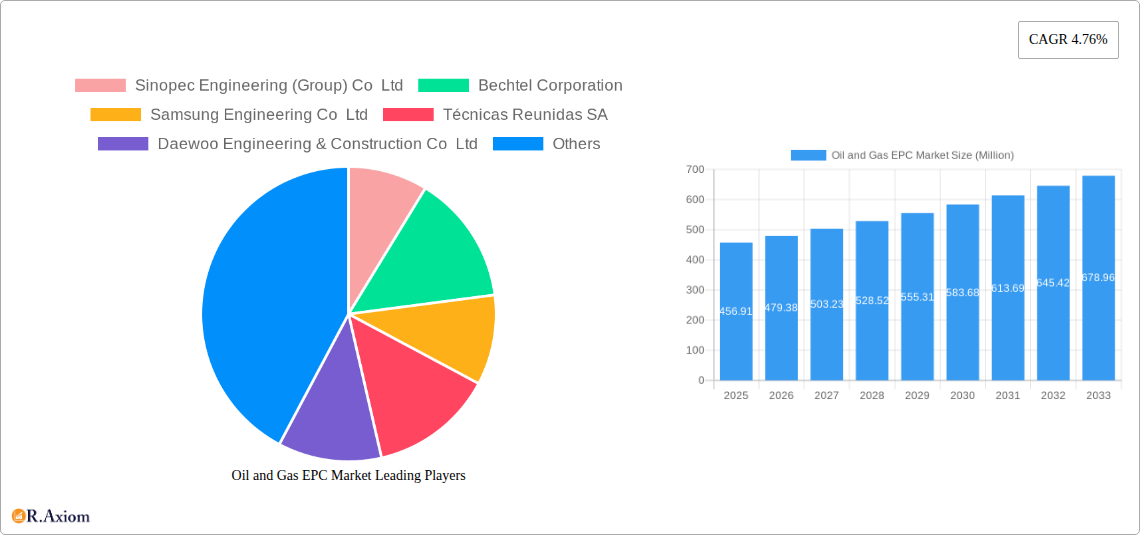
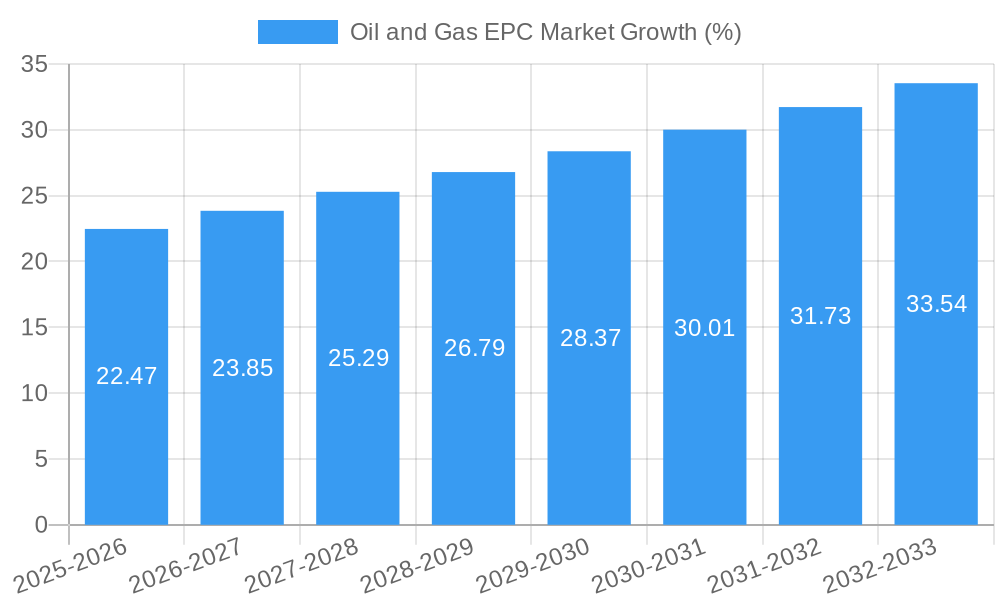
The Oil and Gas Engineering, Procurement, and Construction (EPC) market, valued at $456.91 million in 2025, is projected to experience robust growth, driven by increasing global energy demand and substantial investments in oil and gas infrastructure projects. A Compound Annual Growth Rate (CAGR) of 4.76% from 2025 to 2033 indicates a significant expansion of the market, reaching an estimated value exceeding $650 million by 2033. This growth is fueled by several factors, including the ongoing exploration and development of new oil and gas reserves, particularly in regions like the Middle East and Asia-Pacific, coupled with the need for modernization and expansion of existing infrastructure to meet rising energy consumption. Government initiatives supporting energy security and the transition to cleaner energy sources, including investment in carbon capture and storage technologies within oil and gas operations, are also contributing to market expansion.
However, the market faces certain restraints. Fluctuations in global oil and gas prices, geopolitical instability impacting project timelines and investments, and increasing regulatory scrutiny regarding environmental impact and safety standards pose challenges. Competition among major EPC contractors like Sinopec Engineering, Bechtel, Samsung Engineering, and others is fierce, driving innovation and efficiency improvements. The market is segmented into upstream, midstream, and downstream sectors, with upstream activities (exploration and production) expected to dominate due to ongoing exploration efforts. Regional growth is expected to be particularly strong in Asia-Pacific and the Middle East, reflecting substantial investments in infrastructure development within these regions. The continued focus on improving operational efficiency, incorporating sustainable practices, and deploying advanced technologies will be crucial for EPC companies to thrive in this dynamic market.
This in-depth report provides a comprehensive analysis of the Oil and Gas EPC market, offering actionable insights for stakeholders across the upstream, midstream, and downstream sectors. Covering the period from 2019 to 2033, with a focus on 2025, this report unveils market trends, competitive dynamics, and future growth potential. The report includes detailed segmentation analysis, highlighting key players, growth drivers, and challenges within this dynamic industry.
Oil and Gas EPC Market Concentration & Innovation
The Oil and Gas EPC market exhibits a moderately concentrated structure, with a few major players holding significant market share. Competition is fierce, driven by technological innovation, evolving regulatory landscapes, and shifting end-user demands. The market share of the top five players in 2024 is estimated at xx%, indicating room for both expansion and consolidation. Mergers and acquisitions (M&A) activity has been significant in recent years, with deal values totaling approximately USD xx Billion in 2024. This consolidation is driven by a need to achieve economies of scale, access new technologies, and expand geographical reach.
- Market Concentration: Top 5 players control xx% of the market in 2024.
- Innovation Drivers: Digitalization, automation, and sustainable technologies are reshaping the EPC landscape.
- Regulatory Frameworks: Stringent environmental regulations and safety standards influence project design and execution.
- Product Substitutes: Advancements in modular construction and prefabrication present competitive alternatives.
- End-User Trends: Focus on cost optimization, project efficiency, and ESG (environmental, social, and governance) compliance shapes EPC project requirements.
- M&A Activity: Significant M&A activity in 2024 with total deal values of approximately USD xx Billion. This suggests a trend towards consolidation in the industry.
Oil and Gas EPC Market Industry Trends & Insights
The Oil and Gas EPC market is projected to experience significant growth during the forecast period (2025-2033), with a Compound Annual Growth Rate (CAGR) of xx%. This growth is fueled by several factors, including increasing global energy demand, investments in upstream projects, and expanding LNG capacity. Technological advancements, such as digital twin technology and advanced analytics, are driving efficiency gains and reducing project timelines. Market penetration of these technologies is steadily increasing, with xx% adoption projected by 2033. However, competitive pressures, fluctuating oil and gas prices, and geopolitical uncertainties pose challenges to sustained market growth. The shift towards renewable energy sources also presents a significant challenge, though the need for reliable transition infrastructure continues to provide opportunities for the EPC sector.
Dominant Markets & Segments in Oil and Gas EPC Market
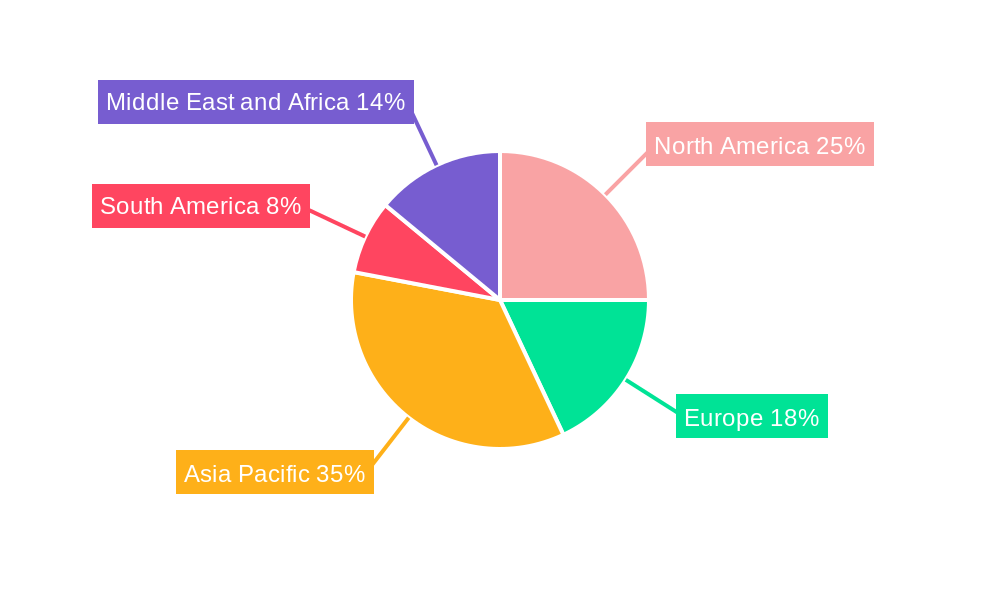
The Middle East and Asia-Pacific regions currently dominate the Oil and Gas EPC market, driven by substantial investments in oil and gas infrastructure. The upstream sector represents the largest segment, benefiting from ongoing exploration and production activities.
Dominant Regions and their Key Drivers:
- Middle East: Massive investments in LNG projects (e.g., QatarEnergy's North Field expansion) and substantial oil & gas reserves fuel significant EPC activity. Supportive government policies and robust infrastructure further enhance market growth.
- Asia-Pacific: Rapid industrialization and increasing energy demands are driving growth across all segments. Government initiatives focusing on infrastructure development support the sector's expansion.
Dominant Sectors and their Key Drivers:
- Upstream: Exploration, drilling, and production activities contribute significantly to market growth, influenced by global oil and gas demand and new discoveries.
- Midstream: Pipeline construction, storage facilities, and LNG processing plants drive demand for EPC services.
- Downstream: Refining, petrochemicals, and distribution activities require substantial EPC investment, influenced by fluctuations in product demand and global refining capacity.
Oil and Gas EPC Market Product Developments
Recent product innovations in the Oil and Gas EPC market focus on optimizing project execution through digitalization, modular construction, and prefabrication. These advancements improve efficiency, reduce project timelines, and enhance safety. This improved efficiency directly translates to cost savings for clients, providing a competitive advantage for EPC firms adopting these technologies. The integration of data analytics and artificial intelligence is also improving project planning and risk management.
Report Scope & Segmentation Analysis
This report segments the Oil and Gas EPC market by sector (Upstream, Midstream, Downstream) and geography. The Upstream sector is forecast to grow at a CAGR of xx% from 2025 to 2033, driven by investment in new oil and gas fields. The Midstream sector is expected to experience a CAGR of xx%, driven by increased investments in pipeline infrastructure. The Downstream sector is projected to grow at a CAGR of xx%, driven by expanding refining and petrochemical capacity. Competitive dynamics within each segment vary, reflecting specific technological and regional factors.
Key Drivers of Oil and Gas EPC Market Growth
Several factors drive growth in the Oil and Gas EPC market. Increased global energy demand, especially in developing economies, necessitates expansion of oil and gas infrastructure. Government support for large-scale projects, coupled with technological advancements offering efficiency gains, further stimulates market growth. The ongoing development of new oil and gas reserves also fuels demand for EPC services. Finally, the need for efficient and reliable infrastructure to support the transition to renewable energy sources provides further opportunity.
Challenges in the Oil and Gas EPC Market Sector
The Oil and Gas EPC market faces several challenges. Fluctuating oil and gas prices impact project viability and profitability. Geopolitical instability can disrupt supply chains and increase project risks. Stringent environmental regulations increase project complexities and costs. Lastly, fierce competition from other EPC firms requires continuous innovation and cost optimization. These challenges, combined, put pressure on margins.
Emerging Opportunities in Oil and Gas EPC Market
Opportunities abound in the Oil and Gas EPC market. The growing demand for LNG is creating substantial opportunities, particularly in Asia and the Middle East. Advancements in digitalization, modular construction, and prefabrication provide opportunities for improved efficiency and cost savings. Focus on sustainability initiatives within the oil and gas sector creates a demand for EPC services focused on reducing environmental impact.
Leading Players in the Oil and Gas EPC Market Market
- Sinopec Engineering (Group) Co Ltd
- Bechtel Corporation
- Samsung Engineering Co Ltd
- Técnicas Reunidas SA
- Daewoo Engineering & Construction Co Ltd
- National Petroleum Construction Company
- KBR Inc
- Petrofac Limited
- Hyundai Engineering & Construction Co Ltd
- Saipem SpA
- Korea Shipbuilding & Offshore Engineering Co Ltd
- Fluor Corporation
- John Wood Group PLC
- TechnipFMC PLC
- McDermott International Ltd
Key Developments in Oil and Gas EPC Market Industry
- May 2023: QatarEnergy awards the EPC contract for the North Field South (NFS) project, expanding Qatar's LNG production capacity by 49 MTPA. This represents a significant boost to the market, particularly in the LNG sector.
- July 2022: Saipem SpA secures USD 1.25 billion in onshore and offshore contracts in the Middle East, highlighting the region's continued investment in oil and gas infrastructure. This showcases significant growth potential, particularly in offshore projects.
Strategic Outlook for Oil and Gas EPC Market Market
The Oil and Gas EPC market is poised for continued growth, driven by sustained global energy demand, technological advancements, and major investments in new projects. While challenges remain, the industry's capacity for innovation and adaptation, coupled with the ongoing need for energy infrastructure, ensures substantial long-term growth potential. Focus on sustainable and efficient solutions will be crucial for sustained success.
Oil and Gas EPC Market Segmentation
-
1. Sector
- 1.1. Upstream
- 1.2. Downstream
- 1.3. Midstream
Oil and Gas EPC Market Segmentation By Geography
-
1. North America
- 1.1. United States
- 1.2. Canada
- 1.3. Rest of North America
-
2. Europe
- 2.1. Germany
- 2.2. France
- 2.3. United Kingdom
- 2.4. Rest of Europe
-
3. Asia Pacific
- 3.1. China
- 3.2. India
- 3.3. Japan
- 3.4. South Korea
- 3.5. Rest of Asia Pacific
-
4. South America
- 4.1. Brazil
- 4.2. Argentina
- 4.3. Rest of South America
-
5. Middle East and Africa
- 5.1. Saudi Arabia
- 5.2. United Arab Emirates
- 5.3. South Africa
- 5.4. Rest of Middle East and Africa
Oil and Gas EPC Market REPORT HIGHLIGHTS
| Aspects | Details |
|---|---|
| Study Period | 2019-2033 |
| Base Year | 2024 |
| Estimated Year | 2025 |
| Forecast Period | 2025-2033 |
| Historical Period | 2019-2024 |
| Growth Rate | CAGR of 4.76% from 2019-2033 |
| Segmentation |
|
Table of Contents
- 1. Introduction
- 1.1. Research Scope
- 1.2. Market Segmentation
- 1.3. Research Methodology
- 1.4. Definitions and Assumptions
- 2. Executive Summary
- 2.1. Introduction
- 3. Market Dynamics
- 3.1. Introduction
- 3.2. Market Drivers
- 3.2.1. 4.; Growing Demand to Develop the Natural Gas Infrastructure4.; Increase in Offshore Oil and Gas Exploration and Production (E&P) Activities
- 3.3. Market Restrains
- 3.3.1. 4.; High Volatility of Oil and Gas Prices
- 3.4. Market Trends
- 3.4.1. Upstream Segment Expected to Dominate the Market
- 4. Market Factor Analysis
- 4.1. Porters Five Forces
- 4.2. Supply/Value Chain
- 4.3. PESTEL analysis
- 4.4. Market Entropy
- 4.5. Patent/Trademark Analysis
- 5. Global Oil and Gas EPC Market Analysis, Insights and Forecast, 2019-2031
- 5.1. Market Analysis, Insights and Forecast - by Sector
- 5.1.1. Upstream
- 5.1.2. Downstream
- 5.1.3. Midstream
- 5.2. Market Analysis, Insights and Forecast - by Region
- 5.2.1. North America
- 5.2.2. Europe
- 5.2.3. Asia Pacific
- 5.2.4. South America
- 5.2.5. Middle East and Africa
- 5.1. Market Analysis, Insights and Forecast - by Sector
- 6. North America Oil and Gas EPC Market Analysis, Insights and Forecast, 2019-2031
- 6.1. Market Analysis, Insights and Forecast - by Sector
- 6.1.1. Upstream
- 6.1.2. Downstream
- 6.1.3. Midstream
- 6.1. Market Analysis, Insights and Forecast - by Sector
- 7. Europe Oil and Gas EPC Market Analysis, Insights and Forecast, 2019-2031
- 7.1. Market Analysis, Insights and Forecast - by Sector
- 7.1.1. Upstream
- 7.1.2. Downstream
- 7.1.3. Midstream
- 7.1. Market Analysis, Insights and Forecast - by Sector
- 8. Asia Pacific Oil and Gas EPC Market Analysis, Insights and Forecast, 2019-2031
- 8.1. Market Analysis, Insights and Forecast - by Sector
- 8.1.1. Upstream
- 8.1.2. Downstream
- 8.1.3. Midstream
- 8.1. Market Analysis, Insights and Forecast - by Sector
- 9. South America Oil and Gas EPC Market Analysis, Insights and Forecast, 2019-2031
- 9.1. Market Analysis, Insights and Forecast - by Sector
- 9.1.1. Upstream
- 9.1.2. Downstream
- 9.1.3. Midstream
- 9.1. Market Analysis, Insights and Forecast - by Sector
- 10. Middle East and Africa Oil and Gas EPC Market Analysis, Insights and Forecast, 2019-2031
- 10.1. Market Analysis, Insights and Forecast - by Sector
- 10.1.1. Upstream
- 10.1.2. Downstream
- 10.1.3. Midstream
- 10.1. Market Analysis, Insights and Forecast - by Sector
- 11. North America Oil and Gas EPC Market Analysis, Insights and Forecast, 2019-2031
- 11.1. Market Analysis, Insights and Forecast - By Country/Sub-region
- 11.1.1 United States
- 11.1.2 Canada
- 11.1.3 Rest of North America
- 12. Europe Oil and Gas EPC Market Analysis, Insights and Forecast, 2019-2031
- 12.1. Market Analysis, Insights and Forecast - By Country/Sub-region
- 12.1.1 Germany
- 12.1.2 France
- 12.1.3 United Kingdom
- 12.1.4 Rest of Europe
- 13. Asia Pacific Oil and Gas EPC Market Analysis, Insights and Forecast, 2019-2031
- 13.1. Market Analysis, Insights and Forecast - By Country/Sub-region
- 13.1.1 China
- 13.1.2 India
- 13.1.3 Japan
- 13.1.4 South Korea
- 13.1.5 Rest of Asia Pacific
- 14. South America Oil and Gas EPC Market Analysis, Insights and Forecast, 2019-2031
- 14.1. Market Analysis, Insights and Forecast - By Country/Sub-region
- 14.1.1 Brazil
- 14.1.2 Argentina
- 14.1.3 Rest of South America
- 15. Middle East and Africa Oil and Gas EPC Market Analysis, Insights and Forecast, 2019-2031
- 15.1. Market Analysis, Insights and Forecast - By Country/Sub-region
- 15.1.1 Saudi Arabia
- 15.1.2 United Arab Emirates
- 15.1.3 South Africa
- 15.1.4 Rest of Middle East and Africa
- 16. Competitive Analysis
- 16.1. Global Market Share Analysis 2024
- 16.2. Company Profiles
- 16.2.1 Sinopec Engineering (Group) Co Ltd
- 16.2.1.1. Overview
- 16.2.1.2. Products
- 16.2.1.3. SWOT Analysis
- 16.2.1.4. Recent Developments
- 16.2.1.5. Financials (Based on Availability)
- 16.2.2 Bechtel Corporation
- 16.2.2.1. Overview
- 16.2.2.2. Products
- 16.2.2.3. SWOT Analysis
- 16.2.2.4. Recent Developments
- 16.2.2.5. Financials (Based on Availability)
- 16.2.3 Samsung Engineering Co Ltd
- 16.2.3.1. Overview
- 16.2.3.2. Products
- 16.2.3.3. SWOT Analysis
- 16.2.3.4. Recent Developments
- 16.2.3.5. Financials (Based on Availability)
- 16.2.4 Técnicas Reunidas SA
- 16.2.4.1. Overview
- 16.2.4.2. Products
- 16.2.4.3. SWOT Analysis
- 16.2.4.4. Recent Developments
- 16.2.4.5. Financials (Based on Availability)
- 16.2.5 Daewoo Engineering & Construction Co Ltd
- 16.2.5.1. Overview
- 16.2.5.2. Products
- 16.2.5.3. SWOT Analysis
- 16.2.5.4. Recent Developments
- 16.2.5.5. Financials (Based on Availability)
- 16.2.6 National Petroleum Construction Company
- 16.2.6.1. Overview
- 16.2.6.2. Products
- 16.2.6.3. SWOT Analysis
- 16.2.6.4. Recent Developments
- 16.2.6.5. Financials (Based on Availability)
- 16.2.7 KBR Inc
- 16.2.7.1. Overview
- 16.2.7.2. Products
- 16.2.7.3. SWOT Analysis
- 16.2.7.4. Recent Developments
- 16.2.7.5. Financials (Based on Availability)
- 16.2.8 Petrofac Limited
- 16.2.8.1. Overview
- 16.2.8.2. Products
- 16.2.8.3. SWOT Analysis
- 16.2.8.4. Recent Developments
- 16.2.8.5. Financials (Based on Availability)
- 16.2.9 Hyundai Engineering & Construction Co Ltd
- 16.2.9.1. Overview
- 16.2.9.2. Products
- 16.2.9.3. SWOT Analysis
- 16.2.9.4. Recent Developments
- 16.2.9.5. Financials (Based on Availability)
- 16.2.10 Saipem SpA
- 16.2.10.1. Overview
- 16.2.10.2. Products
- 16.2.10.3. SWOT Analysis
- 16.2.10.4. Recent Developments
- 16.2.10.5. Financials (Based on Availability)
- 16.2.11 Korea Shipbuilding & Offshore Engineering Co Ltd
- 16.2.11.1. Overview
- 16.2.11.2. Products
- 16.2.11.3. SWOT Analysis
- 16.2.11.4. Recent Developments
- 16.2.11.5. Financials (Based on Availability)
- 16.2.12 Fluor Corporation
- 16.2.12.1. Overview
- 16.2.12.2. Products
- 16.2.12.3. SWOT Analysis
- 16.2.12.4. Recent Developments
- 16.2.12.5. Financials (Based on Availability)
- 16.2.13 John Wood Group PLC
- 16.2.13.1. Overview
- 16.2.13.2. Products
- 16.2.13.3. SWOT Analysis
- 16.2.13.4. Recent Developments
- 16.2.13.5. Financials (Based on Availability)
- 16.2.14 TechnipFMC PLC
- 16.2.14.1. Overview
- 16.2.14.2. Products
- 16.2.14.3. SWOT Analysis
- 16.2.14.4. Recent Developments
- 16.2.14.5. Financials (Based on Availability)
- 16.2.15 McDermott International Ltd
- 16.2.15.1. Overview
- 16.2.15.2. Products
- 16.2.15.3. SWOT Analysis
- 16.2.15.4. Recent Developments
- 16.2.15.5. Financials (Based on Availability)
- 16.2.1 Sinopec Engineering (Group) Co Ltd
List of Figures
- Figure 1: Global Oil and Gas EPC Market Revenue Breakdown (Million, %) by Region 2024 & 2032
- Figure 2: North America Oil and Gas EPC Market Revenue (Million), by Country 2024 & 2032
- Figure 3: North America Oil and Gas EPC Market Revenue Share (%), by Country 2024 & 2032
- Figure 4: Europe Oil and Gas EPC Market Revenue (Million), by Country 2024 & 2032
- Figure 5: Europe Oil and Gas EPC Market Revenue Share (%), by Country 2024 & 2032
- Figure 6: Asia Pacific Oil and Gas EPC Market Revenue (Million), by Country 2024 & 2032
- Figure 7: Asia Pacific Oil and Gas EPC Market Revenue Share (%), by Country 2024 & 2032
- Figure 8: South America Oil and Gas EPC Market Revenue (Million), by Country 2024 & 2032
- Figure 9: South America Oil and Gas EPC Market Revenue Share (%), by Country 2024 & 2032
- Figure 10: Middle East and Africa Oil and Gas EPC Market Revenue (Million), by Country 2024 & 2032
- Figure 11: Middle East and Africa Oil and Gas EPC Market Revenue Share (%), by Country 2024 & 2032
- Figure 12: North America Oil and Gas EPC Market Revenue (Million), by Sector 2024 & 2032
- Figure 13: North America Oil and Gas EPC Market Revenue Share (%), by Sector 2024 & 2032
- Figure 14: North America Oil and Gas EPC Market Revenue (Million), by Country 2024 & 2032
- Figure 15: North America Oil and Gas EPC Market Revenue Share (%), by Country 2024 & 2032
- Figure 16: Europe Oil and Gas EPC Market Revenue (Million), by Sector 2024 & 2032
- Figure 17: Europe Oil and Gas EPC Market Revenue Share (%), by Sector 2024 & 2032
- Figure 18: Europe Oil and Gas EPC Market Revenue (Million), by Country 2024 & 2032
- Figure 19: Europe Oil and Gas EPC Market Revenue Share (%), by Country 2024 & 2032
- Figure 20: Asia Pacific Oil and Gas EPC Market Revenue (Million), by Sector 2024 & 2032
- Figure 21: Asia Pacific Oil and Gas EPC Market Revenue Share (%), by Sector 2024 & 2032
- Figure 22: Asia Pacific Oil and Gas EPC Market Revenue (Million), by Country 2024 & 2032
- Figure 23: Asia Pacific Oil and Gas EPC Market Revenue Share (%), by Country 2024 & 2032
- Figure 24: South America Oil and Gas EPC Market Revenue (Million), by Sector 2024 & 2032
- Figure 25: South America Oil and Gas EPC Market Revenue Share (%), by Sector 2024 & 2032
- Figure 26: South America Oil and Gas EPC Market Revenue (Million), by Country 2024 & 2032
- Figure 27: South America Oil and Gas EPC Market Revenue Share (%), by Country 2024 & 2032
- Figure 28: Middle East and Africa Oil and Gas EPC Market Revenue (Million), by Sector 2024 & 2032
- Figure 29: Middle East and Africa Oil and Gas EPC Market Revenue Share (%), by Sector 2024 & 2032
- Figure 30: Middle East and Africa Oil and Gas EPC Market Revenue (Million), by Country 2024 & 2032
- Figure 31: Middle East and Africa Oil and Gas EPC Market Revenue Share (%), by Country 2024 & 2032
List of Tables
- Table 1: Global Oil and Gas EPC Market Revenue Million Forecast, by Region 2019 & 2032
- Table 2: Global Oil and Gas EPC Market Revenue Million Forecast, by Sector 2019 & 2032
- Table 3: Global Oil and Gas EPC Market Revenue Million Forecast, by Region 2019 & 2032
- Table 4: Global Oil and Gas EPC Market Revenue Million Forecast, by Country 2019 & 2032
- Table 5: United States Oil and Gas EPC Market Revenue (Million) Forecast, by Application 2019 & 2032
- Table 6: Canada Oil and Gas EPC Market Revenue (Million) Forecast, by Application 2019 & 2032
- Table 7: Rest of North America Oil and Gas EPC Market Revenue (Million) Forecast, by Application 2019 & 2032
- Table 8: Global Oil and Gas EPC Market Revenue Million Forecast, by Country 2019 & 2032
- Table 9: Germany Oil and Gas EPC Market Revenue (Million) Forecast, by Application 2019 & 2032
- Table 10: France Oil and Gas EPC Market Revenue (Million) Forecast, by Application 2019 & 2032
- Table 11: United Kingdom Oil and Gas EPC Market Revenue (Million) Forecast, by Application 2019 & 2032
- Table 12: Rest of Europe Oil and Gas EPC Market Revenue (Million) Forecast, by Application 2019 & 2032
- Table 13: Global Oil and Gas EPC Market Revenue Million Forecast, by Country 2019 & 2032
- Table 14: China Oil and Gas EPC Market Revenue (Million) Forecast, by Application 2019 & 2032
- Table 15: India Oil and Gas EPC Market Revenue (Million) Forecast, by Application 2019 & 2032
- Table 16: Japan Oil and Gas EPC Market Revenue (Million) Forecast, by Application 2019 & 2032
- Table 17: South Korea Oil and Gas EPC Market Revenue (Million) Forecast, by Application 2019 & 2032
- Table 18: Rest of Asia Pacific Oil and Gas EPC Market Revenue (Million) Forecast, by Application 2019 & 2032
- Table 19: Global Oil and Gas EPC Market Revenue Million Forecast, by Country 2019 & 2032
- Table 20: Brazil Oil and Gas EPC Market Revenue (Million) Forecast, by Application 2019 & 2032
- Table 21: Argentina Oil and Gas EPC Market Revenue (Million) Forecast, by Application 2019 & 2032
- Table 22: Rest of South America Oil and Gas EPC Market Revenue (Million) Forecast, by Application 2019 & 2032
- Table 23: Global Oil and Gas EPC Market Revenue Million Forecast, by Country 2019 & 2032
- Table 24: Saudi Arabia Oil and Gas EPC Market Revenue (Million) Forecast, by Application 2019 & 2032
- Table 25: United Arab Emirates Oil and Gas EPC Market Revenue (Million) Forecast, by Application 2019 & 2032
- Table 26: South Africa Oil and Gas EPC Market Revenue (Million) Forecast, by Application 2019 & 2032
- Table 27: Rest of Middle East and Africa Oil and Gas EPC Market Revenue (Million) Forecast, by Application 2019 & 2032
- Table 28: Global Oil and Gas EPC Market Revenue Million Forecast, by Sector 2019 & 2032
- Table 29: Global Oil and Gas EPC Market Revenue Million Forecast, by Country 2019 & 2032
- Table 30: United States Oil and Gas EPC Market Revenue (Million) Forecast, by Application 2019 & 2032
- Table 31: Canada Oil and Gas EPC Market Revenue (Million) Forecast, by Application 2019 & 2032
- Table 32: Rest of North America Oil and Gas EPC Market Revenue (Million) Forecast, by Application 2019 & 2032
- Table 33: Global Oil and Gas EPC Market Revenue Million Forecast, by Sector 2019 & 2032
- Table 34: Global Oil and Gas EPC Market Revenue Million Forecast, by Country 2019 & 2032
- Table 35: Germany Oil and Gas EPC Market Revenue (Million) Forecast, by Application 2019 & 2032
- Table 36: France Oil and Gas EPC Market Revenue (Million) Forecast, by Application 2019 & 2032
- Table 37: United Kingdom Oil and Gas EPC Market Revenue (Million) Forecast, by Application 2019 & 2032
- Table 38: Rest of Europe Oil and Gas EPC Market Revenue (Million) Forecast, by Application 2019 & 2032
- Table 39: Global Oil and Gas EPC Market Revenue Million Forecast, by Sector 2019 & 2032
- Table 40: Global Oil and Gas EPC Market Revenue Million Forecast, by Country 2019 & 2032
- Table 41: China Oil and Gas EPC Market Revenue (Million) Forecast, by Application 2019 & 2032
- Table 42: India Oil and Gas EPC Market Revenue (Million) Forecast, by Application 2019 & 2032
- Table 43: Japan Oil and Gas EPC Market Revenue (Million) Forecast, by Application 2019 & 2032
- Table 44: South Korea Oil and Gas EPC Market Revenue (Million) Forecast, by Application 2019 & 2032
- Table 45: Rest of Asia Pacific Oil and Gas EPC Market Revenue (Million) Forecast, by Application 2019 & 2032
- Table 46: Global Oil and Gas EPC Market Revenue Million Forecast, by Sector 2019 & 2032
- Table 47: Global Oil and Gas EPC Market Revenue Million Forecast, by Country 2019 & 2032
- Table 48: Brazil Oil and Gas EPC Market Revenue (Million) Forecast, by Application 2019 & 2032
- Table 49: Argentina Oil and Gas EPC Market Revenue (Million) Forecast, by Application 2019 & 2032
- Table 50: Rest of South America Oil and Gas EPC Market Revenue (Million) Forecast, by Application 2019 & 2032
- Table 51: Global Oil and Gas EPC Market Revenue Million Forecast, by Sector 2019 & 2032
- Table 52: Global Oil and Gas EPC Market Revenue Million Forecast, by Country 2019 & 2032
- Table 53: Saudi Arabia Oil and Gas EPC Market Revenue (Million) Forecast, by Application 2019 & 2032
- Table 54: United Arab Emirates Oil and Gas EPC Market Revenue (Million) Forecast, by Application 2019 & 2032
- Table 55: South Africa Oil and Gas EPC Market Revenue (Million) Forecast, by Application 2019 & 2032
- Table 56: Rest of Middle East and Africa Oil and Gas EPC Market Revenue (Million) Forecast, by Application 2019 & 2032
Frequently Asked Questions
1. What is the projected Compound Annual Growth Rate (CAGR) of the Oil and Gas EPC Market?
The projected CAGR is approximately 4.76%.
2. Which companies are prominent players in the Oil and Gas EPC Market?
Key companies in the market include Sinopec Engineering (Group) Co Ltd, Bechtel Corporation, Samsung Engineering Co Ltd, Técnicas Reunidas SA, Daewoo Engineering & Construction Co Ltd, National Petroleum Construction Company, KBR Inc, Petrofac Limited, Hyundai Engineering & Construction Co Ltd, Saipem SpA, Korea Shipbuilding & Offshore Engineering Co Ltd, Fluor Corporation, John Wood Group PLC, TechnipFMC PLC, McDermott International Ltd.
3. What are the main segments of the Oil and Gas EPC Market?
The market segments include Sector.
4. Can you provide details about the market size?
The market size is estimated to be USD 456.91 Million as of 2022.
5. What are some drivers contributing to market growth?
4.; Growing Demand to Develop the Natural Gas Infrastructure4.; Increase in Offshore Oil and Gas Exploration and Production (E&P) Activities.
6. What are the notable trends driving market growth?
Upstream Segment Expected to Dominate the Market.
7. Are there any restraints impacting market growth?
4.; High Volatility of Oil and Gas Prices.
8. Can you provide examples of recent developments in the market?
May 2023, QatarEnergy announced the award of the engineering, procurement, and construction (EPC) contract for the North Field South (NFS) project, which comprises two LNG mega trains with a combined capacity of 16 million tons per annum (MTPA). NFS, jointly with the North Field East (NFE) project, will expand Qatar’s LNG production capacity from the current 77 MTPA to 126 MTPA. QatarEnergy maintains a 75% interest in the NFS project and has already signed partnership agreements with TotalEnergies, Shell, and ConocoPhillips for the remaining 25%.
9. What pricing options are available for accessing the report?
Pricing options include single-user, multi-user, and enterprise licenses priced at USD 4750, USD 5250, and USD 8750 respectively.
10. Is the market size provided in terms of value or volume?
The market size is provided in terms of value, measured in Million.
11. Are there any specific market keywords associated with the report?
Yes, the market keyword associated with the report is "Oil and Gas EPC Market," which aids in identifying and referencing the specific market segment covered.
12. How do I determine which pricing option suits my needs best?
The pricing options vary based on user requirements and access needs. Individual users may opt for single-user licenses, while businesses requiring broader access may choose multi-user or enterprise licenses for cost-effective access to the report.
13. Are there any additional resources or data provided in the Oil and Gas EPC Market report?
While the report offers comprehensive insights, it's advisable to review the specific contents or supplementary materials provided to ascertain if additional resources or data are available.
14. How can I stay updated on further developments or reports in the Oil and Gas EPC Market?
To stay informed about further developments, trends, and reports in the Oil and Gas EPC Market, consider subscribing to industry newsletters, following relevant companies and organizations, or regularly checking reputable industry news sources and publications.
Methodology
Step 1 - Identification of Relevant Samples Size from Population Database


Step 2 - Approaches for Defining Global Market Size (Value, Volume* & Price*)

Note*: In applicable scenarios
Step 3 - Data Sources
Primary Research
- Web Analytics
- Survey Reports
- Research Institute
- Latest Research Reports
- Opinion Leaders
Secondary Research
- Annual Reports
- White Paper
- Latest Press Release
- Industry Association
- Paid Database
- Investor Presentations

Step 4 - Data Triangulation
Involves using different sources of information in order to increase the validity of a study
These sources are likely to be stakeholders in a program - participants, other researchers, program staff, other community members, and so on.
Then we put all data in single framework & apply various statistical tools to find out the dynamic on the market.
During the analysis stage, feedback from the stakeholder groups would be compared to determine areas of agreement as well as areas of divergence


