
Key Insights
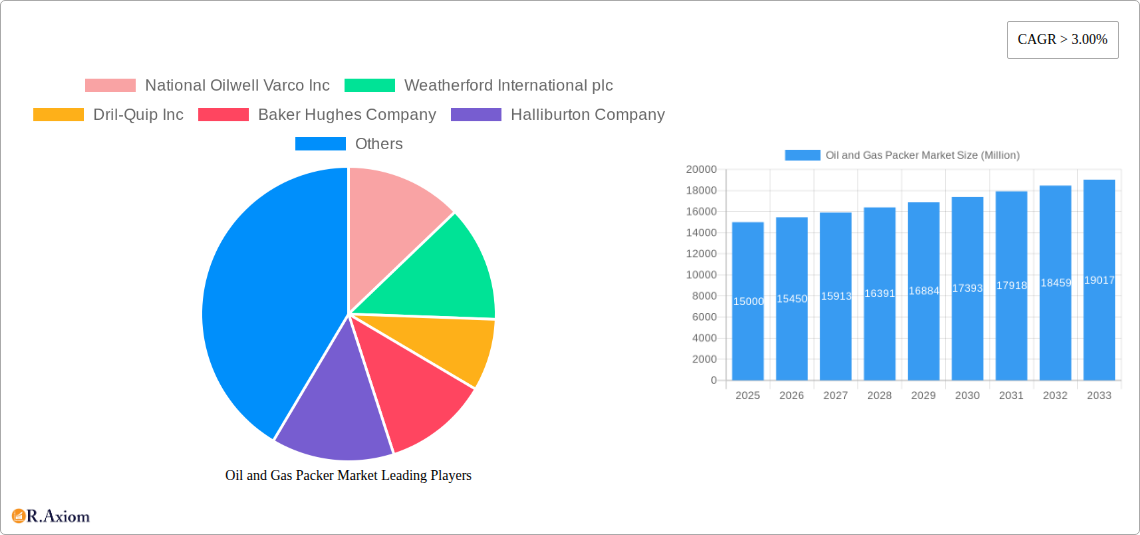
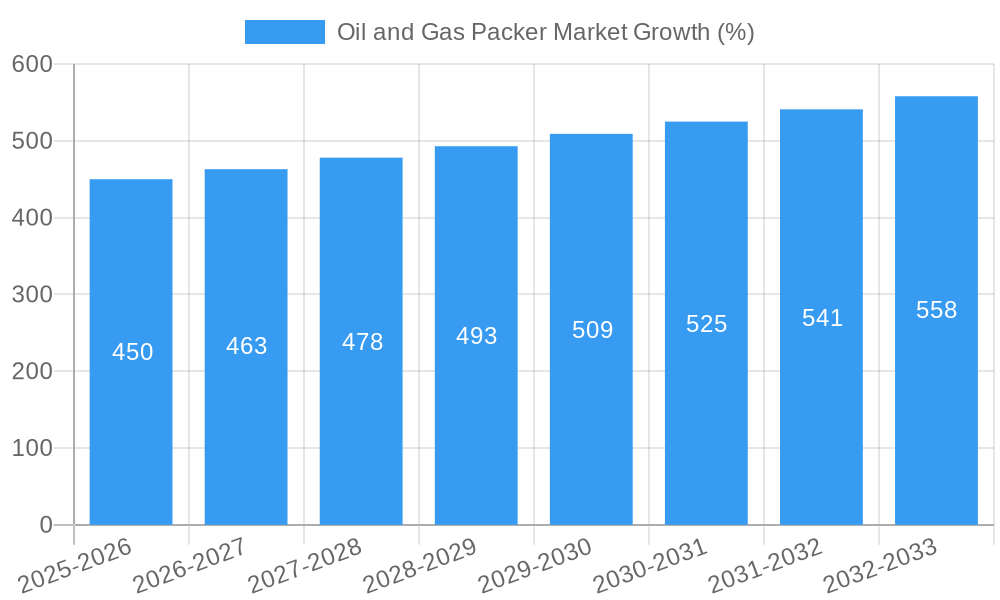
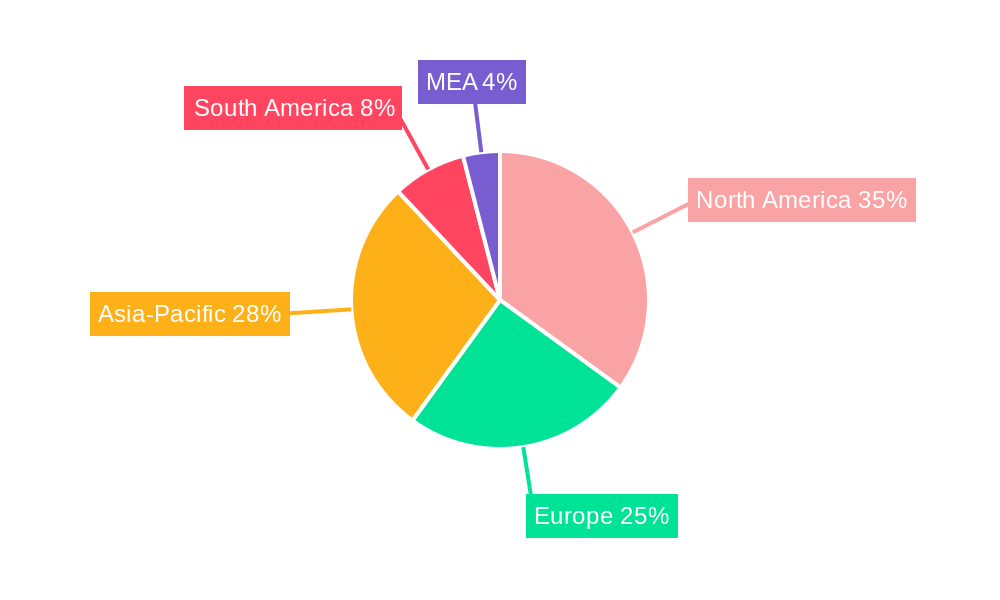
The global oil and gas packer market is experiencing robust growth, driven by increasing oil and gas exploration and production activities worldwide. A CAGR exceeding 3.00% indicates a consistently expanding market, projected to reach significant value by 2033. Several factors contribute to this growth, including the rising demand for energy, ongoing investments in deepwater and unconventional drilling, and the need for efficient well completion and production optimization. The market is segmented by packer type (retrievable and non-retrievable), location of deployment (onshore and offshore), and geography (North America, Europe, Asia-Pacific, South America, and the Middle East and Africa). North America, fueled by shale gas production in the United States and Canada, currently holds a significant market share. However, the Asia-Pacific region is projected to experience the fastest growth due to substantial infrastructure development and increasing energy consumption in countries like China and India. Competition among major players such as National Oilwell Varco, Weatherford International, Dril-Quip, Baker Hughes, Halliburton, and Schlumberger drives innovation and the development of advanced packer technologies. Despite the growth potential, the market faces certain restraints, including fluctuating oil prices, environmental regulations concerning well integrity, and the cyclical nature of the oil and gas industry. However, technological advancements in materials and design, along with the increasing focus on enhanced oil recovery techniques, are likely to mitigate these challenges and propel continued market expansion.
The retrievable packer segment currently dominates the market due to its flexibility and reusability, offering cost savings compared to non-retrievable packers. Offshore deployments, while representing a smaller segment, present lucrative opportunities given the higher complexity and cost associated with offshore drilling operations. This segment is expected to witness faster growth in the forecast period driven by the exploration of deepwater and ultra-deepwater oil and gas reserves. Furthermore, the ongoing transition towards sustainable energy sources may impact the long-term outlook, yet the market remains significant in the medium term due to the enduring demand for fossil fuels. Detailed regional analysis, considering specific energy policies, investment landscapes, and regulatory frameworks within each geographic segment, is essential for accurate market forecasting and strategic planning.
Oil and Gas Packer Market: A Comprehensive Report (2019-2033)
This comprehensive report provides an in-depth analysis of the global oil and gas packer market, offering invaluable insights for industry stakeholders, investors, and strategic decision-makers. The study covers the period 2019-2033, with 2025 as the base and estimated year, and a forecast period of 2025-2033. The report meticulously examines market dynamics, segmentation, competitive landscape, and future growth prospects, incorporating rigorous data analysis and expert insights. Key players analyzed include National Oilwell Varco Inc, Weatherford International plc, Dril-Quip Inc, Baker Hughes Company, Halliburton Company, Wellcare oil tools pvt ltd, and Schlumberger Limited.
Oil and Gas Packer Market Concentration & Innovation
This section analyzes the market concentration, innovation drivers, regulatory frameworks, product substitutes, end-user trends, and mergers & acquisitions (M&A) activities within the oil and gas packer market. The market is characterized by a moderately concentrated structure, with the top five players holding an estimated xx% market share in 2025. Innovation is driven by the need for improved well integrity, enhanced operational efficiency, and reduced environmental impact. Stringent regulatory frameworks concerning safety and environmental protection significantly influence market dynamics. The emergence of advanced materials and technologies, such as smart packers and automated deployment systems, is reshaping the competitive landscape. M&A activity has been relatively moderate in recent years, with deal values totaling approximately xx Million in the historical period (2019-2024).
- Market Share: Top 5 players hold an estimated xx% market share (2025).
- M&A Activity: Total deal value (2019-2024): xx Million.
- Innovation Drivers: Improved well integrity, efficiency gains, environmental regulations.
- Regulatory Factors: Stringent safety and environmental regulations.
Oil and Gas Packer Market Industry Trends & Insights
The oil and gas packer market is witnessing robust growth, driven by factors such as increasing global energy demand, exploration and production activities in unconventional reservoirs, and advancements in drilling technologies. The market is projected to expand at a Compound Annual Growth Rate (CAGR) of xx% during the forecast period (2025-2033). Technological disruptions, such as the adoption of smart packers and automation, are increasing efficiency and reducing operational costs. Consumer preference is shifting towards packers with advanced functionalities, enhanced durability, and improved environmental performance. Competitive dynamics are intensifying, with companies focusing on innovation, strategic partnerships, and geographical expansion to gain market share. Market penetration of advanced packer technologies is expected to reach xx% by 2033.
Dominant Markets & Segments in Oil and Gas Packer Market
The North America region currently holds the largest market share, driven by extensive oil and gas production activities and robust infrastructure. However, the Asia-Pacific region is projected to exhibit the highest growth rate during the forecast period, fueled by rising energy demand and substantial investments in upstream projects.
Leading Segments:
- Type: Retrievable packers dominate the market due to their flexibility and ease of maintenance.
- Location of Deployment: Onshore segment currently holds a larger market share due to the higher concentration of oil and gas wells. However, the offshore segment is expected to show significant growth in the coming years.
- Geography: North America holds the largest market share (2025), while Asia-Pacific is projected to have the highest growth rate (2025-2033).
Key Drivers:
- North America: Established oil and gas infrastructure, high production levels, favorable regulatory environment.
- Asia-Pacific: Rising energy demand, substantial investments in exploration and production, government support for energy infrastructure development.
Oil and Gas Packer Market Product Developments
Recent innovations in oil and gas packers include the development of smart packers equipped with sensors and data analytics capabilities for real-time monitoring and optimized well management. These advancements improve well integrity, reduce operational risks, and enhance efficiency. Furthermore, the integration of advanced materials and improved sealing technologies enhances the durability and longevity of packers. These innovative product developments are catering to the increasing demand for high-performance and environmentally friendly solutions within the industry.
Report Scope & Segmentation Analysis
This report segments the oil and gas packer market by type (retrievable and non-retrievable), location of deployment (onshore and offshore), and geography (North America, Europe, Asia-Pacific, South America, Middle East, and Africa). Each segment is analyzed in detail, providing market size, growth projections, and competitive dynamics. Retrievable packers are projected to witness faster growth due to their adaptability. The onshore segment is currently dominant but offshore is exhibiting higher growth potential. Each geographical region showcases unique dynamics based on exploration activity, regulatory landscape, and market maturity.
Key Drivers of Oil and Gas Packer Market Growth
The growth of the oil and gas packer market is propelled by several factors, including rising global energy demand, increased exploration and production activities in unconventional reservoirs, technological advancements in packer design and materials, and stringent regulations emphasizing well integrity and environmental protection. Furthermore, the growing adoption of automation and digitalization in oil and gas operations is also contributing to market expansion.
Challenges in the Oil and Gas Packer Market Sector
The oil and gas packer market faces challenges such as fluctuating oil and gas prices, stringent environmental regulations leading to increased compliance costs, and intense competition among various manufacturers. Supply chain disruptions and the need for specialized skills in installation and maintenance also pose significant obstacles to market growth. These factors can impact profitability and necessitate strategic adaptations.
Emerging Opportunities in Oil and Gas Packer Market
The oil and gas packer market presents significant opportunities in emerging markets characterized by high energy demand, and advancements in unconventional resource development. The development and adoption of environmentally friendly materials and technologies, along with the increasing use of data analytics and digitalization to improve operational efficiency, will further drive growth.
Leading Players in the Oil and Gas Packer Market Market
- National Oilwell Varco Inc
- Weatherford International plc
- Dril-Quip Inc
- Baker Hughes Company
- Halliburton Company
- Wellcare oil tools pvt ltd
- Schlumberger Limited
Key Developments in Oil and Gas Packer Market Industry
- January 2023: Baker Hughes launches a new generation of smart packers with enhanced sensor capabilities.
- March 2022: Halliburton acquires a smaller packer manufacturer, expanding its product portfolio.
- June 2021: National Oilwell Varco announces a strategic partnership to develop advanced materials for packer seals.
Strategic Outlook for Oil and Gas Packer Market Market
The oil and gas packer market is poised for continued growth, driven by increasing energy demand and advancements in technology. Companies are focusing on innovation, diversification, and strategic partnerships to capture market share. The focus on sustainability and environmental considerations will further shape market dynamics, favoring companies that can offer eco-friendly solutions. The market is expected to remain competitive, with ongoing product development and technological advancements driving innovation and growth.
Oil and Gas Packer Market Segmentation
-
1. Type
- 1.1. Retrievable
- 1.2. Non-Retrievable
-
2. Location of Deployment
- 2.1. Offshore
- 2.2. Onshore
-
3. Geogrpahy
- 3.1. North America
- 3.2. Europe
- 3.3. Asia-Pacific
- 3.4. South America
- 3.5. Middle-East and Africa
Oil and Gas Packer Market Segmentation By Geography
-
1. North America
- 1.1. United States
- 1.2. Canada
- 1.3. Mexico
-
2. South America
- 2.1. Brazil
- 2.2. Argentina
- 2.3. Rest of South America
-
3. Europe
- 3.1. United Kingdom
- 3.2. Germany
- 3.3. France
- 3.4. Italy
- 3.5. Spain
- 3.6. Russia
- 3.7. Benelux
- 3.8. Nordics
- 3.9. Rest of Europe
-
4. Middle East & Africa
- 4.1. Turkey
- 4.2. Israel
- 4.3. GCC
- 4.4. North Africa
- 4.5. South Africa
- 4.6. Rest of Middle East & Africa
-
5. Asia Pacific
- 5.1. China
- 5.2. India
- 5.3. Japan
- 5.4. South Korea
- 5.5. ASEAN
- 5.6. Oceania
- 5.7. Rest of Asia Pacific
Oil and Gas Packer Market REPORT HIGHLIGHTS
| Aspects | Details |
|---|---|
| Study Period | 2019-2033 |
| Base Year | 2024 |
| Estimated Year | 2025 |
| Forecast Period | 2025-2033 |
| Historical Period | 2019-2024 |
| Growth Rate | CAGR of > 3.00% from 2019-2033 |
| Segmentation |
|
Table of Contents
- 1. Introduction
- 1.1. Research Scope
- 1.2. Market Segmentation
- 1.3. Research Methodology
- 1.4. Definitions and Assumptions
- 2. Executive Summary
- 2.1. Introduction
- 3. Market Dynamics
- 3.1. Introduction
- 3.2. Market Drivers
- 3.2.1. Increasing Production from Unconventional Sources4.; Growing Energy Demand in the Region
- 3.3. Market Restrains
- 3.3.1. Environmental Concerns
- 3.4. Market Trends
- 3.4.1. Retrievable Packer to Witness Significant Growth
- 4. Market Factor Analysis
- 4.1. Porters Five Forces
- 4.2. Supply/Value Chain
- 4.3. PESTEL analysis
- 4.4. Market Entropy
- 4.5. Patent/Trademark Analysis
- 5. Global Oil and Gas Packer Market Analysis, Insights and Forecast, 2019-2031
- 5.1. Market Analysis, Insights and Forecast - by Type
- 5.1.1. Retrievable
- 5.1.2. Non-Retrievable
- 5.2. Market Analysis, Insights and Forecast - by Location of Deployment
- 5.2.1. Offshore
- 5.2.2. Onshore
- 5.3. Market Analysis, Insights and Forecast - by Geogrpahy
- 5.3.1. North America
- 5.3.2. Europe
- 5.3.3. Asia-Pacific
- 5.3.4. South America
- 5.3.5. Middle-East and Africa
- 5.4. Market Analysis, Insights and Forecast - by Region
- 5.4.1. North America
- 5.4.2. South America
- 5.4.3. Europe
- 5.4.4. Middle East & Africa
- 5.4.5. Asia Pacific
- 5.1. Market Analysis, Insights and Forecast - by Type
- 6. North America Oil and Gas Packer Market Analysis, Insights and Forecast, 2019-2031
- 6.1. Market Analysis, Insights and Forecast - by Type
- 6.1.1. Retrievable
- 6.1.2. Non-Retrievable
- 6.2. Market Analysis, Insights and Forecast - by Location of Deployment
- 6.2.1. Offshore
- 6.2.2. Onshore
- 6.3. Market Analysis, Insights and Forecast - by Geogrpahy
- 6.3.1. North America
- 6.3.2. Europe
- 6.3.3. Asia-Pacific
- 6.3.4. South America
- 6.3.5. Middle-East and Africa
- 6.1. Market Analysis, Insights and Forecast - by Type
- 7. South America Oil and Gas Packer Market Analysis, Insights and Forecast, 2019-2031
- 7.1. Market Analysis, Insights and Forecast - by Type
- 7.1.1. Retrievable
- 7.1.2. Non-Retrievable
- 7.2. Market Analysis, Insights and Forecast - by Location of Deployment
- 7.2.1. Offshore
- 7.2.2. Onshore
- 7.3. Market Analysis, Insights and Forecast - by Geogrpahy
- 7.3.1. North America
- 7.3.2. Europe
- 7.3.3. Asia-Pacific
- 7.3.4. South America
- 7.3.5. Middle-East and Africa
- 7.1. Market Analysis, Insights and Forecast - by Type
- 8. Europe Oil and Gas Packer Market Analysis, Insights and Forecast, 2019-2031
- 8.1. Market Analysis, Insights and Forecast - by Type
- 8.1.1. Retrievable
- 8.1.2. Non-Retrievable
- 8.2. Market Analysis, Insights and Forecast - by Location of Deployment
- 8.2.1. Offshore
- 8.2.2. Onshore
- 8.3. Market Analysis, Insights and Forecast - by Geogrpahy
- 8.3.1. North America
- 8.3.2. Europe
- 8.3.3. Asia-Pacific
- 8.3.4. South America
- 8.3.5. Middle-East and Africa
- 8.1. Market Analysis, Insights and Forecast - by Type
- 9. Middle East & Africa Oil and Gas Packer Market Analysis, Insights and Forecast, 2019-2031
- 9.1. Market Analysis, Insights and Forecast - by Type
- 9.1.1. Retrievable
- 9.1.2. Non-Retrievable
- 9.2. Market Analysis, Insights and Forecast - by Location of Deployment
- 9.2.1. Offshore
- 9.2.2. Onshore
- 9.3. Market Analysis, Insights and Forecast - by Geogrpahy
- 9.3.1. North America
- 9.3.2. Europe
- 9.3.3. Asia-Pacific
- 9.3.4. South America
- 9.3.5. Middle-East and Africa
- 9.1. Market Analysis, Insights and Forecast - by Type
- 10. Asia Pacific Oil and Gas Packer Market Analysis, Insights and Forecast, 2019-2031
- 10.1. Market Analysis, Insights and Forecast - by Type
- 10.1.1. Retrievable
- 10.1.2. Non-Retrievable
- 10.2. Market Analysis, Insights and Forecast - by Location of Deployment
- 10.2.1. Offshore
- 10.2.2. Onshore
- 10.3. Market Analysis, Insights and Forecast - by Geogrpahy
- 10.3.1. North America
- 10.3.2. Europe
- 10.3.3. Asia-Pacific
- 10.3.4. South America
- 10.3.5. Middle-East and Africa
- 10.1. Market Analysis, Insights and Forecast - by Type
- 11. North America Oil and Gas Packer Market Analysis, Insights and Forecast, 2019-2031
- 11.1. Market Analysis, Insights and Forecast - By Country/Sub-region
- 11.1.1 United States
- 11.1.2 Canada
- 11.1.3 Mexico
- 12. Europe Oil and Gas Packer Market Analysis, Insights and Forecast, 2019-2031
- 12.1. Market Analysis, Insights and Forecast - By Country/Sub-region
- 12.1.1 Germany
- 12.1.2 United Kingdom
- 12.1.3 France
- 12.1.4 Spain
- 12.1.5 Italy
- 12.1.6 Spain
- 12.1.7 Belgium
- 12.1.8 Netherland
- 12.1.9 Nordics
- 12.1.10 Rest of Europe
- 13. Asia Pacific Oil and Gas Packer Market Analysis, Insights and Forecast, 2019-2031
- 13.1. Market Analysis, Insights and Forecast - By Country/Sub-region
- 13.1.1 China
- 13.1.2 Japan
- 13.1.3 India
- 13.1.4 South Korea
- 13.1.5 Southeast Asia
- 13.1.6 Australia
- 13.1.7 Indonesia
- 13.1.8 Phillipes
- 13.1.9 Singapore
- 13.1.10 Thailandc
- 13.1.11 Rest of Asia Pacific
- 14. South America Oil and Gas Packer Market Analysis, Insights and Forecast, 2019-2031
- 14.1. Market Analysis, Insights and Forecast - By Country/Sub-region
- 14.1.1 Brazil
- 14.1.2 Argentina
- 14.1.3 Peru
- 14.1.4 Chile
- 14.1.5 Colombia
- 14.1.6 Ecuador
- 14.1.7 Venezuela
- 14.1.8 Rest of South America
- 15. MEA Oil and Gas Packer Market Analysis, Insights and Forecast, 2019-2031
- 15.1. Market Analysis, Insights and Forecast - By Country/Sub-region
- 15.1.1 United Arab Emirates
- 15.1.2 Saudi Arabia
- 15.1.3 South Africa
- 15.1.4 Rest of Middle East and Africa
- 16. Competitive Analysis
- 16.1. Global Market Share Analysis 2024
- 16.2. Company Profiles
- 16.2.1 National Oilwell Varco Inc
- 16.2.1.1. Overview
- 16.2.1.2. Products
- 16.2.1.3. SWOT Analysis
- 16.2.1.4. Recent Developments
- 16.2.1.5. Financials (Based on Availability)
- 16.2.2 Weatherford International plc
- 16.2.2.1. Overview
- 16.2.2.2. Products
- 16.2.2.3. SWOT Analysis
- 16.2.2.4. Recent Developments
- 16.2.2.5. Financials (Based on Availability)
- 16.2.3 Dril-Quip Inc
- 16.2.3.1. Overview
- 16.2.3.2. Products
- 16.2.3.3. SWOT Analysis
- 16.2.3.4. Recent Developments
- 16.2.3.5. Financials (Based on Availability)
- 16.2.4 Baker Hughes Company
- 16.2.4.1. Overview
- 16.2.4.2. Products
- 16.2.4.3. SWOT Analysis
- 16.2.4.4. Recent Developments
- 16.2.4.5. Financials (Based on Availability)
- 16.2.5 Halliburton Company
- 16.2.5.1. Overview
- 16.2.5.2. Products
- 16.2.5.3. SWOT Analysis
- 16.2.5.4. Recent Developments
- 16.2.5.5. Financials (Based on Availability)
- 16.2.6 Wellcare oil tools pvt ltd
- 16.2.6.1. Overview
- 16.2.6.2. Products
- 16.2.6.3. SWOT Analysis
- 16.2.6.4. Recent Developments
- 16.2.6.5. Financials (Based on Availability)
- 16.2.7 Schlumberger Limited
- 16.2.7.1. Overview
- 16.2.7.2. Products
- 16.2.7.3. SWOT Analysis
- 16.2.7.4. Recent Developments
- 16.2.7.5. Financials (Based on Availability)
- 16.2.1 National Oilwell Varco Inc
List of Figures
- Figure 1: Global Oil and Gas Packer Market Revenue Breakdown (Million, %) by Region 2024 & 2032
- Figure 2: Global Oil and Gas Packer Market Volume Breakdown (K Unit, %) by Region 2024 & 2032
- Figure 3: North America Oil and Gas Packer Market Revenue (Million), by Country 2024 & 2032
- Figure 4: North America Oil and Gas Packer Market Volume (K Unit), by Country 2024 & 2032
- Figure 5: North America Oil and Gas Packer Market Revenue Share (%), by Country 2024 & 2032
- Figure 6: North America Oil and Gas Packer Market Volume Share (%), by Country 2024 & 2032
- Figure 7: Europe Oil and Gas Packer Market Revenue (Million), by Country 2024 & 2032
- Figure 8: Europe Oil and Gas Packer Market Volume (K Unit), by Country 2024 & 2032
- Figure 9: Europe Oil and Gas Packer Market Revenue Share (%), by Country 2024 & 2032
- Figure 10: Europe Oil and Gas Packer Market Volume Share (%), by Country 2024 & 2032
- Figure 11: Asia Pacific Oil and Gas Packer Market Revenue (Million), by Country 2024 & 2032
- Figure 12: Asia Pacific Oil and Gas Packer Market Volume (K Unit), by Country 2024 & 2032
- Figure 13: Asia Pacific Oil and Gas Packer Market Revenue Share (%), by Country 2024 & 2032
- Figure 14: Asia Pacific Oil and Gas Packer Market Volume Share (%), by Country 2024 & 2032
- Figure 15: South America Oil and Gas Packer Market Revenue (Million), by Country 2024 & 2032
- Figure 16: South America Oil and Gas Packer Market Volume (K Unit), by Country 2024 & 2032
- Figure 17: South America Oil and Gas Packer Market Revenue Share (%), by Country 2024 & 2032
- Figure 18: South America Oil and Gas Packer Market Volume Share (%), by Country 2024 & 2032
- Figure 19: MEA Oil and Gas Packer Market Revenue (Million), by Country 2024 & 2032
- Figure 20: MEA Oil and Gas Packer Market Volume (K Unit), by Country 2024 & 2032
- Figure 21: MEA Oil and Gas Packer Market Revenue Share (%), by Country 2024 & 2032
- Figure 22: MEA Oil and Gas Packer Market Volume Share (%), by Country 2024 & 2032
- Figure 23: North America Oil and Gas Packer Market Revenue (Million), by Type 2024 & 2032
- Figure 24: North America Oil and Gas Packer Market Volume (K Unit), by Type 2024 & 2032
- Figure 25: North America Oil and Gas Packer Market Revenue Share (%), by Type 2024 & 2032
- Figure 26: North America Oil and Gas Packer Market Volume Share (%), by Type 2024 & 2032
- Figure 27: North America Oil and Gas Packer Market Revenue (Million), by Location of Deployment 2024 & 2032
- Figure 28: North America Oil and Gas Packer Market Volume (K Unit), by Location of Deployment 2024 & 2032
- Figure 29: North America Oil and Gas Packer Market Revenue Share (%), by Location of Deployment 2024 & 2032
- Figure 30: North America Oil and Gas Packer Market Volume Share (%), by Location of Deployment 2024 & 2032
- Figure 31: North America Oil and Gas Packer Market Revenue (Million), by Geogrpahy 2024 & 2032
- Figure 32: North America Oil and Gas Packer Market Volume (K Unit), by Geogrpahy 2024 & 2032
- Figure 33: North America Oil and Gas Packer Market Revenue Share (%), by Geogrpahy 2024 & 2032
- Figure 34: North America Oil and Gas Packer Market Volume Share (%), by Geogrpahy 2024 & 2032
- Figure 35: North America Oil and Gas Packer Market Revenue (Million), by Country 2024 & 2032
- Figure 36: North America Oil and Gas Packer Market Volume (K Unit), by Country 2024 & 2032
- Figure 37: North America Oil and Gas Packer Market Revenue Share (%), by Country 2024 & 2032
- Figure 38: North America Oil and Gas Packer Market Volume Share (%), by Country 2024 & 2032
- Figure 39: South America Oil and Gas Packer Market Revenue (Million), by Type 2024 & 2032
- Figure 40: South America Oil and Gas Packer Market Volume (K Unit), by Type 2024 & 2032
- Figure 41: South America Oil and Gas Packer Market Revenue Share (%), by Type 2024 & 2032
- Figure 42: South America Oil and Gas Packer Market Volume Share (%), by Type 2024 & 2032
- Figure 43: South America Oil and Gas Packer Market Revenue (Million), by Location of Deployment 2024 & 2032
- Figure 44: South America Oil and Gas Packer Market Volume (K Unit), by Location of Deployment 2024 & 2032
- Figure 45: South America Oil and Gas Packer Market Revenue Share (%), by Location of Deployment 2024 & 2032
- Figure 46: South America Oil and Gas Packer Market Volume Share (%), by Location of Deployment 2024 & 2032
- Figure 47: South America Oil and Gas Packer Market Revenue (Million), by Geogrpahy 2024 & 2032
- Figure 48: South America Oil and Gas Packer Market Volume (K Unit), by Geogrpahy 2024 & 2032
- Figure 49: South America Oil and Gas Packer Market Revenue Share (%), by Geogrpahy 2024 & 2032
- Figure 50: South America Oil and Gas Packer Market Volume Share (%), by Geogrpahy 2024 & 2032
- Figure 51: South America Oil and Gas Packer Market Revenue (Million), by Country 2024 & 2032
- Figure 52: South America Oil and Gas Packer Market Volume (K Unit), by Country 2024 & 2032
- Figure 53: South America Oil and Gas Packer Market Revenue Share (%), by Country 2024 & 2032
- Figure 54: South America Oil and Gas Packer Market Volume Share (%), by Country 2024 & 2032
- Figure 55: Europe Oil and Gas Packer Market Revenue (Million), by Type 2024 & 2032
- Figure 56: Europe Oil and Gas Packer Market Volume (K Unit), by Type 2024 & 2032
- Figure 57: Europe Oil and Gas Packer Market Revenue Share (%), by Type 2024 & 2032
- Figure 58: Europe Oil and Gas Packer Market Volume Share (%), by Type 2024 & 2032
- Figure 59: Europe Oil and Gas Packer Market Revenue (Million), by Location of Deployment 2024 & 2032
- Figure 60: Europe Oil and Gas Packer Market Volume (K Unit), by Location of Deployment 2024 & 2032
- Figure 61: Europe Oil and Gas Packer Market Revenue Share (%), by Location of Deployment 2024 & 2032
- Figure 62: Europe Oil and Gas Packer Market Volume Share (%), by Location of Deployment 2024 & 2032
- Figure 63: Europe Oil and Gas Packer Market Revenue (Million), by Geogrpahy 2024 & 2032
- Figure 64: Europe Oil and Gas Packer Market Volume (K Unit), by Geogrpahy 2024 & 2032
- Figure 65: Europe Oil and Gas Packer Market Revenue Share (%), by Geogrpahy 2024 & 2032
- Figure 66: Europe Oil and Gas Packer Market Volume Share (%), by Geogrpahy 2024 & 2032
- Figure 67: Europe Oil and Gas Packer Market Revenue (Million), by Country 2024 & 2032
- Figure 68: Europe Oil and Gas Packer Market Volume (K Unit), by Country 2024 & 2032
- Figure 69: Europe Oil and Gas Packer Market Revenue Share (%), by Country 2024 & 2032
- Figure 70: Europe Oil and Gas Packer Market Volume Share (%), by Country 2024 & 2032
- Figure 71: Middle East & Africa Oil and Gas Packer Market Revenue (Million), by Type 2024 & 2032
- Figure 72: Middle East & Africa Oil and Gas Packer Market Volume (K Unit), by Type 2024 & 2032
- Figure 73: Middle East & Africa Oil and Gas Packer Market Revenue Share (%), by Type 2024 & 2032
- Figure 74: Middle East & Africa Oil and Gas Packer Market Volume Share (%), by Type 2024 & 2032
- Figure 75: Middle East & Africa Oil and Gas Packer Market Revenue (Million), by Location of Deployment 2024 & 2032
- Figure 76: Middle East & Africa Oil and Gas Packer Market Volume (K Unit), by Location of Deployment 2024 & 2032
- Figure 77: Middle East & Africa Oil and Gas Packer Market Revenue Share (%), by Location of Deployment 2024 & 2032
- Figure 78: Middle East & Africa Oil and Gas Packer Market Volume Share (%), by Location of Deployment 2024 & 2032
- Figure 79: Middle East & Africa Oil and Gas Packer Market Revenue (Million), by Geogrpahy 2024 & 2032
- Figure 80: Middle East & Africa Oil and Gas Packer Market Volume (K Unit), by Geogrpahy 2024 & 2032
- Figure 81: Middle East & Africa Oil and Gas Packer Market Revenue Share (%), by Geogrpahy 2024 & 2032
- Figure 82: Middle East & Africa Oil and Gas Packer Market Volume Share (%), by Geogrpahy 2024 & 2032
- Figure 83: Middle East & Africa Oil and Gas Packer Market Revenue (Million), by Country 2024 & 2032
- Figure 84: Middle East & Africa Oil and Gas Packer Market Volume (K Unit), by Country 2024 & 2032
- Figure 85: Middle East & Africa Oil and Gas Packer Market Revenue Share (%), by Country 2024 & 2032
- Figure 86: Middle East & Africa Oil and Gas Packer Market Volume Share (%), by Country 2024 & 2032
- Figure 87: Asia Pacific Oil and Gas Packer Market Revenue (Million), by Type 2024 & 2032
- Figure 88: Asia Pacific Oil and Gas Packer Market Volume (K Unit), by Type 2024 & 2032
- Figure 89: Asia Pacific Oil and Gas Packer Market Revenue Share (%), by Type 2024 & 2032
- Figure 90: Asia Pacific Oil and Gas Packer Market Volume Share (%), by Type 2024 & 2032
- Figure 91: Asia Pacific Oil and Gas Packer Market Revenue (Million), by Location of Deployment 2024 & 2032
- Figure 92: Asia Pacific Oil and Gas Packer Market Volume (K Unit), by Location of Deployment 2024 & 2032
- Figure 93: Asia Pacific Oil and Gas Packer Market Revenue Share (%), by Location of Deployment 2024 & 2032
- Figure 94: Asia Pacific Oil and Gas Packer Market Volume Share (%), by Location of Deployment 2024 & 2032
- Figure 95: Asia Pacific Oil and Gas Packer Market Revenue (Million), by Geogrpahy 2024 & 2032
- Figure 96: Asia Pacific Oil and Gas Packer Market Volume (K Unit), by Geogrpahy 2024 & 2032
- Figure 97: Asia Pacific Oil and Gas Packer Market Revenue Share (%), by Geogrpahy 2024 & 2032
- Figure 98: Asia Pacific Oil and Gas Packer Market Volume Share (%), by Geogrpahy 2024 & 2032
- Figure 99: Asia Pacific Oil and Gas Packer Market Revenue (Million), by Country 2024 & 2032
- Figure 100: Asia Pacific Oil and Gas Packer Market Volume (K Unit), by Country 2024 & 2032
- Figure 101: Asia Pacific Oil and Gas Packer Market Revenue Share (%), by Country 2024 & 2032
- Figure 102: Asia Pacific Oil and Gas Packer Market Volume Share (%), by Country 2024 & 2032
List of Tables
- Table 1: Global Oil and Gas Packer Market Revenue Million Forecast, by Region 2019 & 2032
- Table 2: Global Oil and Gas Packer Market Volume K Unit Forecast, by Region 2019 & 2032
- Table 3: Global Oil and Gas Packer Market Revenue Million Forecast, by Type 2019 & 2032
- Table 4: Global Oil and Gas Packer Market Volume K Unit Forecast, by Type 2019 & 2032
- Table 5: Global Oil and Gas Packer Market Revenue Million Forecast, by Location of Deployment 2019 & 2032
- Table 6: Global Oil and Gas Packer Market Volume K Unit Forecast, by Location of Deployment 2019 & 2032
- Table 7: Global Oil and Gas Packer Market Revenue Million Forecast, by Geogrpahy 2019 & 2032
- Table 8: Global Oil and Gas Packer Market Volume K Unit Forecast, by Geogrpahy 2019 & 2032
- Table 9: Global Oil and Gas Packer Market Revenue Million Forecast, by Region 2019 & 2032
- Table 10: Global Oil and Gas Packer Market Volume K Unit Forecast, by Region 2019 & 2032
- Table 11: Global Oil and Gas Packer Market Revenue Million Forecast, by Country 2019 & 2032
- Table 12: Global Oil and Gas Packer Market Volume K Unit Forecast, by Country 2019 & 2032
- Table 13: United States Oil and Gas Packer Market Revenue (Million) Forecast, by Application 2019 & 2032
- Table 14: United States Oil and Gas Packer Market Volume (K Unit) Forecast, by Application 2019 & 2032
- Table 15: Canada Oil and Gas Packer Market Revenue (Million) Forecast, by Application 2019 & 2032
- Table 16: Canada Oil and Gas Packer Market Volume (K Unit) Forecast, by Application 2019 & 2032
- Table 17: Mexico Oil and Gas Packer Market Revenue (Million) Forecast, by Application 2019 & 2032
- Table 18: Mexico Oil and Gas Packer Market Volume (K Unit) Forecast, by Application 2019 & 2032
- Table 19: Global Oil and Gas Packer Market Revenue Million Forecast, by Country 2019 & 2032
- Table 20: Global Oil and Gas Packer Market Volume K Unit Forecast, by Country 2019 & 2032
- Table 21: Germany Oil and Gas Packer Market Revenue (Million) Forecast, by Application 2019 & 2032
- Table 22: Germany Oil and Gas Packer Market Volume (K Unit) Forecast, by Application 2019 & 2032
- Table 23: United Kingdom Oil and Gas Packer Market Revenue (Million) Forecast, by Application 2019 & 2032
- Table 24: United Kingdom Oil and Gas Packer Market Volume (K Unit) Forecast, by Application 2019 & 2032
- Table 25: France Oil and Gas Packer Market Revenue (Million) Forecast, by Application 2019 & 2032
- Table 26: France Oil and Gas Packer Market Volume (K Unit) Forecast, by Application 2019 & 2032
- Table 27: Spain Oil and Gas Packer Market Revenue (Million) Forecast, by Application 2019 & 2032
- Table 28: Spain Oil and Gas Packer Market Volume (K Unit) Forecast, by Application 2019 & 2032
- Table 29: Italy Oil and Gas Packer Market Revenue (Million) Forecast, by Application 2019 & 2032
- Table 30: Italy Oil and Gas Packer Market Volume (K Unit) Forecast, by Application 2019 & 2032
- Table 31: Spain Oil and Gas Packer Market Revenue (Million) Forecast, by Application 2019 & 2032
- Table 32: Spain Oil and Gas Packer Market Volume (K Unit) Forecast, by Application 2019 & 2032
- Table 33: Belgium Oil and Gas Packer Market Revenue (Million) Forecast, by Application 2019 & 2032
- Table 34: Belgium Oil and Gas Packer Market Volume (K Unit) Forecast, by Application 2019 & 2032
- Table 35: Netherland Oil and Gas Packer Market Revenue (Million) Forecast, by Application 2019 & 2032
- Table 36: Netherland Oil and Gas Packer Market Volume (K Unit) Forecast, by Application 2019 & 2032
- Table 37: Nordics Oil and Gas Packer Market Revenue (Million) Forecast, by Application 2019 & 2032
- Table 38: Nordics Oil and Gas Packer Market Volume (K Unit) Forecast, by Application 2019 & 2032
- Table 39: Rest of Europe Oil and Gas Packer Market Revenue (Million) Forecast, by Application 2019 & 2032
- Table 40: Rest of Europe Oil and Gas Packer Market Volume (K Unit) Forecast, by Application 2019 & 2032
- Table 41: Global Oil and Gas Packer Market Revenue Million Forecast, by Country 2019 & 2032
- Table 42: Global Oil and Gas Packer Market Volume K Unit Forecast, by Country 2019 & 2032
- Table 43: China Oil and Gas Packer Market Revenue (Million) Forecast, by Application 2019 & 2032
- Table 44: China Oil and Gas Packer Market Volume (K Unit) Forecast, by Application 2019 & 2032
- Table 45: Japan Oil and Gas Packer Market Revenue (Million) Forecast, by Application 2019 & 2032
- Table 46: Japan Oil and Gas Packer Market Volume (K Unit) Forecast, by Application 2019 & 2032
- Table 47: India Oil and Gas Packer Market Revenue (Million) Forecast, by Application 2019 & 2032
- Table 48: India Oil and Gas Packer Market Volume (K Unit) Forecast, by Application 2019 & 2032
- Table 49: South Korea Oil and Gas Packer Market Revenue (Million) Forecast, by Application 2019 & 2032
- Table 50: South Korea Oil and Gas Packer Market Volume (K Unit) Forecast, by Application 2019 & 2032
- Table 51: Southeast Asia Oil and Gas Packer Market Revenue (Million) Forecast, by Application 2019 & 2032
- Table 52: Southeast Asia Oil and Gas Packer Market Volume (K Unit) Forecast, by Application 2019 & 2032
- Table 53: Australia Oil and Gas Packer Market Revenue (Million) Forecast, by Application 2019 & 2032
- Table 54: Australia Oil and Gas Packer Market Volume (K Unit) Forecast, by Application 2019 & 2032
- Table 55: Indonesia Oil and Gas Packer Market Revenue (Million) Forecast, by Application 2019 & 2032
- Table 56: Indonesia Oil and Gas Packer Market Volume (K Unit) Forecast, by Application 2019 & 2032
- Table 57: Phillipes Oil and Gas Packer Market Revenue (Million) Forecast, by Application 2019 & 2032
- Table 58: Phillipes Oil and Gas Packer Market Volume (K Unit) Forecast, by Application 2019 & 2032
- Table 59: Singapore Oil and Gas Packer Market Revenue (Million) Forecast, by Application 2019 & 2032
- Table 60: Singapore Oil and Gas Packer Market Volume (K Unit) Forecast, by Application 2019 & 2032
- Table 61: Thailandc Oil and Gas Packer Market Revenue (Million) Forecast, by Application 2019 & 2032
- Table 62: Thailandc Oil and Gas Packer Market Volume (K Unit) Forecast, by Application 2019 & 2032
- Table 63: Rest of Asia Pacific Oil and Gas Packer Market Revenue (Million) Forecast, by Application 2019 & 2032
- Table 64: Rest of Asia Pacific Oil and Gas Packer Market Volume (K Unit) Forecast, by Application 2019 & 2032
- Table 65: Global Oil and Gas Packer Market Revenue Million Forecast, by Country 2019 & 2032
- Table 66: Global Oil and Gas Packer Market Volume K Unit Forecast, by Country 2019 & 2032
- Table 67: Brazil Oil and Gas Packer Market Revenue (Million) Forecast, by Application 2019 & 2032
- Table 68: Brazil Oil and Gas Packer Market Volume (K Unit) Forecast, by Application 2019 & 2032
- Table 69: Argentina Oil and Gas Packer Market Revenue (Million) Forecast, by Application 2019 & 2032
- Table 70: Argentina Oil and Gas Packer Market Volume (K Unit) Forecast, by Application 2019 & 2032
- Table 71: Peru Oil and Gas Packer Market Revenue (Million) Forecast, by Application 2019 & 2032
- Table 72: Peru Oil and Gas Packer Market Volume (K Unit) Forecast, by Application 2019 & 2032
- Table 73: Chile Oil and Gas Packer Market Revenue (Million) Forecast, by Application 2019 & 2032
- Table 74: Chile Oil and Gas Packer Market Volume (K Unit) Forecast, by Application 2019 & 2032
- Table 75: Colombia Oil and Gas Packer Market Revenue (Million) Forecast, by Application 2019 & 2032
- Table 76: Colombia Oil and Gas Packer Market Volume (K Unit) Forecast, by Application 2019 & 2032
- Table 77: Ecuador Oil and Gas Packer Market Revenue (Million) Forecast, by Application 2019 & 2032
- Table 78: Ecuador Oil and Gas Packer Market Volume (K Unit) Forecast, by Application 2019 & 2032
- Table 79: Venezuela Oil and Gas Packer Market Revenue (Million) Forecast, by Application 2019 & 2032
- Table 80: Venezuela Oil and Gas Packer Market Volume (K Unit) Forecast, by Application 2019 & 2032
- Table 81: Rest of South America Oil and Gas Packer Market Revenue (Million) Forecast, by Application 2019 & 2032
- Table 82: Rest of South America Oil and Gas Packer Market Volume (K Unit) Forecast, by Application 2019 & 2032
- Table 83: Global Oil and Gas Packer Market Revenue Million Forecast, by Country 2019 & 2032
- Table 84: Global Oil and Gas Packer Market Volume K Unit Forecast, by Country 2019 & 2032
- Table 85: United Arab Emirates Oil and Gas Packer Market Revenue (Million) Forecast, by Application 2019 & 2032
- Table 86: United Arab Emirates Oil and Gas Packer Market Volume (K Unit) Forecast, by Application 2019 & 2032
- Table 87: Saudi Arabia Oil and Gas Packer Market Revenue (Million) Forecast, by Application 2019 & 2032
- Table 88: Saudi Arabia Oil and Gas Packer Market Volume (K Unit) Forecast, by Application 2019 & 2032
- Table 89: South Africa Oil and Gas Packer Market Revenue (Million) Forecast, by Application 2019 & 2032
- Table 90: South Africa Oil and Gas Packer Market Volume (K Unit) Forecast, by Application 2019 & 2032
- Table 91: Rest of Middle East and Africa Oil and Gas Packer Market Revenue (Million) Forecast, by Application 2019 & 2032
- Table 92: Rest of Middle East and Africa Oil and Gas Packer Market Volume (K Unit) Forecast, by Application 2019 & 2032
- Table 93: Global Oil and Gas Packer Market Revenue Million Forecast, by Type 2019 & 2032
- Table 94: Global Oil and Gas Packer Market Volume K Unit Forecast, by Type 2019 & 2032
- Table 95: Global Oil and Gas Packer Market Revenue Million Forecast, by Location of Deployment 2019 & 2032
- Table 96: Global Oil and Gas Packer Market Volume K Unit Forecast, by Location of Deployment 2019 & 2032
- Table 97: Global Oil and Gas Packer Market Revenue Million Forecast, by Geogrpahy 2019 & 2032
- Table 98: Global Oil and Gas Packer Market Volume K Unit Forecast, by Geogrpahy 2019 & 2032
- Table 99: Global Oil and Gas Packer Market Revenue Million Forecast, by Country 2019 & 2032
- Table 100: Global Oil and Gas Packer Market Volume K Unit Forecast, by Country 2019 & 2032
- Table 101: United States Oil and Gas Packer Market Revenue (Million) Forecast, by Application 2019 & 2032
- Table 102: United States Oil and Gas Packer Market Volume (K Unit) Forecast, by Application 2019 & 2032
- Table 103: Canada Oil and Gas Packer Market Revenue (Million) Forecast, by Application 2019 & 2032
- Table 104: Canada Oil and Gas Packer Market Volume (K Unit) Forecast, by Application 2019 & 2032
- Table 105: Mexico Oil and Gas Packer Market Revenue (Million) Forecast, by Application 2019 & 2032
- Table 106: Mexico Oil and Gas Packer Market Volume (K Unit) Forecast, by Application 2019 & 2032
- Table 107: Global Oil and Gas Packer Market Revenue Million Forecast, by Type 2019 & 2032
- Table 108: Global Oil and Gas Packer Market Volume K Unit Forecast, by Type 2019 & 2032
- Table 109: Global Oil and Gas Packer Market Revenue Million Forecast, by Location of Deployment 2019 & 2032
- Table 110: Global Oil and Gas Packer Market Volume K Unit Forecast, by Location of Deployment 2019 & 2032
- Table 111: Global Oil and Gas Packer Market Revenue Million Forecast, by Geogrpahy 2019 & 2032
- Table 112: Global Oil and Gas Packer Market Volume K Unit Forecast, by Geogrpahy 2019 & 2032
- Table 113: Global Oil and Gas Packer Market Revenue Million Forecast, by Country 2019 & 2032
- Table 114: Global Oil and Gas Packer Market Volume K Unit Forecast, by Country 2019 & 2032
- Table 115: Brazil Oil and Gas Packer Market Revenue (Million) Forecast, by Application 2019 & 2032
- Table 116: Brazil Oil and Gas Packer Market Volume (K Unit) Forecast, by Application 2019 & 2032
- Table 117: Argentina Oil and Gas Packer Market Revenue (Million) Forecast, by Application 2019 & 2032
- Table 118: Argentina Oil and Gas Packer Market Volume (K Unit) Forecast, by Application 2019 & 2032
- Table 119: Rest of South America Oil and Gas Packer Market Revenue (Million) Forecast, by Application 2019 & 2032
- Table 120: Rest of South America Oil and Gas Packer Market Volume (K Unit) Forecast, by Application 2019 & 2032
- Table 121: Global Oil and Gas Packer Market Revenue Million Forecast, by Type 2019 & 2032
- Table 122: Global Oil and Gas Packer Market Volume K Unit Forecast, by Type 2019 & 2032
- Table 123: Global Oil and Gas Packer Market Revenue Million Forecast, by Location of Deployment 2019 & 2032
- Table 124: Global Oil and Gas Packer Market Volume K Unit Forecast, by Location of Deployment 2019 & 2032
- Table 125: Global Oil and Gas Packer Market Revenue Million Forecast, by Geogrpahy 2019 & 2032
- Table 126: Global Oil and Gas Packer Market Volume K Unit Forecast, by Geogrpahy 2019 & 2032
- Table 127: Global Oil and Gas Packer Market Revenue Million Forecast, by Country 2019 & 2032
- Table 128: Global Oil and Gas Packer Market Volume K Unit Forecast, by Country 2019 & 2032
- Table 129: United Kingdom Oil and Gas Packer Market Revenue (Million) Forecast, by Application 2019 & 2032
- Table 130: United Kingdom Oil and Gas Packer Market Volume (K Unit) Forecast, by Application 2019 & 2032
- Table 131: Germany Oil and Gas Packer Market Revenue (Million) Forecast, by Application 2019 & 2032
- Table 132: Germany Oil and Gas Packer Market Volume (K Unit) Forecast, by Application 2019 & 2032
- Table 133: France Oil and Gas Packer Market Revenue (Million) Forecast, by Application 2019 & 2032
- Table 134: France Oil and Gas Packer Market Volume (K Unit) Forecast, by Application 2019 & 2032
- Table 135: Italy Oil and Gas Packer Market Revenue (Million) Forecast, by Application 2019 & 2032
- Table 136: Italy Oil and Gas Packer Market Volume (K Unit) Forecast, by Application 2019 & 2032
- Table 137: Spain Oil and Gas Packer Market Revenue (Million) Forecast, by Application 2019 & 2032
- Table 138: Spain Oil and Gas Packer Market Volume (K Unit) Forecast, by Application 2019 & 2032
- Table 139: Russia Oil and Gas Packer Market Revenue (Million) Forecast, by Application 2019 & 2032
- Table 140: Russia Oil and Gas Packer Market Volume (K Unit) Forecast, by Application 2019 & 2032
- Table 141: Benelux Oil and Gas Packer Market Revenue (Million) Forecast, by Application 2019 & 2032
- Table 142: Benelux Oil and Gas Packer Market Volume (K Unit) Forecast, by Application 2019 & 2032
- Table 143: Nordics Oil and Gas Packer Market Revenue (Million) Forecast, by Application 2019 & 2032
- Table 144: Nordics Oil and Gas Packer Market Volume (K Unit) Forecast, by Application 2019 & 2032
- Table 145: Rest of Europe Oil and Gas Packer Market Revenue (Million) Forecast, by Application 2019 & 2032
- Table 146: Rest of Europe Oil and Gas Packer Market Volume (K Unit) Forecast, by Application 2019 & 2032
- Table 147: Global Oil and Gas Packer Market Revenue Million Forecast, by Type 2019 & 2032
- Table 148: Global Oil and Gas Packer Market Volume K Unit Forecast, by Type 2019 & 2032
- Table 149: Global Oil and Gas Packer Market Revenue Million Forecast, by Location of Deployment 2019 & 2032
- Table 150: Global Oil and Gas Packer Market Volume K Unit Forecast, by Location of Deployment 2019 & 2032
- Table 151: Global Oil and Gas Packer Market Revenue Million Forecast, by Geogrpahy 2019 & 2032
- Table 152: Global Oil and Gas Packer Market Volume K Unit Forecast, by Geogrpahy 2019 & 2032
- Table 153: Global Oil and Gas Packer Market Revenue Million Forecast, by Country 2019 & 2032
- Table 154: Global Oil and Gas Packer Market Volume K Unit Forecast, by Country 2019 & 2032
- Table 155: Turkey Oil and Gas Packer Market Revenue (Million) Forecast, by Application 2019 & 2032
- Table 156: Turkey Oil and Gas Packer Market Volume (K Unit) Forecast, by Application 2019 & 2032
- Table 157: Israel Oil and Gas Packer Market Revenue (Million) Forecast, by Application 2019 & 2032
- Table 158: Israel Oil and Gas Packer Market Volume (K Unit) Forecast, by Application 2019 & 2032
- Table 159: GCC Oil and Gas Packer Market Revenue (Million) Forecast, by Application 2019 & 2032
- Table 160: GCC Oil and Gas Packer Market Volume (K Unit) Forecast, by Application 2019 & 2032
- Table 161: North Africa Oil and Gas Packer Market Revenue (Million) Forecast, by Application 2019 & 2032
- Table 162: North Africa Oil and Gas Packer Market Volume (K Unit) Forecast, by Application 2019 & 2032
- Table 163: South Africa Oil and Gas Packer Market Revenue (Million) Forecast, by Application 2019 & 2032
- Table 164: South Africa Oil and Gas Packer Market Volume (K Unit) Forecast, by Application 2019 & 2032
- Table 165: Rest of Middle East & Africa Oil and Gas Packer Market Revenue (Million) Forecast, by Application 2019 & 2032
- Table 166: Rest of Middle East & Africa Oil and Gas Packer Market Volume (K Unit) Forecast, by Application 2019 & 2032
- Table 167: Global Oil and Gas Packer Market Revenue Million Forecast, by Type 2019 & 2032
- Table 168: Global Oil and Gas Packer Market Volume K Unit Forecast, by Type 2019 & 2032
- Table 169: Global Oil and Gas Packer Market Revenue Million Forecast, by Location of Deployment 2019 & 2032
- Table 170: Global Oil and Gas Packer Market Volume K Unit Forecast, by Location of Deployment 2019 & 2032
- Table 171: Global Oil and Gas Packer Market Revenue Million Forecast, by Geogrpahy 2019 & 2032
- Table 172: Global Oil and Gas Packer Market Volume K Unit Forecast, by Geogrpahy 2019 & 2032
- Table 173: Global Oil and Gas Packer Market Revenue Million Forecast, by Country 2019 & 2032
- Table 174: Global Oil and Gas Packer Market Volume K Unit Forecast, by Country 2019 & 2032
- Table 175: China Oil and Gas Packer Market Revenue (Million) Forecast, by Application 2019 & 2032
- Table 176: China Oil and Gas Packer Market Volume (K Unit) Forecast, by Application 2019 & 2032
- Table 177: India Oil and Gas Packer Market Revenue (Million) Forecast, by Application 2019 & 2032
- Table 178: India Oil and Gas Packer Market Volume (K Unit) Forecast, by Application 2019 & 2032
- Table 179: Japan Oil and Gas Packer Market Revenue (Million) Forecast, by Application 2019 & 2032
- Table 180: Japan Oil and Gas Packer Market Volume (K Unit) Forecast, by Application 2019 & 2032
- Table 181: South Korea Oil and Gas Packer Market Revenue (Million) Forecast, by Application 2019 & 2032
- Table 182: South Korea Oil and Gas Packer Market Volume (K Unit) Forecast, by Application 2019 & 2032
- Table 183: ASEAN Oil and Gas Packer Market Revenue (Million) Forecast, by Application 2019 & 2032
- Table 184: ASEAN Oil and Gas Packer Market Volume (K Unit) Forecast, by Application 2019 & 2032
- Table 185: Oceania Oil and Gas Packer Market Revenue (Million) Forecast, by Application 2019 & 2032
- Table 186: Oceania Oil and Gas Packer Market Volume (K Unit) Forecast, by Application 2019 & 2032
- Table 187: Rest of Asia Pacific Oil and Gas Packer Market Revenue (Million) Forecast, by Application 2019 & 2032
- Table 188: Rest of Asia Pacific Oil and Gas Packer Market Volume (K Unit) Forecast, by Application 2019 & 2032
Frequently Asked Questions
1. What is the projected Compound Annual Growth Rate (CAGR) of the Oil and Gas Packer Market?
The projected CAGR is approximately > 3.00%.
2. Which companies are prominent players in the Oil and Gas Packer Market?
Key companies in the market include National Oilwell Varco Inc, Weatherford International plc, Dril-Quip Inc, Baker Hughes Company, Halliburton Company, Wellcare oil tools pvt ltd, Schlumberger Limited.
3. What are the main segments of the Oil and Gas Packer Market?
The market segments include Type, Location of Deployment, Geogrpahy.
4. Can you provide details about the market size?
The market size is estimated to be USD XX Million as of 2022.
5. What are some drivers contributing to market growth?
Increasing Production from Unconventional Sources4.; Growing Energy Demand in the Region.
6. What are the notable trends driving market growth?
Retrievable Packer to Witness Significant Growth.
7. Are there any restraints impacting market growth?
Environmental Concerns.
8. Can you provide examples of recent developments in the market?
N/A
9. What pricing options are available for accessing the report?
Pricing options include single-user, multi-user, and enterprise licenses priced at USD 4750, USD 5250, and USD 8750 respectively.
10. Is the market size provided in terms of value or volume?
The market size is provided in terms of value, measured in Million and volume, measured in K Unit.
11. Are there any specific market keywords associated with the report?
Yes, the market keyword associated with the report is "Oil and Gas Packer Market," which aids in identifying and referencing the specific market segment covered.
12. How do I determine which pricing option suits my needs best?
The pricing options vary based on user requirements and access needs. Individual users may opt for single-user licenses, while businesses requiring broader access may choose multi-user or enterprise licenses for cost-effective access to the report.
13. Are there any additional resources or data provided in the Oil and Gas Packer Market report?
While the report offers comprehensive insights, it's advisable to review the specific contents or supplementary materials provided to ascertain if additional resources or data are available.
14. How can I stay updated on further developments or reports in the Oil and Gas Packer Market?
To stay informed about further developments, trends, and reports in the Oil and Gas Packer Market, consider subscribing to industry newsletters, following relevant companies and organizations, or regularly checking reputable industry news sources and publications.
Methodology
Step 1 - Identification of Relevant Samples Size from Population Database


Step 2 - Approaches for Defining Global Market Size (Value, Volume* & Price*)

Note*: In applicable scenarios
Step 3 - Data Sources
Primary Research
- Web Analytics
- Survey Reports
- Research Institute
- Latest Research Reports
- Opinion Leaders
Secondary Research
- Annual Reports
- White Paper
- Latest Press Release
- Industry Association
- Paid Database
- Investor Presentations

Step 4 - Data Triangulation
Involves using different sources of information in order to increase the validity of a study
These sources are likely to be stakeholders in a program - participants, other researchers, program staff, other community members, and so on.
Then we put all data in single framework & apply various statistical tools to find out the dynamic on the market.
During the analysis stage, feedback from the stakeholder groups would be compared to determine areas of agreement as well as areas of divergence


