
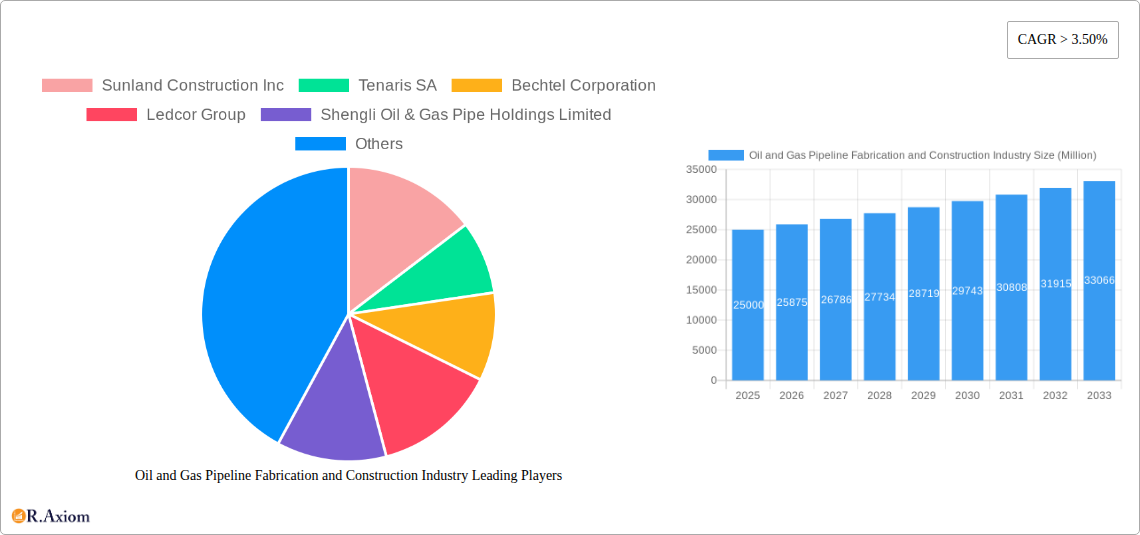
Key Insights
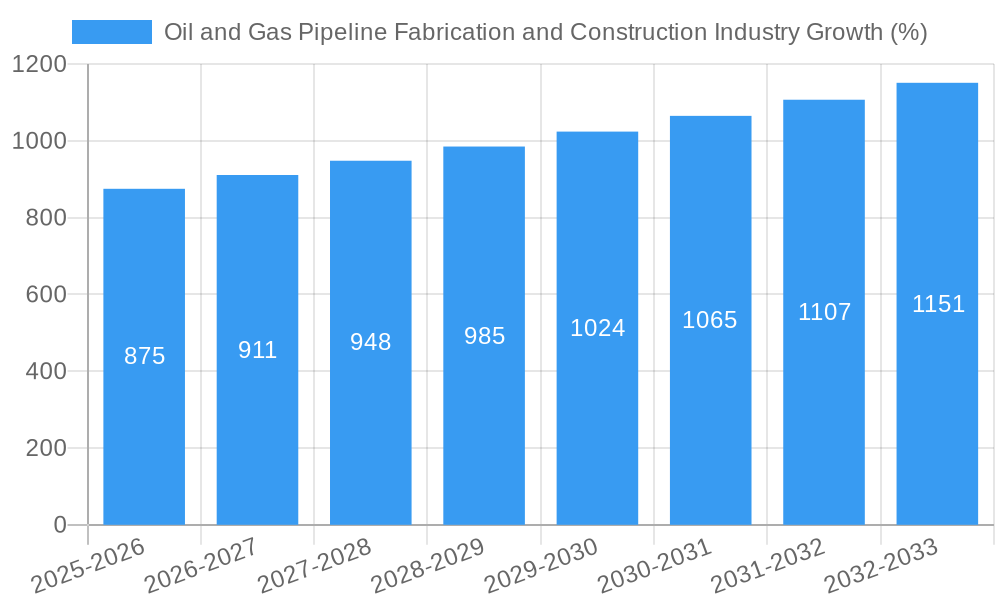
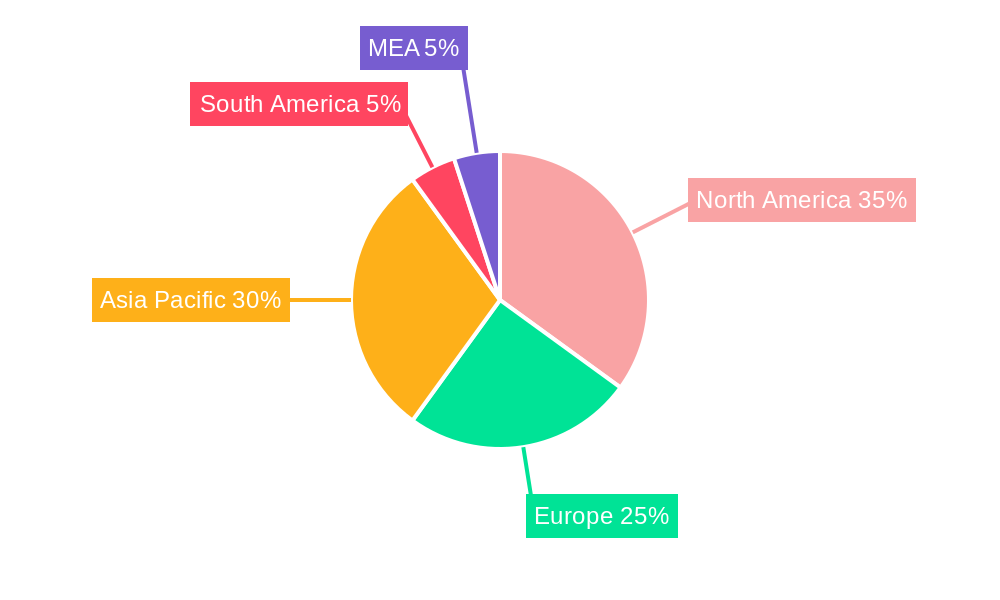
The Oil and Gas Pipeline Fabrication and Construction industry is experiencing robust growth, driven by increasing global energy demand and the need for efficient energy transportation infrastructure. A CAGR exceeding 3.5% from 2019-2033 indicates a significant expansion of this market, projected to reach a substantial size. Key drivers include rising investments in oil and gas exploration and production, particularly in regions with burgeoning energy needs like Asia-Pacific and the Middle East. Government initiatives supporting energy infrastructure development and the ongoing transition towards cleaner energy sources (though impacting some segments, it also creates new opportunities in carbon capture and storage pipelines) further fuel market expansion. Technological advancements in pipeline construction techniques, materials, and automation contribute to enhanced efficiency and reduced costs, shaping the competitive landscape. However, challenges remain, including fluctuating oil and gas prices, stringent environmental regulations necessitating stricter safety and emission standards, and geopolitical uncertainties impacting project timelines and investments. The industry's segmentation by application (oil and gas) reflects the fundamental reliance on pipelines for transporting these crucial energy resources. Major players, including Sunland Construction Inc, Tenaris SA, and Bechtel Corporation, leverage their expertise and global reach to capture market share. The regional distribution of projects showcases a strong presence in North America, Europe, and Asia-Pacific, mirroring the geographic concentration of oil and gas reserves and consumption.
The forecast period (2025-2033) anticipates continued growth despite potential headwinds. Strategic partnerships, technological innovation, and diversification into new markets will be key to success for industry players. Sustained investments in pipeline infrastructure, particularly in emerging economies and regions with substantial energy reserves, are anticipated to drive future market expansion. The industry faces the ongoing necessity to balance energy demand with environmental concerns, leading to a focus on sustainable and environmentally conscious construction practices. Understanding these drivers, trends, and restraints is critical for stakeholders to navigate this dynamic landscape and capitalize on emerging opportunities.
Oil and Gas Pipeline Fabrication and Construction Industry: A Comprehensive Market Report (2019-2033)
This comprehensive report provides a detailed analysis of the Oil and Gas Pipeline Fabrication and Construction industry, offering in-depth insights into market dynamics, competitive landscape, and future growth prospects. The study period covers 2019-2033, with 2025 serving as the base and estimated year. The forecast period spans 2025-2033, and the historical period encompasses 2019-2024. The report leverages extensive primary and secondary research to deliver actionable intelligence for industry stakeholders, including major players such as Sunland Construction Inc, Tenaris SA, Bechtel Corporation, Ledcor Group, Shengli Oil & Gas Pipe Holdings Limited, Barnard Construction Company Inc, Snelson Companies Inc, Larsen & Toubro Limited, Gateway Pipeline LLC, and Pumpco Inc. The market is segmented by application: Oil and Gas.
Oil and Gas Pipeline Fabrication and Construction Industry Market Concentration & Innovation
This section analyzes the market concentration, innovation drivers, regulatory landscape, and competitive dynamics within the oil and gas pipeline fabrication and construction industry. We examine the market share held by key players, evaluating their strategic initiatives, mergers and acquisitions (M&A) activities, and the impact of technological advancements on market consolidation. The report quantifies market concentration using metrics like the Herfindahl-Hirschman Index (HHI) and assesses the impact of recent M&A deals valued at over $XX Million.
- Market Concentration: The market is characterized by a moderate level of concentration, with a few major players holding significant market share. The HHI is estimated to be approximately xx, indicating a moderately concentrated market.
- Innovation Drivers: Technological advancements in pipeline materials, construction techniques (e.g., robotic welding, advanced inspection methods), and digitalization are key innovation drivers, enhancing efficiency and safety.
- Regulatory Framework: Stringent environmental regulations and safety standards significantly influence industry practices, driving investment in sustainable and safer technologies.
- Product Substitutes: While traditional steel pipelines dominate, there is growing interest in alternative materials like polyethylene and composite pipes, particularly for specific applications. The market penetration of these substitutes remains relatively low at approximately xx% in 2025.
- End-User Trends: The increasing demand for natural gas and the expansion of oil and gas infrastructure in developing economies are driving market growth.
- M&A Activities: The industry has witnessed significant M&A activity in recent years, with deals valued at over $XX Million, primarily aimed at expanding geographical reach and gaining access to new technologies. Consolidation is expected to continue.
Oil and Gas Pipeline Fabrication and Construction Industry Industry Trends & Insights
This section delves into the key trends shaping the oil and gas pipeline fabrication and construction market. We analyze market growth drivers, technological disruptions, consumer preferences (regarding project timelines and safety), and competitive dynamics, providing a comprehensive understanding of the industry’s trajectory. The report projects a Compound Annual Growth Rate (CAGR) of xx% during the forecast period (2025-2033), driven by factors such as increasing energy demand, infrastructure development projects, and government initiatives to improve energy security. The market penetration rate for new technologies, such as robotic welding and advanced pipeline inspection systems is projected to increase from xx% in 2025 to xx% by 2033.
Dominant Markets & Segments in Oil and Gas Pipeline Fabrication and Construction Industry
This section identifies the leading regional and application segments within the oil and gas pipeline fabrication and construction market. We analyze the key drivers of dominance in each segment, examining factors such as economic policies, infrastructure development, and regulatory frameworks. The North American region is currently the dominant market, driven by extensive existing infrastructure and ongoing investments in pipeline expansion projects. However, Asia-Pacific is expected to witness significant growth during the forecast period due to rapid economic development and rising energy demands.
- Oil Segment: This segment is expected to continue driving market growth, particularly in regions with significant oil production. The increasing demand for oil transportation infrastructure will ensure robust growth in this sector.
- Gas Segment: The global shift towards natural gas as a cleaner energy source fuels significant growth in this segment. The expansion of natural gas pipelines, particularly in developing economies, is a key factor.
- Key Drivers for North American Dominance:
- Extensive existing pipeline network.
- Significant investments in pipeline infrastructure modernization and expansion.
- Favorable regulatory environment (although this is subject to change).
- Strong presence of major industry players.
- Key Drivers for Asia-Pacific Growth:
- Rapid economic growth and increasing energy demand.
- Government initiatives to improve energy infrastructure.
- Large-scale pipeline projects underway.
Oil and Gas Pipeline Fabrication and Construction Industry Product Developments
Recent advancements focus on enhanced pipeline materials (e.g., high-strength steel, corrosion-resistant coatings), improved construction techniques (e.g., automated welding, advanced trenchless installation), and sophisticated inspection technologies (e.g., smart pigging, drone-based surveillance). These innovations contribute to enhanced pipeline safety, longevity, and operational efficiency, while simultaneously reducing environmental impact and construction costs. The market is witnessing a growing trend towards modular construction and prefabrication, leading to reduced on-site construction time and costs.
Report Scope & Segmentation Analysis
The report segments the market by application:
Oil: This segment encompasses the fabrication and construction of pipelines for crude oil and refined petroleum products transportation. We project a market size of $XX Million in 2025, growing to $XX Million by 2033. The competitive landscape is highly consolidated, with a few large players dominating the market.
Gas: This segment involves the construction of pipelines for natural gas transportation. We forecast a market size of $XX Million in 2025, expanding to $XX Million by 2033, fueled by increasing demand for natural gas and infrastructure development projects. Competition is intense, with numerous companies vying for market share.
Key Drivers of Oil and Gas Pipeline Fabrication and Construction Industry Growth
Several factors propel the industry's growth:
Rising Energy Demand: Globally increasing energy consumption drives the need for extensive pipeline networks to transport oil and gas.
Infrastructure Development: Investments in new pipeline projects and the expansion of existing networks are significant growth drivers, particularly in developing economies.
Government Policies: Government support for energy infrastructure development through subsidies and regulatory frameworks influences market growth.
Challenges in the Oil and Gas Pipeline Fabrication and Construction Industry Sector
The industry faces significant challenges:
Regulatory Hurdles: Stringent environmental and safety regulations increase project costs and timelines. Compliance costs are estimated to account for xx% of total project costs.
Supply Chain Disruptions: Fluctuations in material prices and supply chain bottlenecks can impact project profitability and timelines.
Competitive Pressures: The industry is highly competitive, with companies constantly vying for market share, leading to price wars and reduced profit margins.
Emerging Opportunities in Oil and Gas Pipeline Fabrication and Construction Industry
Several opportunities exist:
Technological Advancements: The adoption of advanced technologies such as AI-powered pipeline monitoring systems and robotic welding creates cost savings and improves efficiency.
New Markets: The exploration and development of unconventional oil and gas resources in emerging markets offer significant growth potential.
Sustainable Practices: Increased focus on environmental sustainability drives demand for eco-friendly pipeline construction methods and materials.
Leading Players in the Oil and Gas Pipeline Fabrication and Construction Industry Market
- Sunland Construction Inc
- Tenaris SA
- Bechtel Corporation
- Ledcor Group
- Shengli Oil & Gas Pipe Holdings Limited
- Barnard Construction Company Inc
- Snelson Companies Inc
- Larsen & Toubro Limited
- Gateway Pipeline LLC
- Pumpco Inc
Key Developments in Oil and Gas Pipeline Fabrication and Construction Industry Industry
- January 2023: Bechtel Corporation secures a major contract for a new natural gas pipeline project in the Middle East.
- June 2022: Tenaris SA launches a new generation of high-strength steel pipe for enhanced pipeline safety.
- October 2021: Ledcor Group acquires a smaller pipeline construction company, expanding its geographical footprint. (Note: Specific details of M&A values and timelines are subject to the availability of public information.)
Strategic Outlook for Oil and Gas Pipeline Fabrication and Construction Industry Market
The oil and gas pipeline fabrication and construction market is poised for sustained growth, driven by increasing global energy demand and significant investments in energy infrastructure. Strategic opportunities lie in embracing technological innovation, focusing on sustainable construction practices, and expanding into new and emerging markets. Companies that prioritize safety, efficiency, and environmental responsibility are best positioned to succeed in this dynamic market.
Oil and Gas Pipeline Fabrication and Construction Industry Segmentation
-
1. Application
- 1.1. Oil
- 1.2. Gas
Oil and Gas Pipeline Fabrication and Construction Industry Segmentation By Geography
- 1. North America
- 2. Europe
- 3. Asia Pacific
- 4. South America
- 5. Middle East and Africa
Oil and Gas Pipeline Fabrication and Construction Industry REPORT HIGHLIGHTS
| Aspects | Details |
|---|---|
| Study Period | 2019-2033 |
| Base Year | 2024 |
| Estimated Year | 2025 |
| Forecast Period | 2025-2033 |
| Historical Period | 2019-2024 |
| Growth Rate | CAGR of > 3.50% from 2019-2033 |
| Segmentation |
|
Table of Contents
- 1. Introduction
- 1.1. Research Scope
- 1.2. Market Segmentation
- 1.3. Research Methodology
- 1.4. Definitions and Assumptions
- 2. Executive Summary
- 2.1. Introduction
- 3. Market Dynamics
- 3.1. Introduction
- 3.2. Market Drivers
- 3.2.1 4.; Increasing Investment in LNG Infrastructure4.; Rising Demand for LNG in Bunkering
- 3.2.2 Road Transportation
- 3.2.3 and Off-grid Power
- 3.3. Market Restrains
- 3.3.1. 4.; Lack of Supporting Infrastructure in the Regions such as the Middle East and Africa
- 3.4. Market Trends
- 3.4.1. Gas Segment to Record Significant Growth
- 4. Market Factor Analysis
- 4.1. Porters Five Forces
- 4.2. Supply/Value Chain
- 4.3. PESTEL analysis
- 4.4. Market Entropy
- 4.5. Patent/Trademark Analysis
- 5. Global Oil and Gas Pipeline Fabrication and Construction Industry Analysis, Insights and Forecast, 2019-2031
- 5.1. Market Analysis, Insights and Forecast - by Application
- 5.1.1. Oil
- 5.1.2. Gas
- 5.2. Market Analysis, Insights and Forecast - by Region
- 5.2.1. North America
- 5.2.2. Europe
- 5.2.3. Asia Pacific
- 5.2.4. South America
- 5.2.5. Middle East and Africa
- 5.1. Market Analysis, Insights and Forecast - by Application
- 6. North America Oil and Gas Pipeline Fabrication and Construction Industry Analysis, Insights and Forecast, 2019-2031
- 6.1. Market Analysis, Insights and Forecast - by Application
- 6.1.1. Oil
- 6.1.2. Gas
- 6.1. Market Analysis, Insights and Forecast - by Application
- 7. Europe Oil and Gas Pipeline Fabrication and Construction Industry Analysis, Insights and Forecast, 2019-2031
- 7.1. Market Analysis, Insights and Forecast - by Application
- 7.1.1. Oil
- 7.1.2. Gas
- 7.1. Market Analysis, Insights and Forecast - by Application
- 8. Asia Pacific Oil and Gas Pipeline Fabrication and Construction Industry Analysis, Insights and Forecast, 2019-2031
- 8.1. Market Analysis, Insights and Forecast - by Application
- 8.1.1. Oil
- 8.1.2. Gas
- 8.1. Market Analysis, Insights and Forecast - by Application
- 9. South America Oil and Gas Pipeline Fabrication and Construction Industry Analysis, Insights and Forecast, 2019-2031
- 9.1. Market Analysis, Insights and Forecast - by Application
- 9.1.1. Oil
- 9.1.2. Gas
- 9.1. Market Analysis, Insights and Forecast - by Application
- 10. Middle East and Africa Oil and Gas Pipeline Fabrication and Construction Industry Analysis, Insights and Forecast, 2019-2031
- 10.1. Market Analysis, Insights and Forecast - by Application
- 10.1.1. Oil
- 10.1.2. Gas
- 10.1. Market Analysis, Insights and Forecast - by Application
- 11. North America Oil and Gas Pipeline Fabrication and Construction Industry Analysis, Insights and Forecast, 2019-2031
- 11.1. Market Analysis, Insights and Forecast - By Country/Sub-region
- 11.1.1 United States
- 11.1.2 Canada
- 11.1.3 Mexico
- 12. Europe Oil and Gas Pipeline Fabrication and Construction Industry Analysis, Insights and Forecast, 2019-2031
- 12.1. Market Analysis, Insights and Forecast - By Country/Sub-region
- 12.1.1 Germany
- 12.1.2 United Kingdom
- 12.1.3 France
- 12.1.4 Spain
- 12.1.5 Italy
- 12.1.6 Spain
- 12.1.7 Belgium
- 12.1.8 Netherland
- 12.1.9 Nordics
- 12.1.10 Rest of Europe
- 13. Asia Pacific Oil and Gas Pipeline Fabrication and Construction Industry Analysis, Insights and Forecast, 2019-2031
- 13.1. Market Analysis, Insights and Forecast - By Country/Sub-region
- 13.1.1 China
- 13.1.2 Japan
- 13.1.3 India
- 13.1.4 South Korea
- 13.1.5 Southeast Asia
- 13.1.6 Australia
- 13.1.7 Indonesia
- 13.1.8 Phillipes
- 13.1.9 Singapore
- 13.1.10 Thailandc
- 13.1.11 Rest of Asia Pacific
- 14. South America Oil and Gas Pipeline Fabrication and Construction Industry Analysis, Insights and Forecast, 2019-2031
- 14.1. Market Analysis, Insights and Forecast - By Country/Sub-region
- 14.1.1 Brazil
- 14.1.2 Argentina
- 14.1.3 Peru
- 14.1.4 Chile
- 14.1.5 Colombia
- 14.1.6 Ecuador
- 14.1.7 Venezuela
- 14.1.8 Rest of South America
- 15. North America Oil and Gas Pipeline Fabrication and Construction Industry Analysis, Insights and Forecast, 2019-2031
- 15.1. Market Analysis, Insights and Forecast - By Country/Sub-region
- 15.1.1 United States
- 15.1.2 Canada
- 15.1.3 Mexico
- 16. MEA Oil and Gas Pipeline Fabrication and Construction Industry Analysis, Insights and Forecast, 2019-2031
- 16.1. Market Analysis, Insights and Forecast - By Country/Sub-region
- 16.1.1 United Arab Emirates
- 16.1.2 Saudi Arabia
- 16.1.3 South Africa
- 16.1.4 Rest of Middle East and Africa
- 17. Competitive Analysis
- 17.1. Global Market Share Analysis 2024
- 17.2. Company Profiles
- 17.2.1 Sunland Construction Inc
- 17.2.1.1. Overview
- 17.2.1.2. Products
- 17.2.1.3. SWOT Analysis
- 17.2.1.4. Recent Developments
- 17.2.1.5. Financials (Based on Availability)
- 17.2.2 Tenaris SA
- 17.2.2.1. Overview
- 17.2.2.2. Products
- 17.2.2.3. SWOT Analysis
- 17.2.2.4. Recent Developments
- 17.2.2.5. Financials (Based on Availability)
- 17.2.3 Bechtel Corporation
- 17.2.3.1. Overview
- 17.2.3.2. Products
- 17.2.3.3. SWOT Analysis
- 17.2.3.4. Recent Developments
- 17.2.3.5. Financials (Based on Availability)
- 17.2.4 Ledcor Group
- 17.2.4.1. Overview
- 17.2.4.2. Products
- 17.2.4.3. SWOT Analysis
- 17.2.4.4. Recent Developments
- 17.2.4.5. Financials (Based on Availability)
- 17.2.5 Shengli Oil & Gas Pipe Holdings Limited
- 17.2.5.1. Overview
- 17.2.5.2. Products
- 17.2.5.3. SWOT Analysis
- 17.2.5.4. Recent Developments
- 17.2.5.5. Financials (Based on Availability)
- 17.2.6 Barnard Construction Company Inc
- 17.2.6.1. Overview
- 17.2.6.2. Products
- 17.2.6.3. SWOT Analysis
- 17.2.6.4. Recent Developments
- 17.2.6.5. Financials (Based on Availability)
- 17.2.7 Snelson Companies Inc
- 17.2.7.1. Overview
- 17.2.7.2. Products
- 17.2.7.3. SWOT Analysis
- 17.2.7.4. Recent Developments
- 17.2.7.5. Financials (Based on Availability)
- 17.2.8 Larsen & Toubro Limited*List Not Exhaustive
- 17.2.8.1. Overview
- 17.2.8.2. Products
- 17.2.8.3. SWOT Analysis
- 17.2.8.4. Recent Developments
- 17.2.8.5. Financials (Based on Availability)
- 17.2.9 Gateway Pipeline LLC
- 17.2.9.1. Overview
- 17.2.9.2. Products
- 17.2.9.3. SWOT Analysis
- 17.2.9.4. Recent Developments
- 17.2.9.5. Financials (Based on Availability)
- 17.2.10 Pumpco Inc
- 17.2.10.1. Overview
- 17.2.10.2. Products
- 17.2.10.3. SWOT Analysis
- 17.2.10.4. Recent Developments
- 17.2.10.5. Financials (Based on Availability)
- 17.2.1 Sunland Construction Inc
List of Figures
- Figure 1: Global Oil and Gas Pipeline Fabrication and Construction Industry Revenue Breakdown (Million, %) by Region 2024 & 2032
- Figure 2: North America Oil and Gas Pipeline Fabrication and Construction Industry Revenue (Million), by Country 2024 & 2032
- Figure 3: North America Oil and Gas Pipeline Fabrication and Construction Industry Revenue Share (%), by Country 2024 & 2032
- Figure 4: Europe Oil and Gas Pipeline Fabrication and Construction Industry Revenue (Million), by Country 2024 & 2032
- Figure 5: Europe Oil and Gas Pipeline Fabrication and Construction Industry Revenue Share (%), by Country 2024 & 2032
- Figure 6: Asia Pacific Oil and Gas Pipeline Fabrication and Construction Industry Revenue (Million), by Country 2024 & 2032
- Figure 7: Asia Pacific Oil and Gas Pipeline Fabrication and Construction Industry Revenue Share (%), by Country 2024 & 2032
- Figure 8: South America Oil and Gas Pipeline Fabrication and Construction Industry Revenue (Million), by Country 2024 & 2032
- Figure 9: South America Oil and Gas Pipeline Fabrication and Construction Industry Revenue Share (%), by Country 2024 & 2032
- Figure 10: North America Oil and Gas Pipeline Fabrication and Construction Industry Revenue (Million), by Country 2024 & 2032
- Figure 11: North America Oil and Gas Pipeline Fabrication and Construction Industry Revenue Share (%), by Country 2024 & 2032
- Figure 12: MEA Oil and Gas Pipeline Fabrication and Construction Industry Revenue (Million), by Country 2024 & 2032
- Figure 13: MEA Oil and Gas Pipeline Fabrication and Construction Industry Revenue Share (%), by Country 2024 & 2032
- Figure 14: North America Oil and Gas Pipeline Fabrication and Construction Industry Revenue (Million), by Application 2024 & 2032
- Figure 15: North America Oil and Gas Pipeline Fabrication and Construction Industry Revenue Share (%), by Application 2024 & 2032
- Figure 16: North America Oil and Gas Pipeline Fabrication and Construction Industry Revenue (Million), by Country 2024 & 2032
- Figure 17: North America Oil and Gas Pipeline Fabrication and Construction Industry Revenue Share (%), by Country 2024 & 2032
- Figure 18: Europe Oil and Gas Pipeline Fabrication and Construction Industry Revenue (Million), by Application 2024 & 2032
- Figure 19: Europe Oil and Gas Pipeline Fabrication and Construction Industry Revenue Share (%), by Application 2024 & 2032
- Figure 20: Europe Oil and Gas Pipeline Fabrication and Construction Industry Revenue (Million), by Country 2024 & 2032
- Figure 21: Europe Oil and Gas Pipeline Fabrication and Construction Industry Revenue Share (%), by Country 2024 & 2032
- Figure 22: Asia Pacific Oil and Gas Pipeline Fabrication and Construction Industry Revenue (Million), by Application 2024 & 2032
- Figure 23: Asia Pacific Oil and Gas Pipeline Fabrication and Construction Industry Revenue Share (%), by Application 2024 & 2032
- Figure 24: Asia Pacific Oil and Gas Pipeline Fabrication and Construction Industry Revenue (Million), by Country 2024 & 2032
- Figure 25: Asia Pacific Oil and Gas Pipeline Fabrication and Construction Industry Revenue Share (%), by Country 2024 & 2032
- Figure 26: South America Oil and Gas Pipeline Fabrication and Construction Industry Revenue (Million), by Application 2024 & 2032
- Figure 27: South America Oil and Gas Pipeline Fabrication and Construction Industry Revenue Share (%), by Application 2024 & 2032
- Figure 28: South America Oil and Gas Pipeline Fabrication and Construction Industry Revenue (Million), by Country 2024 & 2032
- Figure 29: South America Oil and Gas Pipeline Fabrication and Construction Industry Revenue Share (%), by Country 2024 & 2032
- Figure 30: Middle East and Africa Oil and Gas Pipeline Fabrication and Construction Industry Revenue (Million), by Application 2024 & 2032
- Figure 31: Middle East and Africa Oil and Gas Pipeline Fabrication and Construction Industry Revenue Share (%), by Application 2024 & 2032
- Figure 32: Middle East and Africa Oil and Gas Pipeline Fabrication and Construction Industry Revenue (Million), by Country 2024 & 2032
- Figure 33: Middle East and Africa Oil and Gas Pipeline Fabrication and Construction Industry Revenue Share (%), by Country 2024 & 2032
List of Tables
- Table 1: Global Oil and Gas Pipeline Fabrication and Construction Industry Revenue Million Forecast, by Region 2019 & 2032
- Table 2: Global Oil and Gas Pipeline Fabrication and Construction Industry Revenue Million Forecast, by Application 2019 & 2032
- Table 3: Global Oil and Gas Pipeline Fabrication and Construction Industry Revenue Million Forecast, by Region 2019 & 2032
- Table 4: Global Oil and Gas Pipeline Fabrication and Construction Industry Revenue Million Forecast, by Country 2019 & 2032
- Table 5: United States Oil and Gas Pipeline Fabrication and Construction Industry Revenue (Million) Forecast, by Application 2019 & 2032
- Table 6: Canada Oil and Gas Pipeline Fabrication and Construction Industry Revenue (Million) Forecast, by Application 2019 & 2032
- Table 7: Mexico Oil and Gas Pipeline Fabrication and Construction Industry Revenue (Million) Forecast, by Application 2019 & 2032
- Table 8: Global Oil and Gas Pipeline Fabrication and Construction Industry Revenue Million Forecast, by Country 2019 & 2032
- Table 9: Germany Oil and Gas Pipeline Fabrication and Construction Industry Revenue (Million) Forecast, by Application 2019 & 2032
- Table 10: United Kingdom Oil and Gas Pipeline Fabrication and Construction Industry Revenue (Million) Forecast, by Application 2019 & 2032
- Table 11: France Oil and Gas Pipeline Fabrication and Construction Industry Revenue (Million) Forecast, by Application 2019 & 2032
- Table 12: Spain Oil and Gas Pipeline Fabrication and Construction Industry Revenue (Million) Forecast, by Application 2019 & 2032
- Table 13: Italy Oil and Gas Pipeline Fabrication and Construction Industry Revenue (Million) Forecast, by Application 2019 & 2032
- Table 14: Spain Oil and Gas Pipeline Fabrication and Construction Industry Revenue (Million) Forecast, by Application 2019 & 2032
- Table 15: Belgium Oil and Gas Pipeline Fabrication and Construction Industry Revenue (Million) Forecast, by Application 2019 & 2032
- Table 16: Netherland Oil and Gas Pipeline Fabrication and Construction Industry Revenue (Million) Forecast, by Application 2019 & 2032
- Table 17: Nordics Oil and Gas Pipeline Fabrication and Construction Industry Revenue (Million) Forecast, by Application 2019 & 2032
- Table 18: Rest of Europe Oil and Gas Pipeline Fabrication and Construction Industry Revenue (Million) Forecast, by Application 2019 & 2032
- Table 19: Global Oil and Gas Pipeline Fabrication and Construction Industry Revenue Million Forecast, by Country 2019 & 2032
- Table 20: China Oil and Gas Pipeline Fabrication and Construction Industry Revenue (Million) Forecast, by Application 2019 & 2032
- Table 21: Japan Oil and Gas Pipeline Fabrication and Construction Industry Revenue (Million) Forecast, by Application 2019 & 2032
- Table 22: India Oil and Gas Pipeline Fabrication and Construction Industry Revenue (Million) Forecast, by Application 2019 & 2032
- Table 23: South Korea Oil and Gas Pipeline Fabrication and Construction Industry Revenue (Million) Forecast, by Application 2019 & 2032
- Table 24: Southeast Asia Oil and Gas Pipeline Fabrication and Construction Industry Revenue (Million) Forecast, by Application 2019 & 2032
- Table 25: Australia Oil and Gas Pipeline Fabrication and Construction Industry Revenue (Million) Forecast, by Application 2019 & 2032
- Table 26: Indonesia Oil and Gas Pipeline Fabrication and Construction Industry Revenue (Million) Forecast, by Application 2019 & 2032
- Table 27: Phillipes Oil and Gas Pipeline Fabrication and Construction Industry Revenue (Million) Forecast, by Application 2019 & 2032
- Table 28: Singapore Oil and Gas Pipeline Fabrication and Construction Industry Revenue (Million) Forecast, by Application 2019 & 2032
- Table 29: Thailandc Oil and Gas Pipeline Fabrication and Construction Industry Revenue (Million) Forecast, by Application 2019 & 2032
- Table 30: Rest of Asia Pacific Oil and Gas Pipeline Fabrication and Construction Industry Revenue (Million) Forecast, by Application 2019 & 2032
- Table 31: Global Oil and Gas Pipeline Fabrication and Construction Industry Revenue Million Forecast, by Country 2019 & 2032
- Table 32: Brazil Oil and Gas Pipeline Fabrication and Construction Industry Revenue (Million) Forecast, by Application 2019 & 2032
- Table 33: Argentina Oil and Gas Pipeline Fabrication and Construction Industry Revenue (Million) Forecast, by Application 2019 & 2032
- Table 34: Peru Oil and Gas Pipeline Fabrication and Construction Industry Revenue (Million) Forecast, by Application 2019 & 2032
- Table 35: Chile Oil and Gas Pipeline Fabrication and Construction Industry Revenue (Million) Forecast, by Application 2019 & 2032
- Table 36: Colombia Oil and Gas Pipeline Fabrication and Construction Industry Revenue (Million) Forecast, by Application 2019 & 2032
- Table 37: Ecuador Oil and Gas Pipeline Fabrication and Construction Industry Revenue (Million) Forecast, by Application 2019 & 2032
- Table 38: Venezuela Oil and Gas Pipeline Fabrication and Construction Industry Revenue (Million) Forecast, by Application 2019 & 2032
- Table 39: Rest of South America Oil and Gas Pipeline Fabrication and Construction Industry Revenue (Million) Forecast, by Application 2019 & 2032
- Table 40: Global Oil and Gas Pipeline Fabrication and Construction Industry Revenue Million Forecast, by Country 2019 & 2032
- Table 41: United States Oil and Gas Pipeline Fabrication and Construction Industry Revenue (Million) Forecast, by Application 2019 & 2032
- Table 42: Canada Oil and Gas Pipeline Fabrication and Construction Industry Revenue (Million) Forecast, by Application 2019 & 2032
- Table 43: Mexico Oil and Gas Pipeline Fabrication and Construction Industry Revenue (Million) Forecast, by Application 2019 & 2032
- Table 44: Global Oil and Gas Pipeline Fabrication and Construction Industry Revenue Million Forecast, by Country 2019 & 2032
- Table 45: United Arab Emirates Oil and Gas Pipeline Fabrication and Construction Industry Revenue (Million) Forecast, by Application 2019 & 2032
- Table 46: Saudi Arabia Oil and Gas Pipeline Fabrication and Construction Industry Revenue (Million) Forecast, by Application 2019 & 2032
- Table 47: South Africa Oil and Gas Pipeline Fabrication and Construction Industry Revenue (Million) Forecast, by Application 2019 & 2032
- Table 48: Rest of Middle East and Africa Oil and Gas Pipeline Fabrication and Construction Industry Revenue (Million) Forecast, by Application 2019 & 2032
- Table 49: Global Oil and Gas Pipeline Fabrication and Construction Industry Revenue Million Forecast, by Application 2019 & 2032
- Table 50: Global Oil and Gas Pipeline Fabrication and Construction Industry Revenue Million Forecast, by Country 2019 & 2032
- Table 51: Global Oil and Gas Pipeline Fabrication and Construction Industry Revenue Million Forecast, by Application 2019 & 2032
- Table 52: Global Oil and Gas Pipeline Fabrication and Construction Industry Revenue Million Forecast, by Country 2019 & 2032
- Table 53: Global Oil and Gas Pipeline Fabrication and Construction Industry Revenue Million Forecast, by Application 2019 & 2032
- Table 54: Global Oil and Gas Pipeline Fabrication and Construction Industry Revenue Million Forecast, by Country 2019 & 2032
- Table 55: Global Oil and Gas Pipeline Fabrication and Construction Industry Revenue Million Forecast, by Application 2019 & 2032
- Table 56: Global Oil and Gas Pipeline Fabrication and Construction Industry Revenue Million Forecast, by Country 2019 & 2032
- Table 57: Global Oil and Gas Pipeline Fabrication and Construction Industry Revenue Million Forecast, by Application 2019 & 2032
- Table 58: Global Oil and Gas Pipeline Fabrication and Construction Industry Revenue Million Forecast, by Country 2019 & 2032
Frequently Asked Questions
1. What is the projected Compound Annual Growth Rate (CAGR) of the Oil and Gas Pipeline Fabrication and Construction Industry?
The projected CAGR is approximately > 3.50%.
2. Which companies are prominent players in the Oil and Gas Pipeline Fabrication and Construction Industry?
Key companies in the market include Sunland Construction Inc, Tenaris SA, Bechtel Corporation, Ledcor Group, Shengli Oil & Gas Pipe Holdings Limited, Barnard Construction Company Inc, Snelson Companies Inc, Larsen & Toubro Limited*List Not Exhaustive, Gateway Pipeline LLC, Pumpco Inc.
3. What are the main segments of the Oil and Gas Pipeline Fabrication and Construction Industry?
The market segments include Application.
4. Can you provide details about the market size?
The market size is estimated to be USD XX Million as of 2022.
5. What are some drivers contributing to market growth?
4.; Increasing Investment in LNG Infrastructure4.; Rising Demand for LNG in Bunkering. Road Transportation. and Off-grid Power.
6. What are the notable trends driving market growth?
Gas Segment to Record Significant Growth.
7. Are there any restraints impacting market growth?
4.; Lack of Supporting Infrastructure in the Regions such as the Middle East and Africa.
8. Can you provide examples of recent developments in the market?
N/A
9. What pricing options are available for accessing the report?
Pricing options include single-user, multi-user, and enterprise licenses priced at USD 4750, USD 5250, and USD 8750 respectively.
10. Is the market size provided in terms of value or volume?
The market size is provided in terms of value, measured in Million.
11. Are there any specific market keywords associated with the report?
Yes, the market keyword associated with the report is "Oil and Gas Pipeline Fabrication and Construction Industry," which aids in identifying and referencing the specific market segment covered.
12. How do I determine which pricing option suits my needs best?
The pricing options vary based on user requirements and access needs. Individual users may opt for single-user licenses, while businesses requiring broader access may choose multi-user or enterprise licenses for cost-effective access to the report.
13. Are there any additional resources or data provided in the Oil and Gas Pipeline Fabrication and Construction Industry report?
While the report offers comprehensive insights, it's advisable to review the specific contents or supplementary materials provided to ascertain if additional resources or data are available.
14. How can I stay updated on further developments or reports in the Oil and Gas Pipeline Fabrication and Construction Industry?
To stay informed about further developments, trends, and reports in the Oil and Gas Pipeline Fabrication and Construction Industry, consider subscribing to industry newsletters, following relevant companies and organizations, or regularly checking reputable industry news sources and publications.
Methodology
Step 1 - Identification of Relevant Samples Size from Population Database


Step 2 - Approaches for Defining Global Market Size (Value, Volume* & Price*)

Note*: In applicable scenarios
Step 3 - Data Sources
Primary Research
- Web Analytics
- Survey Reports
- Research Institute
- Latest Research Reports
- Opinion Leaders
Secondary Research
- Annual Reports
- White Paper
- Latest Press Release
- Industry Association
- Paid Database
- Investor Presentations

Step 4 - Data Triangulation
Involves using different sources of information in order to increase the validity of a study
These sources are likely to be stakeholders in a program - participants, other researchers, program staff, other community members, and so on.
Then we put all data in single framework & apply various statistical tools to find out the dynamic on the market.
During the analysis stage, feedback from the stakeholder groups would be compared to determine areas of agreement as well as areas of divergence


