
Key Insights
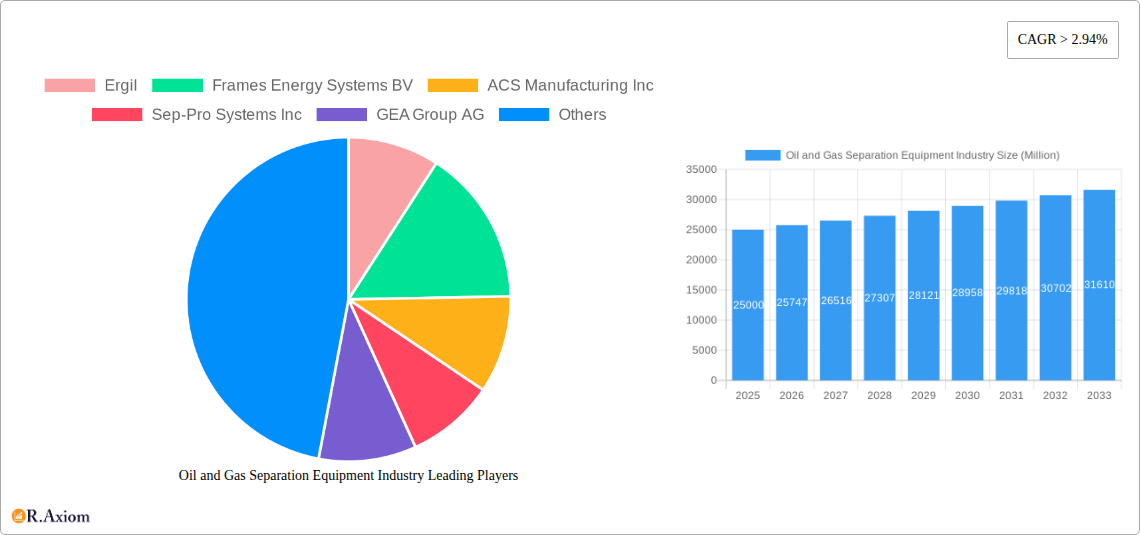
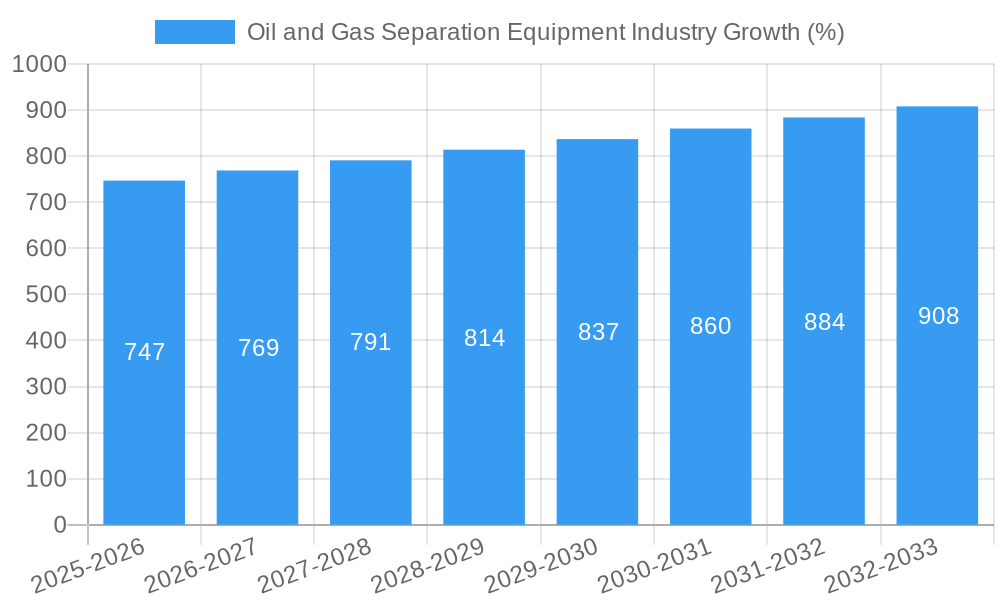
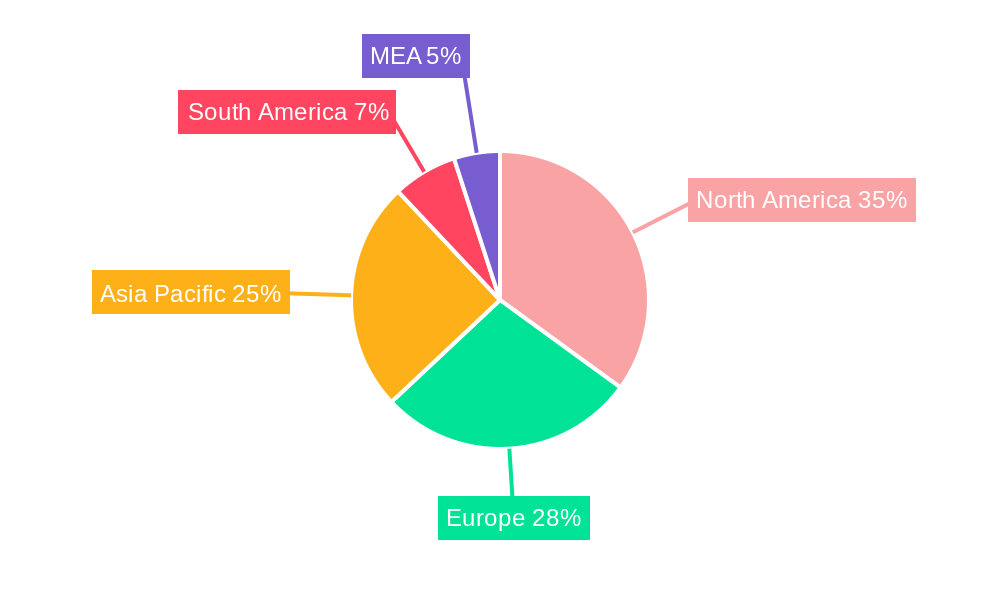
The oil and gas separation equipment market is experiencing robust growth, driven by increasing global energy demand and ongoing exploration and production activities in both onshore and offshore environments. A compound annual growth rate (CAGR) exceeding 2.94% indicates a consistently expanding market, projected to reach significant value over the forecast period (2025-2033). Key growth drivers include the rising adoption of advanced separation technologies, stringent environmental regulations promoting efficient gas processing, and the expansion of existing and new oil and gas fields globally. The market segmentation reveals strong demand across various applications, including upstream and downstream operations, with horizontal, vertical, and spherical separators seeing consistent adoption across both sectors. Two-phase and three-phase separators dominate the type segment, reflecting the diverse processing needs within the industry. Leading companies like Ergil, Frames Energy Systems BV, ACS Manufacturing Inc., Sep-Pro Systems Inc., GEA Group AG, Halliburton, Schlumberger, Pentair PLC, and Alfa Laval are major players, continuously innovating and expanding their market share through technological advancements and strategic partnerships. The geographic distribution shows significant market presence in North America, Europe, and Asia Pacific, with growth opportunities expected in emerging economies across regions like South America and the Middle East and Africa, driven by infrastructure development and increased investment in oil and gas exploration.
The market's growth trajectory is further influenced by several trends, including the increasing focus on automation and digitalization in oil and gas operations, leading to the adoption of smart separators with enhanced monitoring and control capabilities. Furthermore, the demand for energy-efficient separation technologies, reducing operational costs and environmental impact, is driving innovation. However, market restraints include fluctuating oil and gas prices, geopolitical instability affecting project timelines, and the increasing capital expenditure required for deploying advanced separation systems. Despite these challenges, the overall outlook for the oil and gas separation equipment market remains positive, with substantial growth anticipated in the coming years driven by persistent global energy demands and the continuous evolution of separation technologies.
Oil and Gas Separation Equipment Industry: A Comprehensive Market Analysis (2019-2033)
This in-depth report provides a comprehensive analysis of the Oil and Gas Separation Equipment industry, offering actionable insights for stakeholders across the value chain. The study covers the period from 2019 to 2033, with 2025 as the base and estimated year. The report utilizes rigorous data analysis and forecasting methodologies to deliver a clear understanding of market trends, competitive dynamics, and future growth prospects. The total market size in 2025 is estimated at $XX Million.
Oil and Gas Separation Equipment Industry Market Concentration & Innovation
The Oil and Gas Separation Equipment market exhibits a moderately concentrated structure, with several major players holding significant market share. Key players include Ergil, Frames Energy Systems BV, ACS Manufacturing Inc, Sep-Pro Systems Inc, GEA Group AG, Halliburton Company, Schlumberger Limited, Pentair PLC, and Alfa Laval AB. However, the market also features several smaller, specialized companies. The combined market share of the top five players is estimated at XX%, indicating room for both organic growth and acquisitions. Innovation is driven by the need for increased efficiency, improved safety, and reduced environmental impact. This is manifested in the development of advanced materials, automation, and digitalization within separation technologies. Regulatory frameworks, such as those focused on emissions reduction and operational safety, significantly influence technological advancements. Furthermore, the growing adoption of alternative energy sources represents a potential substitute for conventional oil and gas, impacting market growth in the long term. Mergers and acquisitions (M&A) activity has been relatively robust in recent years, with deal values totaling $XX Million in 2024, primarily driven by companies seeking to expand their product portfolios and geographic reach.
- Market Concentration: Top 5 players hold approximately XX% market share in 2025.
- M&A Activity: Total deal value in 2024 estimated at $XX Million.
- Innovation Drivers: Efficiency gains, safety improvements, environmental regulations.
- Substitutes: Growing adoption of renewable energy sources.
Oil and Gas Separation Equipment Industry Industry Trends & Insights
The Oil and Gas Separation Equipment market is experiencing significant growth, driven primarily by increasing global energy demand and ongoing exploration and production activities in both upstream and downstream segments. The Compound Annual Growth Rate (CAGR) during the forecast period (2025-2033) is projected at XX%. Technological disruptions, such as the adoption of advanced sensors and data analytics, are enhancing operational efficiency and optimizing separation processes. Consumer preferences are shifting towards environmentally friendly and sustainable solutions, placing pressure on manufacturers to develop more energy-efficient and less polluting equipment. Competitive dynamics are characterized by intense competition among established players, leading to strategic alliances, technological innovations, and aggressive pricing strategies. Market penetration of advanced separation technologies like three-phase separators is increasing steadily, reaching an estimated XX% market penetration by 2033.
Dominant Markets & Segments in Oil and Gas Separation Equipment Industry
The Upstream segment dominates the market, accounting for approximately XX% of the total revenue in 2025. This is mainly attributable to the significant investments made in oil and gas exploration and production activities globally. Geographically, North America and the Middle East represent the largest regional markets.
- Area of Application: Upstream (Dominant), Offshore, Downstream
- Key Drivers (Upstream): Increased exploration and production activity, higher oil and gas prices.
- Vessel Orientation: Horizontal Separators, Vertical Separators, Spherical Separators. Horizontal separators currently hold the largest market share due to their suitability for various applications and scalability.
- Type: Two-phase Separators, Three-phase Separators. The demand for three-phase separators is growing rapidly due to the increasing complexity of fluid mixtures.
Oil and Gas Separation Equipment Industry Product Developments
Recent product developments focus on enhancing separation efficiency, reducing operating costs, and minimizing environmental impact. This includes advancements in materials science leading to corrosion-resistant and lightweight designs, improved automation and control systems for enhanced process optimization, and the integration of digital technologies for predictive maintenance and real-time monitoring. These innovations deliver significant competitive advantages through improved performance, reduced downtime, and enhanced operational safety.
Report Scope & Segmentation Analysis
This report segments the market by area of application (Upstream, Offshore, Downstream), vessel orientation (Horizontal, Vertical, Spherical), and separator type (Two-phase, Three-phase). Each segment is analyzed in detail, providing insights into its growth trajectory, market size, and competitive landscape. Growth projections vary across segments, with the Upstream segment exhibiting the highest growth rate, followed by Offshore and then Downstream. The market size for each segment in 2025 is projected at Upstream: $XX Million; Offshore: $XX Million; Downstream: $XX Million; Horizontal Separators: $XX Million; Vertical Separators: $XX Million; Spherical Separators: $XX Million; Two-phase Separators: $XX Million; Three-phase Separators: $XX Million.
Key Drivers of Oil and Gas Separation Equipment Industry Growth
The growth of the Oil and Gas Separation Equipment industry is primarily driven by several factors: the rising global demand for energy, increasing investments in exploration and production activities, stringent environmental regulations promoting efficient separation technologies, and technological advancements leading to improved separation efficiency and reduced operational costs. The development of new oil and gas reserves in previously untapped regions also contributes significantly to market growth.
Challenges in the Oil and Gas Separation Equipment Industry Sector
The industry faces significant challenges, including fluctuating oil and gas prices impacting investment decisions, volatile supply chain dynamics affecting procurement costs and lead times, and increasing regulatory scrutiny regarding emissions and operational safety. Competition from both established players and new entrants also creates pricing pressures and necessitates continuous innovation. These challenges can result in reduced profit margins and slower market growth in certain periods.
Emerging Opportunities in Oil and Gas Separation Equipment Industry
Emerging opportunities include the growing demand for enhanced oil recovery (EOR) techniques, the adoption of advanced automation and digitalization technologies, and the expansion into new geographic markets with significant oil and gas exploration potential. The development of more sustainable and environmentally friendly separation technologies represents a substantial opportunity for industry players to meet the growing demand for cleaner energy solutions. Moreover, increasing offshore exploration activities present significant growth prospects.
Leading Players in the Oil and Gas Separation Equipment Industry Market
- Ergil
- Frames Energy Systems BV
- ACS Manufacturing Inc
- Sep-Pro Systems Inc
- GEA Group AG
- Halliburton Company
- Schlumberger Limited
- Pentair PLC
- Alfa Laval AB
Key Developments in Oil and Gas Separation Equipment Industry Industry
- 2023-Q4: GEA Group AG launches a new line of high-efficiency three-phase separators.
- 2024-Q1: Halliburton Company acquires a smaller separation equipment manufacturer, expanding its market share.
- 2024-Q3: Schlumberger Limited announces a strategic partnership to develop advanced sensor technology for predictive maintenance in separation equipment.
- Further details on specific developments will be included in the full report.
Strategic Outlook for Oil and Gas Separation Equipment Industry Market
The future of the Oil and Gas Separation Equipment market looks promising, driven by the continuous growth in global energy demand and advancements in separation technologies. Focus on efficiency gains, sustainability, and digitalization will be key for success. The market is projected to continue its growth trajectory over the next decade, providing significant opportunities for established players and new entrants alike. Companies that successfully adapt to evolving market dynamics and technological advancements will be well-positioned to capture significant market share.
Oil and Gas Separation Equipment Industry Segmentation
-
1. Vessel Orientation
- 1.1. Horizontal Separator
- 1.2. Vertical Separator
- 1.3. Spherical Separator
-
2. Type
- 2.1. Two-phase Separator
- 2.2. Three-phase Separator
-
3. Area of Application
-
3.1. Upstream
- 3.1.1. Onshore
- 3.1.2. Offshore
- 3.2. Downstream
-
3.1. Upstream
Oil and Gas Separation Equipment Industry Segmentation By Geography
- 1. North America
- 2. Europe
- 3. Asia Pacific
- 4. South America
- 5. Middle East and Africa
Oil and Gas Separation Equipment Industry REPORT HIGHLIGHTS
| Aspects | Details |
|---|---|
| Study Period | 2019-2033 |
| Base Year | 2024 |
| Estimated Year | 2025 |
| Forecast Period | 2025-2033 |
| Historical Period | 2019-2024 |
| Growth Rate | CAGR of > 2.94% from 2019-2033 |
| Segmentation |
|
Table of Contents
- 1. Introduction
- 1.1. Research Scope
- 1.2. Market Segmentation
- 1.3. Research Methodology
- 1.4. Definitions and Assumptions
- 2. Executive Summary
- 2.1. Introduction
- 3. Market Dynamics
- 3.1. Introduction
- 3.2. Market Drivers
- 3.2.1. 4.; Increasing Industrialization across the World4.; Expansion and Development of New Power Plants
- 3.3. Market Restrains
- 3.3.1. 4.; Increasing Adoption of Renewable Energy
- 3.4. Market Trends
- 3.4.1. Upstream Sector to Dominate the Market
- 4. Market Factor Analysis
- 4.1. Porters Five Forces
- 4.2. Supply/Value Chain
- 4.3. PESTEL analysis
- 4.4. Market Entropy
- 4.5. Patent/Trademark Analysis
- 5. Global Oil and Gas Separation Equipment Industry Analysis, Insights and Forecast, 2019-2031
- 5.1. Market Analysis, Insights and Forecast - by Vessel Orientation
- 5.1.1. Horizontal Separator
- 5.1.2. Vertical Separator
- 5.1.3. Spherical Separator
- 5.2. Market Analysis, Insights and Forecast - by Type
- 5.2.1. Two-phase Separator
- 5.2.2. Three-phase Separator
- 5.3. Market Analysis, Insights and Forecast - by Area of Application
- 5.3.1. Upstream
- 5.3.1.1. Onshore
- 5.3.1.2. Offshore
- 5.3.2. Downstream
- 5.3.1. Upstream
- 5.4. Market Analysis, Insights and Forecast - by Region
- 5.4.1. North America
- 5.4.2. Europe
- 5.4.3. Asia Pacific
- 5.4.4. South America
- 5.4.5. Middle East and Africa
- 5.1. Market Analysis, Insights and Forecast - by Vessel Orientation
- 6. North America Oil and Gas Separation Equipment Industry Analysis, Insights and Forecast, 2019-2031
- 6.1. Market Analysis, Insights and Forecast - by Vessel Orientation
- 6.1.1. Horizontal Separator
- 6.1.2. Vertical Separator
- 6.1.3. Spherical Separator
- 6.2. Market Analysis, Insights and Forecast - by Type
- 6.2.1. Two-phase Separator
- 6.2.2. Three-phase Separator
- 6.3. Market Analysis, Insights and Forecast - by Area of Application
- 6.3.1. Upstream
- 6.3.1.1. Onshore
- 6.3.1.2. Offshore
- 6.3.2. Downstream
- 6.3.1. Upstream
- 6.1. Market Analysis, Insights and Forecast - by Vessel Orientation
- 7. Europe Oil and Gas Separation Equipment Industry Analysis, Insights and Forecast, 2019-2031
- 7.1. Market Analysis, Insights and Forecast - by Vessel Orientation
- 7.1.1. Horizontal Separator
- 7.1.2. Vertical Separator
- 7.1.3. Spherical Separator
- 7.2. Market Analysis, Insights and Forecast - by Type
- 7.2.1. Two-phase Separator
- 7.2.2. Three-phase Separator
- 7.3. Market Analysis, Insights and Forecast - by Area of Application
- 7.3.1. Upstream
- 7.3.1.1. Onshore
- 7.3.1.2. Offshore
- 7.3.2. Downstream
- 7.3.1. Upstream
- 7.1. Market Analysis, Insights and Forecast - by Vessel Orientation
- 8. Asia Pacific Oil and Gas Separation Equipment Industry Analysis, Insights and Forecast, 2019-2031
- 8.1. Market Analysis, Insights and Forecast - by Vessel Orientation
- 8.1.1. Horizontal Separator
- 8.1.2. Vertical Separator
- 8.1.3. Spherical Separator
- 8.2. Market Analysis, Insights and Forecast - by Type
- 8.2.1. Two-phase Separator
- 8.2.2. Three-phase Separator
- 8.3. Market Analysis, Insights and Forecast - by Area of Application
- 8.3.1. Upstream
- 8.3.1.1. Onshore
- 8.3.1.2. Offshore
- 8.3.2. Downstream
- 8.3.1. Upstream
- 8.1. Market Analysis, Insights and Forecast - by Vessel Orientation
- 9. South America Oil and Gas Separation Equipment Industry Analysis, Insights and Forecast, 2019-2031
- 9.1. Market Analysis, Insights and Forecast - by Vessel Orientation
- 9.1.1. Horizontal Separator
- 9.1.2. Vertical Separator
- 9.1.3. Spherical Separator
- 9.2. Market Analysis, Insights and Forecast - by Type
- 9.2.1. Two-phase Separator
- 9.2.2. Three-phase Separator
- 9.3. Market Analysis, Insights and Forecast - by Area of Application
- 9.3.1. Upstream
- 9.3.1.1. Onshore
- 9.3.1.2. Offshore
- 9.3.2. Downstream
- 9.3.1. Upstream
- 9.1. Market Analysis, Insights and Forecast - by Vessel Orientation
- 10. Middle East and Africa Oil and Gas Separation Equipment Industry Analysis, Insights and Forecast, 2019-2031
- 10.1. Market Analysis, Insights and Forecast - by Vessel Orientation
- 10.1.1. Horizontal Separator
- 10.1.2. Vertical Separator
- 10.1.3. Spherical Separator
- 10.2. Market Analysis, Insights and Forecast - by Type
- 10.2.1. Two-phase Separator
- 10.2.2. Three-phase Separator
- 10.3. Market Analysis, Insights and Forecast - by Area of Application
- 10.3.1. Upstream
- 10.3.1.1. Onshore
- 10.3.1.2. Offshore
- 10.3.2. Downstream
- 10.3.1. Upstream
- 10.1. Market Analysis, Insights and Forecast - by Vessel Orientation
- 11. North America Oil and Gas Separation Equipment Industry Analysis, Insights and Forecast, 2019-2031
- 11.1. Market Analysis, Insights and Forecast - By Country/Sub-region
- 11.1.1 United States
- 11.1.2 Canada
- 11.1.3 Mexico
- 12. Europe Oil and Gas Separation Equipment Industry Analysis, Insights and Forecast, 2019-2031
- 12.1. Market Analysis, Insights and Forecast - By Country/Sub-region
- 12.1.1 Germany
- 12.1.2 United Kingdom
- 12.1.3 France
- 12.1.4 Spain
- 12.1.5 Italy
- 12.1.6 Spain
- 12.1.7 Belgium
- 12.1.8 Netherland
- 12.1.9 Nordics
- 12.1.10 Rest of Europe
- 13. Asia Pacific Oil and Gas Separation Equipment Industry Analysis, Insights and Forecast, 2019-2031
- 13.1. Market Analysis, Insights and Forecast - By Country/Sub-region
- 13.1.1 China
- 13.1.2 Japan
- 13.1.3 India
- 13.1.4 South Korea
- 13.1.5 Southeast Asia
- 13.1.6 Australia
- 13.1.7 Indonesia
- 13.1.8 Phillipes
- 13.1.9 Singapore
- 13.1.10 Thailandc
- 13.1.11 Rest of Asia Pacific
- 14. South America Oil and Gas Separation Equipment Industry Analysis, Insights and Forecast, 2019-2031
- 14.1. Market Analysis, Insights and Forecast - By Country/Sub-region
- 14.1.1 Brazil
- 14.1.2 Argentina
- 14.1.3 Peru
- 14.1.4 Chile
- 14.1.5 Colombia
- 14.1.6 Ecuador
- 14.1.7 Venezuela
- 14.1.8 Rest of South America
- 15. North America Oil and Gas Separation Equipment Industry Analysis, Insights and Forecast, 2019-2031
- 15.1. Market Analysis, Insights and Forecast - By Country/Sub-region
- 15.1.1 United States
- 15.1.2 Canada
- 15.1.3 Mexico
- 16. MEA Oil and Gas Separation Equipment Industry Analysis, Insights and Forecast, 2019-2031
- 16.1. Market Analysis, Insights and Forecast - By Country/Sub-region
- 16.1.1 United Arab Emirates
- 16.1.2 Saudi Arabia
- 16.1.3 South Africa
- 16.1.4 Rest of Middle East and Africa
- 17. Competitive Analysis
- 17.1. Global Market Share Analysis 2024
- 17.2. Company Profiles
- 17.2.1 Ergil
- 17.2.1.1. Overview
- 17.2.1.2. Products
- 17.2.1.3. SWOT Analysis
- 17.2.1.4. Recent Developments
- 17.2.1.5. Financials (Based on Availability)
- 17.2.2 Frames Energy Systems BV
- 17.2.2.1. Overview
- 17.2.2.2. Products
- 17.2.2.3. SWOT Analysis
- 17.2.2.4. Recent Developments
- 17.2.2.5. Financials (Based on Availability)
- 17.2.3 ACS Manufacturing Inc
- 17.2.3.1. Overview
- 17.2.3.2. Products
- 17.2.3.3. SWOT Analysis
- 17.2.3.4. Recent Developments
- 17.2.3.5. Financials (Based on Availability)
- 17.2.4 Sep-Pro Systems Inc
- 17.2.4.1. Overview
- 17.2.4.2. Products
- 17.2.4.3. SWOT Analysis
- 17.2.4.4. Recent Developments
- 17.2.4.5. Financials (Based on Availability)
- 17.2.5 GEA Group AG
- 17.2.5.1. Overview
- 17.2.5.2. Products
- 17.2.5.3. SWOT Analysis
- 17.2.5.4. Recent Developments
- 17.2.5.5. Financials (Based on Availability)
- 17.2.6 Halliburton Company*List Not Exhaustive
- 17.2.6.1. Overview
- 17.2.6.2. Products
- 17.2.6.3. SWOT Analysis
- 17.2.6.4. Recent Developments
- 17.2.6.5. Financials (Based on Availability)
- 17.2.7 Schlumberger Limited
- 17.2.7.1. Overview
- 17.2.7.2. Products
- 17.2.7.3. SWOT Analysis
- 17.2.7.4. Recent Developments
- 17.2.7.5. Financials (Based on Availability)
- 17.2.8 Pentair PLC
- 17.2.8.1. Overview
- 17.2.8.2. Products
- 17.2.8.3. SWOT Analysis
- 17.2.8.4. Recent Developments
- 17.2.8.5. Financials (Based on Availability)
- 17.2.9 Alfa Laval AB
- 17.2.9.1. Overview
- 17.2.9.2. Products
- 17.2.9.3. SWOT Analysis
- 17.2.9.4. Recent Developments
- 17.2.9.5. Financials (Based on Availability)
- 17.2.1 Ergil
List of Figures
- Figure 1: Global Oil and Gas Separation Equipment Industry Revenue Breakdown (Million, %) by Region 2024 & 2032
- Figure 2: North America Oil and Gas Separation Equipment Industry Revenue (Million), by Country 2024 & 2032
- Figure 3: North America Oil and Gas Separation Equipment Industry Revenue Share (%), by Country 2024 & 2032
- Figure 4: Europe Oil and Gas Separation Equipment Industry Revenue (Million), by Country 2024 & 2032
- Figure 5: Europe Oil and Gas Separation Equipment Industry Revenue Share (%), by Country 2024 & 2032
- Figure 6: Asia Pacific Oil and Gas Separation Equipment Industry Revenue (Million), by Country 2024 & 2032
- Figure 7: Asia Pacific Oil and Gas Separation Equipment Industry Revenue Share (%), by Country 2024 & 2032
- Figure 8: South America Oil and Gas Separation Equipment Industry Revenue (Million), by Country 2024 & 2032
- Figure 9: South America Oil and Gas Separation Equipment Industry Revenue Share (%), by Country 2024 & 2032
- Figure 10: North America Oil and Gas Separation Equipment Industry Revenue (Million), by Country 2024 & 2032
- Figure 11: North America Oil and Gas Separation Equipment Industry Revenue Share (%), by Country 2024 & 2032
- Figure 12: MEA Oil and Gas Separation Equipment Industry Revenue (Million), by Country 2024 & 2032
- Figure 13: MEA Oil and Gas Separation Equipment Industry Revenue Share (%), by Country 2024 & 2032
- Figure 14: North America Oil and Gas Separation Equipment Industry Revenue (Million), by Vessel Orientation 2024 & 2032
- Figure 15: North America Oil and Gas Separation Equipment Industry Revenue Share (%), by Vessel Orientation 2024 & 2032
- Figure 16: North America Oil and Gas Separation Equipment Industry Revenue (Million), by Type 2024 & 2032
- Figure 17: North America Oil and Gas Separation Equipment Industry Revenue Share (%), by Type 2024 & 2032
- Figure 18: North America Oil and Gas Separation Equipment Industry Revenue (Million), by Area of Application 2024 & 2032
- Figure 19: North America Oil and Gas Separation Equipment Industry Revenue Share (%), by Area of Application 2024 & 2032
- Figure 20: North America Oil and Gas Separation Equipment Industry Revenue (Million), by Country 2024 & 2032
- Figure 21: North America Oil and Gas Separation Equipment Industry Revenue Share (%), by Country 2024 & 2032
- Figure 22: Europe Oil and Gas Separation Equipment Industry Revenue (Million), by Vessel Orientation 2024 & 2032
- Figure 23: Europe Oil and Gas Separation Equipment Industry Revenue Share (%), by Vessel Orientation 2024 & 2032
- Figure 24: Europe Oil and Gas Separation Equipment Industry Revenue (Million), by Type 2024 & 2032
- Figure 25: Europe Oil and Gas Separation Equipment Industry Revenue Share (%), by Type 2024 & 2032
- Figure 26: Europe Oil and Gas Separation Equipment Industry Revenue (Million), by Area of Application 2024 & 2032
- Figure 27: Europe Oil and Gas Separation Equipment Industry Revenue Share (%), by Area of Application 2024 & 2032
- Figure 28: Europe Oil and Gas Separation Equipment Industry Revenue (Million), by Country 2024 & 2032
- Figure 29: Europe Oil and Gas Separation Equipment Industry Revenue Share (%), by Country 2024 & 2032
- Figure 30: Asia Pacific Oil and Gas Separation Equipment Industry Revenue (Million), by Vessel Orientation 2024 & 2032
- Figure 31: Asia Pacific Oil and Gas Separation Equipment Industry Revenue Share (%), by Vessel Orientation 2024 & 2032
- Figure 32: Asia Pacific Oil and Gas Separation Equipment Industry Revenue (Million), by Type 2024 & 2032
- Figure 33: Asia Pacific Oil and Gas Separation Equipment Industry Revenue Share (%), by Type 2024 & 2032
- Figure 34: Asia Pacific Oil and Gas Separation Equipment Industry Revenue (Million), by Area of Application 2024 & 2032
- Figure 35: Asia Pacific Oil and Gas Separation Equipment Industry Revenue Share (%), by Area of Application 2024 & 2032
- Figure 36: Asia Pacific Oil and Gas Separation Equipment Industry Revenue (Million), by Country 2024 & 2032
- Figure 37: Asia Pacific Oil and Gas Separation Equipment Industry Revenue Share (%), by Country 2024 & 2032
- Figure 38: South America Oil and Gas Separation Equipment Industry Revenue (Million), by Vessel Orientation 2024 & 2032
- Figure 39: South America Oil and Gas Separation Equipment Industry Revenue Share (%), by Vessel Orientation 2024 & 2032
- Figure 40: South America Oil and Gas Separation Equipment Industry Revenue (Million), by Type 2024 & 2032
- Figure 41: South America Oil and Gas Separation Equipment Industry Revenue Share (%), by Type 2024 & 2032
- Figure 42: South America Oil and Gas Separation Equipment Industry Revenue (Million), by Area of Application 2024 & 2032
- Figure 43: South America Oil and Gas Separation Equipment Industry Revenue Share (%), by Area of Application 2024 & 2032
- Figure 44: South America Oil and Gas Separation Equipment Industry Revenue (Million), by Country 2024 & 2032
- Figure 45: South America Oil and Gas Separation Equipment Industry Revenue Share (%), by Country 2024 & 2032
- Figure 46: Middle East and Africa Oil and Gas Separation Equipment Industry Revenue (Million), by Vessel Orientation 2024 & 2032
- Figure 47: Middle East and Africa Oil and Gas Separation Equipment Industry Revenue Share (%), by Vessel Orientation 2024 & 2032
- Figure 48: Middle East and Africa Oil and Gas Separation Equipment Industry Revenue (Million), by Type 2024 & 2032
- Figure 49: Middle East and Africa Oil and Gas Separation Equipment Industry Revenue Share (%), by Type 2024 & 2032
- Figure 50: Middle East and Africa Oil and Gas Separation Equipment Industry Revenue (Million), by Area of Application 2024 & 2032
- Figure 51: Middle East and Africa Oil and Gas Separation Equipment Industry Revenue Share (%), by Area of Application 2024 & 2032
- Figure 52: Middle East and Africa Oil and Gas Separation Equipment Industry Revenue (Million), by Country 2024 & 2032
- Figure 53: Middle East and Africa Oil and Gas Separation Equipment Industry Revenue Share (%), by Country 2024 & 2032
List of Tables
- Table 1: Global Oil and Gas Separation Equipment Industry Revenue Million Forecast, by Region 2019 & 2032
- Table 2: Global Oil and Gas Separation Equipment Industry Revenue Million Forecast, by Vessel Orientation 2019 & 2032
- Table 3: Global Oil and Gas Separation Equipment Industry Revenue Million Forecast, by Type 2019 & 2032
- Table 4: Global Oil and Gas Separation Equipment Industry Revenue Million Forecast, by Area of Application 2019 & 2032
- Table 5: Global Oil and Gas Separation Equipment Industry Revenue Million Forecast, by Region 2019 & 2032
- Table 6: Global Oil and Gas Separation Equipment Industry Revenue Million Forecast, by Country 2019 & 2032
- Table 7: United States Oil and Gas Separation Equipment Industry Revenue (Million) Forecast, by Application 2019 & 2032
- Table 8: Canada Oil and Gas Separation Equipment Industry Revenue (Million) Forecast, by Application 2019 & 2032
- Table 9: Mexico Oil and Gas Separation Equipment Industry Revenue (Million) Forecast, by Application 2019 & 2032
- Table 10: Global Oil and Gas Separation Equipment Industry Revenue Million Forecast, by Country 2019 & 2032
- Table 11: Germany Oil and Gas Separation Equipment Industry Revenue (Million) Forecast, by Application 2019 & 2032
- Table 12: United Kingdom Oil and Gas Separation Equipment Industry Revenue (Million) Forecast, by Application 2019 & 2032
- Table 13: France Oil and Gas Separation Equipment Industry Revenue (Million) Forecast, by Application 2019 & 2032
- Table 14: Spain Oil and Gas Separation Equipment Industry Revenue (Million) Forecast, by Application 2019 & 2032
- Table 15: Italy Oil and Gas Separation Equipment Industry Revenue (Million) Forecast, by Application 2019 & 2032
- Table 16: Spain Oil and Gas Separation Equipment Industry Revenue (Million) Forecast, by Application 2019 & 2032
- Table 17: Belgium Oil and Gas Separation Equipment Industry Revenue (Million) Forecast, by Application 2019 & 2032
- Table 18: Netherland Oil and Gas Separation Equipment Industry Revenue (Million) Forecast, by Application 2019 & 2032
- Table 19: Nordics Oil and Gas Separation Equipment Industry Revenue (Million) Forecast, by Application 2019 & 2032
- Table 20: Rest of Europe Oil and Gas Separation Equipment Industry Revenue (Million) Forecast, by Application 2019 & 2032
- Table 21: Global Oil and Gas Separation Equipment Industry Revenue Million Forecast, by Country 2019 & 2032
- Table 22: China Oil and Gas Separation Equipment Industry Revenue (Million) Forecast, by Application 2019 & 2032
- Table 23: Japan Oil and Gas Separation Equipment Industry Revenue (Million) Forecast, by Application 2019 & 2032
- Table 24: India Oil and Gas Separation Equipment Industry Revenue (Million) Forecast, by Application 2019 & 2032
- Table 25: South Korea Oil and Gas Separation Equipment Industry Revenue (Million) Forecast, by Application 2019 & 2032
- Table 26: Southeast Asia Oil and Gas Separation Equipment Industry Revenue (Million) Forecast, by Application 2019 & 2032
- Table 27: Australia Oil and Gas Separation Equipment Industry Revenue (Million) Forecast, by Application 2019 & 2032
- Table 28: Indonesia Oil and Gas Separation Equipment Industry Revenue (Million) Forecast, by Application 2019 & 2032
- Table 29: Phillipes Oil and Gas Separation Equipment Industry Revenue (Million) Forecast, by Application 2019 & 2032
- Table 30: Singapore Oil and Gas Separation Equipment Industry Revenue (Million) Forecast, by Application 2019 & 2032
- Table 31: Thailandc Oil and Gas Separation Equipment Industry Revenue (Million) Forecast, by Application 2019 & 2032
- Table 32: Rest of Asia Pacific Oil and Gas Separation Equipment Industry Revenue (Million) Forecast, by Application 2019 & 2032
- Table 33: Global Oil and Gas Separation Equipment Industry Revenue Million Forecast, by Country 2019 & 2032
- Table 34: Brazil Oil and Gas Separation Equipment Industry Revenue (Million) Forecast, by Application 2019 & 2032
- Table 35: Argentina Oil and Gas Separation Equipment Industry Revenue (Million) Forecast, by Application 2019 & 2032
- Table 36: Peru Oil and Gas Separation Equipment Industry Revenue (Million) Forecast, by Application 2019 & 2032
- Table 37: Chile Oil and Gas Separation Equipment Industry Revenue (Million) Forecast, by Application 2019 & 2032
- Table 38: Colombia Oil and Gas Separation Equipment Industry Revenue (Million) Forecast, by Application 2019 & 2032
- Table 39: Ecuador Oil and Gas Separation Equipment Industry Revenue (Million) Forecast, by Application 2019 & 2032
- Table 40: Venezuela Oil and Gas Separation Equipment Industry Revenue (Million) Forecast, by Application 2019 & 2032
- Table 41: Rest of South America Oil and Gas Separation Equipment Industry Revenue (Million) Forecast, by Application 2019 & 2032
- Table 42: Global Oil and Gas Separation Equipment Industry Revenue Million Forecast, by Country 2019 & 2032
- Table 43: United States Oil and Gas Separation Equipment Industry Revenue (Million) Forecast, by Application 2019 & 2032
- Table 44: Canada Oil and Gas Separation Equipment Industry Revenue (Million) Forecast, by Application 2019 & 2032
- Table 45: Mexico Oil and Gas Separation Equipment Industry Revenue (Million) Forecast, by Application 2019 & 2032
- Table 46: Global Oil and Gas Separation Equipment Industry Revenue Million Forecast, by Country 2019 & 2032
- Table 47: United Arab Emirates Oil and Gas Separation Equipment Industry Revenue (Million) Forecast, by Application 2019 & 2032
- Table 48: Saudi Arabia Oil and Gas Separation Equipment Industry Revenue (Million) Forecast, by Application 2019 & 2032
- Table 49: South Africa Oil and Gas Separation Equipment Industry Revenue (Million) Forecast, by Application 2019 & 2032
- Table 50: Rest of Middle East and Africa Oil and Gas Separation Equipment Industry Revenue (Million) Forecast, by Application 2019 & 2032
- Table 51: Global Oil and Gas Separation Equipment Industry Revenue Million Forecast, by Vessel Orientation 2019 & 2032
- Table 52: Global Oil and Gas Separation Equipment Industry Revenue Million Forecast, by Type 2019 & 2032
- Table 53: Global Oil and Gas Separation Equipment Industry Revenue Million Forecast, by Area of Application 2019 & 2032
- Table 54: Global Oil and Gas Separation Equipment Industry Revenue Million Forecast, by Country 2019 & 2032
- Table 55: Global Oil and Gas Separation Equipment Industry Revenue Million Forecast, by Vessel Orientation 2019 & 2032
- Table 56: Global Oil and Gas Separation Equipment Industry Revenue Million Forecast, by Type 2019 & 2032
- Table 57: Global Oil and Gas Separation Equipment Industry Revenue Million Forecast, by Area of Application 2019 & 2032
- Table 58: Global Oil and Gas Separation Equipment Industry Revenue Million Forecast, by Country 2019 & 2032
- Table 59: Global Oil and Gas Separation Equipment Industry Revenue Million Forecast, by Vessel Orientation 2019 & 2032
- Table 60: Global Oil and Gas Separation Equipment Industry Revenue Million Forecast, by Type 2019 & 2032
- Table 61: Global Oil and Gas Separation Equipment Industry Revenue Million Forecast, by Area of Application 2019 & 2032
- Table 62: Global Oil and Gas Separation Equipment Industry Revenue Million Forecast, by Country 2019 & 2032
- Table 63: Global Oil and Gas Separation Equipment Industry Revenue Million Forecast, by Vessel Orientation 2019 & 2032
- Table 64: Global Oil and Gas Separation Equipment Industry Revenue Million Forecast, by Type 2019 & 2032
- Table 65: Global Oil and Gas Separation Equipment Industry Revenue Million Forecast, by Area of Application 2019 & 2032
- Table 66: Global Oil and Gas Separation Equipment Industry Revenue Million Forecast, by Country 2019 & 2032
- Table 67: Global Oil and Gas Separation Equipment Industry Revenue Million Forecast, by Vessel Orientation 2019 & 2032
- Table 68: Global Oil and Gas Separation Equipment Industry Revenue Million Forecast, by Type 2019 & 2032
- Table 69: Global Oil and Gas Separation Equipment Industry Revenue Million Forecast, by Area of Application 2019 & 2032
- Table 70: Global Oil and Gas Separation Equipment Industry Revenue Million Forecast, by Country 2019 & 2032
Frequently Asked Questions
1. What is the projected Compound Annual Growth Rate (CAGR) of the Oil and Gas Separation Equipment Industry?
The projected CAGR is approximately > 2.94%.
2. Which companies are prominent players in the Oil and Gas Separation Equipment Industry?
Key companies in the market include Ergil, Frames Energy Systems BV, ACS Manufacturing Inc, Sep-Pro Systems Inc, GEA Group AG, Halliburton Company*List Not Exhaustive, Schlumberger Limited, Pentair PLC, Alfa Laval AB.
3. What are the main segments of the Oil and Gas Separation Equipment Industry?
The market segments include Vessel Orientation, Type, Area of Application.
4. Can you provide details about the market size?
The market size is estimated to be USD XX Million as of 2022.
5. What are some drivers contributing to market growth?
4.; Increasing Industrialization across the World4.; Expansion and Development of New Power Plants.
6. What are the notable trends driving market growth?
Upstream Sector to Dominate the Market.
7. Are there any restraints impacting market growth?
4.; Increasing Adoption of Renewable Energy.
8. Can you provide examples of recent developments in the market?
N/A
9. What pricing options are available for accessing the report?
Pricing options include single-user, multi-user, and enterprise licenses priced at USD 4750, USD 5250, and USD 8750 respectively.
10. Is the market size provided in terms of value or volume?
The market size is provided in terms of value, measured in Million.
11. Are there any specific market keywords associated with the report?
Yes, the market keyword associated with the report is "Oil and Gas Separation Equipment Industry," which aids in identifying and referencing the specific market segment covered.
12. How do I determine which pricing option suits my needs best?
The pricing options vary based on user requirements and access needs. Individual users may opt for single-user licenses, while businesses requiring broader access may choose multi-user or enterprise licenses for cost-effective access to the report.
13. Are there any additional resources or data provided in the Oil and Gas Separation Equipment Industry report?
While the report offers comprehensive insights, it's advisable to review the specific contents or supplementary materials provided to ascertain if additional resources or data are available.
14. How can I stay updated on further developments or reports in the Oil and Gas Separation Equipment Industry?
To stay informed about further developments, trends, and reports in the Oil and Gas Separation Equipment Industry, consider subscribing to industry newsletters, following relevant companies and organizations, or regularly checking reputable industry news sources and publications.
Methodology
Step 1 - Identification of Relevant Samples Size from Population Database


Step 2 - Approaches for Defining Global Market Size (Value, Volume* & Price*)

Note*: In applicable scenarios
Step 3 - Data Sources
Primary Research
- Web Analytics
- Survey Reports
- Research Institute
- Latest Research Reports
- Opinion Leaders
Secondary Research
- Annual Reports
- White Paper
- Latest Press Release
- Industry Association
- Paid Database
- Investor Presentations

Step 4 - Data Triangulation
Involves using different sources of information in order to increase the validity of a study
These sources are likely to be stakeholders in a program - participants, other researchers, program staff, other community members, and so on.
Then we put all data in single framework & apply various statistical tools to find out the dynamic on the market.
During the analysis stage, feedback from the stakeholder groups would be compared to determine areas of agreement as well as areas of divergence


