
Key Insights
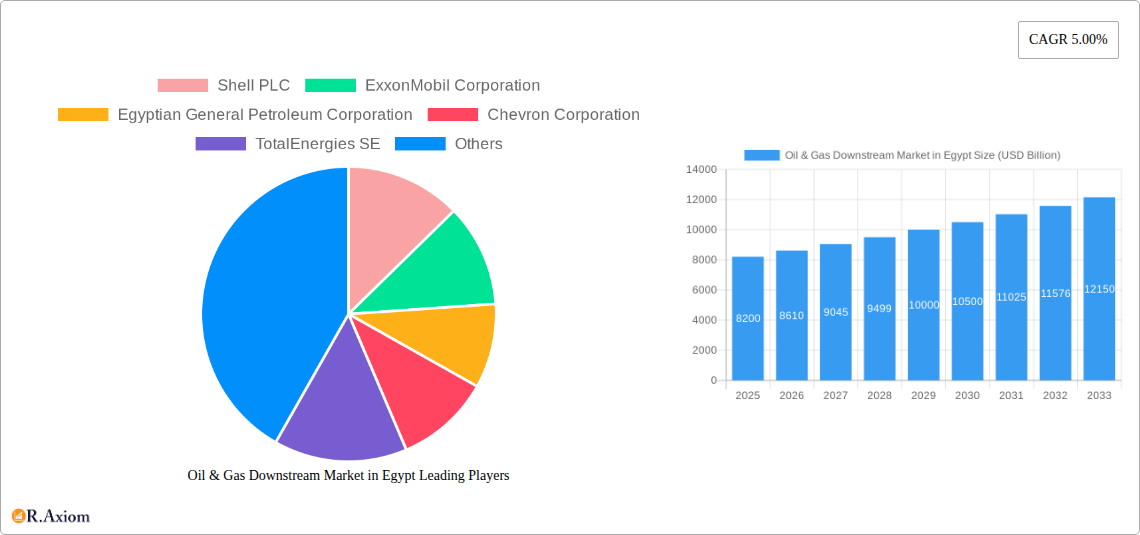
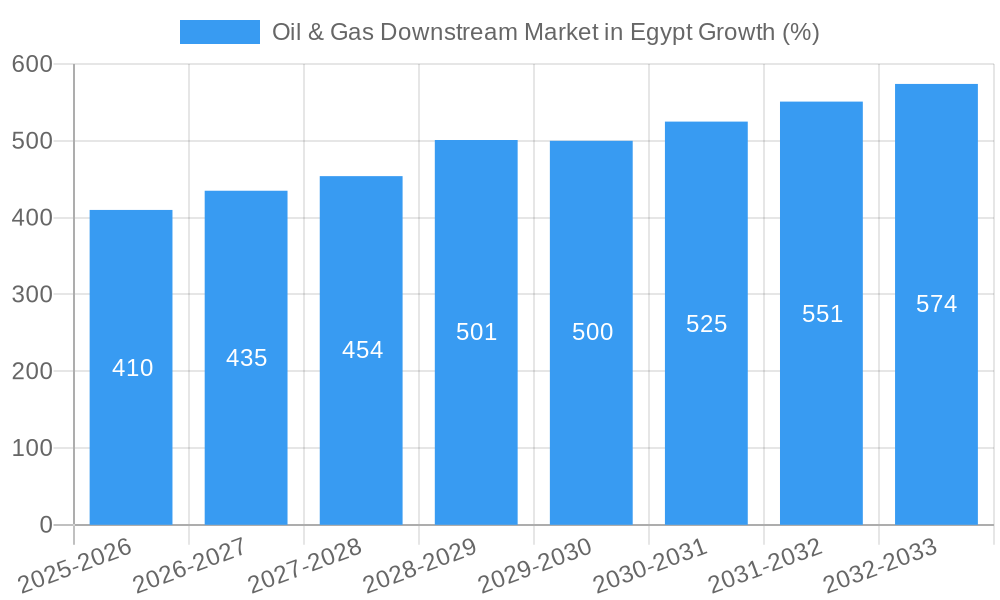
The Egyptian oil and gas downstream market, valued at $8.2 billion in 2025, is projected to experience robust growth, driven by increasing domestic energy demand and strategic investments in refinery modernization and petrochemical expansion. A compound annual growth rate (CAGR) of 5% from 2025 to 2033 indicates a significant market expansion over the forecast period. Key drivers include Egypt's growing population and industrialization, necessitating a larger energy supply. Government initiatives focused on enhancing energy infrastructure and attracting foreign investment further stimulate market growth. The market is segmented into refineries and petrochemical plants, with significant contributions from major players like Shell, ExxonMobil, and TotalEnergies, alongside Egyptian state-owned entities. While challenges such as fluctuating global crude oil prices and potential supply chain disruptions exist, the long-term outlook remains positive, fueled by ongoing infrastructure development and the nation's commitment to energy security. The increasing focus on petrochemical production suggests a diversification strategy beyond refined petroleum products, contributing to a more resilient and dynamic market in the coming years.
The presence of established international oil companies alongside strong domestic players indicates a healthy competitive landscape. However, future market success hinges on effective management of environmental concerns and the integration of sustainable practices within the industry. Further investments in research and development, particularly in advanced refining technologies and cleaner energy sources, will be crucial for sustained growth and alignment with global sustainability objectives. Continuous improvement in operational efficiency, technological innovation, and strategic partnerships will play a key role in navigating potential market fluctuations and maximizing long-term profitability in the Egyptian oil and gas downstream sector.
Oil & Gas Downstream Market in Egypt: A Comprehensive Report (2019-2033)
This in-depth report provides a comprehensive analysis of Egypt's oil & gas downstream market, offering crucial insights for investors, industry stakeholders, and strategic decision-makers. The study covers the period from 2019 to 2033, with a focus on the forecast period of 2025-2033 and a base year of 2025. The report utilizes USD Billion for all value estimations.
Oil & Gas Downstream Market in Egypt: Market Concentration & Innovation
This section analyzes the competitive landscape, innovation drivers, and regulatory aspects of Egypt's oil & gas downstream sector. We delve into market concentration metrics, including market share data for key players like Shell PLC, ExxonMobil Corporation, Egyptian General Petroleum Corporation, Chevron Corporation, TotalEnergies SE, Egyptian Petrochemical Holdings Company, BP PLC, Eni SpA, Apache Corporation, and Egyptian Natural Gas Holding Company (EGAS). The analysis also encompasses M&A activity, including deal values and their impact on market consolidation. We examine the influence of regulatory frameworks, the presence of product substitutes, evolving end-user trends, and the role of innovation in shaping the market's trajectory. The report quantifies market share for major players, providing a clear picture of the competitive dynamics. Specific examples of recent M&A deals and their financial implications are included, providing context to the overall market concentration. Analysis of the regulatory environment highlights its influence on market behavior and future projections. The presence and impact of substitute products are detailed, along with an analysis of evolving end-user demands.
Oil & Gas Downstream Market in Egypt: Industry Trends & Insights
This section presents a detailed overview of the key trends and insights shaping the Egyptian oil & gas downstream market. We examine market growth drivers, including factors like increasing energy demand, government initiatives, and infrastructure development. The impact of technological advancements, such as automation and process optimization, is analyzed. We also explore how consumer preferences are influencing market dynamics, and the role of competitive dynamics in shaping the market’s trajectory. The analysis incorporates specific metrics, such as the Compound Annual Growth Rate (CAGR) and market penetration rates, providing quantifiable insights into market growth and performance. We also analyze the competitive landscape, examining the strategies employed by various players to enhance market share and gain a competitive edge. The influence of macroeconomic factors and potential disruption risks are considered in this comprehensive analysis, presenting a balanced picture of the industry's evolution. We also provide specific examples of technology disruption and quantify their impact on the market using relevant data.
Dominant Markets & Segments in Oil & Gas Downstream Market in Egypt
This section identifies the dominant segments within Egypt's oil & gas downstream market, focusing on refineries and petrochemical plants.
Refineries:
- Market Overview: The Egyptian refinery market is characterized by [Describe market size in USD Billion for 2025 and projected size for 2033].
- Key Project Information: [List key refinery projects, including capacity, location, and expected completion dates]. Examples include the expansion of existing refineries and the development of new facilities.
Petrochemical Plants:
- Market Overview: The petrochemical market in Egypt shows significant growth potential, driven by [Describe market size in USD Billion for 2025 and projected size for 2033].
- Key Project Information: [List key petrochemical projects, including capacity, location, and expected completion dates]. This will include the planned USD 2 billion petrochemicals complex in the Suez Canal Economic Zone.
Dominance Analysis: The report identifies the leading region or segment based on factors such as production capacity, investment levels, and market share. Key drivers contributing to the dominance of specific regions or segments are analyzed through detailed paragraphs, including economic policies, infrastructure development, access to resources, and regulatory frameworks.
Oil & Gas Downstream Market in Egypt: Product Developments
Recent product developments in Egypt's oil & gas downstream sector focus on higher-value products, improved efficiency, and sustainability. This includes advancements in refining technologies to maximize yields of valuable petrochemical feedstocks. The market is witnessing a shift towards cleaner fuels and environmentally friendly technologies. New product applications are emerging, catering to growing demand in various sectors. Competitive advantages are increasingly driven by technological innovation and cost efficiency, with companies striving to optimize processes and reduce their carbon footprint.
Report Scope & Segmentation Analysis
This report segments the Egyptian oil & gas downstream market along several key dimensions: by product type (refined petroleum products, petrochemicals, etc.), by geographic location (e.g., specific regions within Egypt), and by company type (national vs. international). Each segment's growth projections, market size (in USD Billion), and competitive dynamics are presented. Growth projections will include specific CAGR values for the forecast period, and competitive dynamics will be analyzed based on market share and competitive strategies.
Key Drivers of Oil & Gas Downstream Market in Egypt Growth
The growth of Egypt's oil & gas downstream market is propelled by several key factors: increasing domestic energy demand fueled by population growth and economic expansion; government initiatives promoting infrastructure development and attracting foreign investment; ongoing projects to expand refining and petrochemical capacity; and increasing demand from neighboring countries.
Challenges in the Oil & Gas Downstream Market in Egypt Sector
The Egyptian oil & gas downstream sector faces challenges such as the volatility of global oil prices impacting profitability; infrastructure limitations hindering efficient transportation and distribution; and regulatory complexities potentially slowing down project development. These challenges may impose constraints on projected market growth, especially during periods of economic uncertainty.
Emerging Opportunities in Oil & Gas Downstream Market in Egypt
Emerging opportunities include expansion into new product segments, leveraging technological advancements to improve efficiency and reduce emissions, and capitalizing on increasing regional demand. The development of downstream infrastructure and the integration of renewable energy sources present significant opportunities for growth.
Leading Players in the Oil & Gas Downstream Market in Egypt Market
- Shell PLC
- ExxonMobil Corporation
- Egyptian General Petroleum Corporation
- Chevron Corporation
- TotalEnergies SE
- Egyptian Petrochemical Holdings Company
- BP PLC
- Eni SpA
- Apache Corporation
- Egyptian Natural Gas Holding Company (EGAS)
Key Developments in Oil & Gas Downstream Market in Egypt Industry
- August 2022: Anchorage Investments shortlisted Hyundai, Samsung, Tecnicas Reunidas, and Technip Energies to construct a USD 2 billion petrochemicals complex in the Suez Canal Economic Zone. This development significantly boosts the petrochemical sector's growth potential.
- September 2022: Egyptian Petrochemicals Holding Company (ECHEM) announced that Petrojet, ENPPI, and Bechtel are working on the FEED for a refinery-cum-petrochemical complex in the Suez Canal Corridor. This project signifies a major expansion in integrated refining and petrochemical capabilities.
Strategic Outlook for Oil & Gas Downstream Market in Egypt Market
The Egyptian oil & gas downstream market presents significant long-term growth potential, driven by robust domestic demand, government support, and ongoing infrastructure investments. The strategic focus on developing downstream capacity, attracting foreign investment, and embracing technological advancements will shape the market’s future trajectory. The market is expected to continue its expansion, driven by strong economic growth and a rising middle class. Further diversification into petrochemicals and specialized products will be key to realizing the sector’s full potential.
Oil & Gas Downstream Market in Egypt Segmentation
-
1. Refineries
- 1.1. Market Overview
- 1.2. Key Project Information
-
2. Petrochemical Pants
- 2.1. Market Overview
- 2.2. Key Project Information
Oil & Gas Downstream Market in Egypt Segmentation By Geography
-
1. North America
- 1.1. United States
- 1.2. Canada
- 1.3. Mexico
-
2. South America
- 2.1. Brazil
- 2.2. Argentina
- 2.3. Rest of South America
-
3. Europe
- 3.1. United Kingdom
- 3.2. Germany
- 3.3. France
- 3.4. Italy
- 3.5. Spain
- 3.6. Russia
- 3.7. Benelux
- 3.8. Nordics
- 3.9. Rest of Europe
-
4. Middle East & Africa
- 4.1. Turkey
- 4.2. Israel
- 4.3. GCC
- 4.4. North Africa
- 4.5. South Africa
- 4.6. Rest of Middle East & Africa
-
5. Asia Pacific
- 5.1. China
- 5.2. India
- 5.3. Japan
- 5.4. South Korea
- 5.5. ASEAN
- 5.6. Oceania
- 5.7. Rest of Asia Pacific
Oil & Gas Downstream Market in Egypt REPORT HIGHLIGHTS
| Aspects | Details |
|---|---|
| Study Period | 2019-2033 |
| Base Year | 2024 |
| Estimated Year | 2025 |
| Forecast Period | 2025-2033 |
| Historical Period | 2019-2024 |
| Growth Rate | CAGR of 5.00% from 2019-2033 |
| Segmentation |
|
Table of Contents
- 1. Introduction
- 1.1. Research Scope
- 1.2. Market Segmentation
- 1.3. Research Methodology
- 1.4. Definitions and Assumptions
- 2. Executive Summary
- 2.1. Introduction
- 3. Market Dynamics
- 3.1. Introduction
- 3.2. Market Drivers
- 3.2.1. 4.; Increasing Power Demand4.; Increasing Penetration of Renewable Energy
- 3.3. Market Restrains
- 3.3.1. 4.; Inadequate Infrastructure in the Country
- 3.4. Market Trends
- 3.4.1. Refineries to Dominate the Market
- 4. Market Factor Analysis
- 4.1. Porters Five Forces
- 4.2. Supply/Value Chain
- 4.3. PESTEL analysis
- 4.4. Market Entropy
- 4.5. Patent/Trademark Analysis
- 5. Global Oil & Gas Downstream Market in Egypt Analysis, Insights and Forecast, 2019-2031
- 5.1. Market Analysis, Insights and Forecast - by Refineries
- 5.1.1. Market Overview
- 5.1.2. Key Project Information
- 5.2. Market Analysis, Insights and Forecast - by Petrochemical Pants
- 5.2.1. Market Overview
- 5.2.2. Key Project Information
- 5.3. Market Analysis, Insights and Forecast - by Region
- 5.3.1. North America
- 5.3.2. South America
- 5.3.3. Europe
- 5.3.4. Middle East & Africa
- 5.3.5. Asia Pacific
- 5.1. Market Analysis, Insights and Forecast - by Refineries
- 6. North America Oil & Gas Downstream Market in Egypt Analysis, Insights and Forecast, 2019-2031
- 6.1. Market Analysis, Insights and Forecast - by Refineries
- 6.1.1. Market Overview
- 6.1.2. Key Project Information
- 6.2. Market Analysis, Insights and Forecast - by Petrochemical Pants
- 6.2.1. Market Overview
- 6.2.2. Key Project Information
- 6.1. Market Analysis, Insights and Forecast - by Refineries
- 7. South America Oil & Gas Downstream Market in Egypt Analysis, Insights and Forecast, 2019-2031
- 7.1. Market Analysis, Insights and Forecast - by Refineries
- 7.1.1. Market Overview
- 7.1.2. Key Project Information
- 7.2. Market Analysis, Insights and Forecast - by Petrochemical Pants
- 7.2.1. Market Overview
- 7.2.2. Key Project Information
- 7.1. Market Analysis, Insights and Forecast - by Refineries
- 8. Europe Oil & Gas Downstream Market in Egypt Analysis, Insights and Forecast, 2019-2031
- 8.1. Market Analysis, Insights and Forecast - by Refineries
- 8.1.1. Market Overview
- 8.1.2. Key Project Information
- 8.2. Market Analysis, Insights and Forecast - by Petrochemical Pants
- 8.2.1. Market Overview
- 8.2.2. Key Project Information
- 8.1. Market Analysis, Insights and Forecast - by Refineries
- 9. Middle East & Africa Oil & Gas Downstream Market in Egypt Analysis, Insights and Forecast, 2019-2031
- 9.1. Market Analysis, Insights and Forecast - by Refineries
- 9.1.1. Market Overview
- 9.1.2. Key Project Information
- 9.2. Market Analysis, Insights and Forecast - by Petrochemical Pants
- 9.2.1. Market Overview
- 9.2.2. Key Project Information
- 9.1. Market Analysis, Insights and Forecast - by Refineries
- 10. Asia Pacific Oil & Gas Downstream Market in Egypt Analysis, Insights and Forecast, 2019-2031
- 10.1. Market Analysis, Insights and Forecast - by Refineries
- 10.1.1. Market Overview
- 10.1.2. Key Project Information
- 10.2. Market Analysis, Insights and Forecast - by Petrochemical Pants
- 10.2.1. Market Overview
- 10.2.2. Key Project Information
- 10.1. Market Analysis, Insights and Forecast - by Refineries
- 11. Competitive Analysis
- 11.1. Global Market Share Analysis 2024
- 11.2. Company Profiles
- 11.2.1 Shell PLC
- 11.2.1.1. Overview
- 11.2.1.2. Products
- 11.2.1.3. SWOT Analysis
- 11.2.1.4. Recent Developments
- 11.2.1.5. Financials (Based on Availability)
- 11.2.2 ExxonMobil Corporation
- 11.2.2.1. Overview
- 11.2.2.2. Products
- 11.2.2.3. SWOT Analysis
- 11.2.2.4. Recent Developments
- 11.2.2.5. Financials (Based on Availability)
- 11.2.3 Egyptian General Petroleum Corporation
- 11.2.3.1. Overview
- 11.2.3.2. Products
- 11.2.3.3. SWOT Analysis
- 11.2.3.4. Recent Developments
- 11.2.3.5. Financials (Based on Availability)
- 11.2.4 Chevron Corporation
- 11.2.4.1. Overview
- 11.2.4.2. Products
- 11.2.4.3. SWOT Analysis
- 11.2.4.4. Recent Developments
- 11.2.4.5. Financials (Based on Availability)
- 11.2.5 TotalEnergies SE
- 11.2.5.1. Overview
- 11.2.5.2. Products
- 11.2.5.3. SWOT Analysis
- 11.2.5.4. Recent Developments
- 11.2.5.5. Financials (Based on Availability)
- 11.2.6 Egyptian Petrochemical Holdings Company*List Not Exhaustive
- 11.2.6.1. Overview
- 11.2.6.2. Products
- 11.2.6.3. SWOT Analysis
- 11.2.6.4. Recent Developments
- 11.2.6.5. Financials (Based on Availability)
- 11.2.7 BP PLC
- 11.2.7.1. Overview
- 11.2.7.2. Products
- 11.2.7.3. SWOT Analysis
- 11.2.7.4. Recent Developments
- 11.2.7.5. Financials (Based on Availability)
- 11.2.8 Eni SpA
- 11.2.8.1. Overview
- 11.2.8.2. Products
- 11.2.8.3. SWOT Analysis
- 11.2.8.4. Recent Developments
- 11.2.8.5. Financials (Based on Availability)
- 11.2.9 Apache Corporation
- 11.2.9.1. Overview
- 11.2.9.2. Products
- 11.2.9.3. SWOT Analysis
- 11.2.9.4. Recent Developments
- 11.2.9.5. Financials (Based on Availability)
- 11.2.10 Egyptian Natural Gas Holding Company (EGAS)
- 11.2.10.1. Overview
- 11.2.10.2. Products
- 11.2.10.3. SWOT Analysis
- 11.2.10.4. Recent Developments
- 11.2.10.5. Financials (Based on Availability)
- 11.2.1 Shell PLC
List of Figures
- Figure 1: Global Oil & Gas Downstream Market in Egypt Revenue Breakdown (USD Billion, %) by Region 2024 & 2032
- Figure 2: Global Oil & Gas Downstream Market in Egypt Volume Breakdown (K Tons, %) by Region 2024 & 2032
- Figure 3: Egypt Oil & Gas Downstream Market in Egypt Revenue (USD Billion), by Country 2024 & 2032
- Figure 4: Egypt Oil & Gas Downstream Market in Egypt Volume (K Tons), by Country 2024 & 2032
- Figure 5: Egypt Oil & Gas Downstream Market in Egypt Revenue Share (%), by Country 2024 & 2032
- Figure 6: Egypt Oil & Gas Downstream Market in Egypt Volume Share (%), by Country 2024 & 2032
- Figure 7: North America Oil & Gas Downstream Market in Egypt Revenue (USD Billion), by Refineries 2024 & 2032
- Figure 8: North America Oil & Gas Downstream Market in Egypt Volume (K Tons), by Refineries 2024 & 2032
- Figure 9: North America Oil & Gas Downstream Market in Egypt Revenue Share (%), by Refineries 2024 & 2032
- Figure 10: North America Oil & Gas Downstream Market in Egypt Volume Share (%), by Refineries 2024 & 2032
- Figure 11: North America Oil & Gas Downstream Market in Egypt Revenue (USD Billion), by Petrochemical Pants 2024 & 2032
- Figure 12: North America Oil & Gas Downstream Market in Egypt Volume (K Tons), by Petrochemical Pants 2024 & 2032
- Figure 13: North America Oil & Gas Downstream Market in Egypt Revenue Share (%), by Petrochemical Pants 2024 & 2032
- Figure 14: North America Oil & Gas Downstream Market in Egypt Volume Share (%), by Petrochemical Pants 2024 & 2032
- Figure 15: North America Oil & Gas Downstream Market in Egypt Revenue (USD Billion), by Country 2024 & 2032
- Figure 16: North America Oil & Gas Downstream Market in Egypt Volume (K Tons), by Country 2024 & 2032
- Figure 17: North America Oil & Gas Downstream Market in Egypt Revenue Share (%), by Country 2024 & 2032
- Figure 18: North America Oil & Gas Downstream Market in Egypt Volume Share (%), by Country 2024 & 2032
- Figure 19: South America Oil & Gas Downstream Market in Egypt Revenue (USD Billion), by Refineries 2024 & 2032
- Figure 20: South America Oil & Gas Downstream Market in Egypt Volume (K Tons), by Refineries 2024 & 2032
- Figure 21: South America Oil & Gas Downstream Market in Egypt Revenue Share (%), by Refineries 2024 & 2032
- Figure 22: South America Oil & Gas Downstream Market in Egypt Volume Share (%), by Refineries 2024 & 2032
- Figure 23: South America Oil & Gas Downstream Market in Egypt Revenue (USD Billion), by Petrochemical Pants 2024 & 2032
- Figure 24: South America Oil & Gas Downstream Market in Egypt Volume (K Tons), by Petrochemical Pants 2024 & 2032
- Figure 25: South America Oil & Gas Downstream Market in Egypt Revenue Share (%), by Petrochemical Pants 2024 & 2032
- Figure 26: South America Oil & Gas Downstream Market in Egypt Volume Share (%), by Petrochemical Pants 2024 & 2032
- Figure 27: South America Oil & Gas Downstream Market in Egypt Revenue (USD Billion), by Country 2024 & 2032
- Figure 28: South America Oil & Gas Downstream Market in Egypt Volume (K Tons), by Country 2024 & 2032
- Figure 29: South America Oil & Gas Downstream Market in Egypt Revenue Share (%), by Country 2024 & 2032
- Figure 30: South America Oil & Gas Downstream Market in Egypt Volume Share (%), by Country 2024 & 2032
- Figure 31: Europe Oil & Gas Downstream Market in Egypt Revenue (USD Billion), by Refineries 2024 & 2032
- Figure 32: Europe Oil & Gas Downstream Market in Egypt Volume (K Tons), by Refineries 2024 & 2032
- Figure 33: Europe Oil & Gas Downstream Market in Egypt Revenue Share (%), by Refineries 2024 & 2032
- Figure 34: Europe Oil & Gas Downstream Market in Egypt Volume Share (%), by Refineries 2024 & 2032
- Figure 35: Europe Oil & Gas Downstream Market in Egypt Revenue (USD Billion), by Petrochemical Pants 2024 & 2032
- Figure 36: Europe Oil & Gas Downstream Market in Egypt Volume (K Tons), by Petrochemical Pants 2024 & 2032
- Figure 37: Europe Oil & Gas Downstream Market in Egypt Revenue Share (%), by Petrochemical Pants 2024 & 2032
- Figure 38: Europe Oil & Gas Downstream Market in Egypt Volume Share (%), by Petrochemical Pants 2024 & 2032
- Figure 39: Europe Oil & Gas Downstream Market in Egypt Revenue (USD Billion), by Country 2024 & 2032
- Figure 40: Europe Oil & Gas Downstream Market in Egypt Volume (K Tons), by Country 2024 & 2032
- Figure 41: Europe Oil & Gas Downstream Market in Egypt Revenue Share (%), by Country 2024 & 2032
- Figure 42: Europe Oil & Gas Downstream Market in Egypt Volume Share (%), by Country 2024 & 2032
- Figure 43: Middle East & Africa Oil & Gas Downstream Market in Egypt Revenue (USD Billion), by Refineries 2024 & 2032
- Figure 44: Middle East & Africa Oil & Gas Downstream Market in Egypt Volume (K Tons), by Refineries 2024 & 2032
- Figure 45: Middle East & Africa Oil & Gas Downstream Market in Egypt Revenue Share (%), by Refineries 2024 & 2032
- Figure 46: Middle East & Africa Oil & Gas Downstream Market in Egypt Volume Share (%), by Refineries 2024 & 2032
- Figure 47: Middle East & Africa Oil & Gas Downstream Market in Egypt Revenue (USD Billion), by Petrochemical Pants 2024 & 2032
- Figure 48: Middle East & Africa Oil & Gas Downstream Market in Egypt Volume (K Tons), by Petrochemical Pants 2024 & 2032
- Figure 49: Middle East & Africa Oil & Gas Downstream Market in Egypt Revenue Share (%), by Petrochemical Pants 2024 & 2032
- Figure 50: Middle East & Africa Oil & Gas Downstream Market in Egypt Volume Share (%), by Petrochemical Pants 2024 & 2032
- Figure 51: Middle East & Africa Oil & Gas Downstream Market in Egypt Revenue (USD Billion), by Country 2024 & 2032
- Figure 52: Middle East & Africa Oil & Gas Downstream Market in Egypt Volume (K Tons), by Country 2024 & 2032
- Figure 53: Middle East & Africa Oil & Gas Downstream Market in Egypt Revenue Share (%), by Country 2024 & 2032
- Figure 54: Middle East & Africa Oil & Gas Downstream Market in Egypt Volume Share (%), by Country 2024 & 2032
- Figure 55: Asia Pacific Oil & Gas Downstream Market in Egypt Revenue (USD Billion), by Refineries 2024 & 2032
- Figure 56: Asia Pacific Oil & Gas Downstream Market in Egypt Volume (K Tons), by Refineries 2024 & 2032
- Figure 57: Asia Pacific Oil & Gas Downstream Market in Egypt Revenue Share (%), by Refineries 2024 & 2032
- Figure 58: Asia Pacific Oil & Gas Downstream Market in Egypt Volume Share (%), by Refineries 2024 & 2032
- Figure 59: Asia Pacific Oil & Gas Downstream Market in Egypt Revenue (USD Billion), by Petrochemical Pants 2024 & 2032
- Figure 60: Asia Pacific Oil & Gas Downstream Market in Egypt Volume (K Tons), by Petrochemical Pants 2024 & 2032
- Figure 61: Asia Pacific Oil & Gas Downstream Market in Egypt Revenue Share (%), by Petrochemical Pants 2024 & 2032
- Figure 62: Asia Pacific Oil & Gas Downstream Market in Egypt Volume Share (%), by Petrochemical Pants 2024 & 2032
- Figure 63: Asia Pacific Oil & Gas Downstream Market in Egypt Revenue (USD Billion), by Country 2024 & 2032
- Figure 64: Asia Pacific Oil & Gas Downstream Market in Egypt Volume (K Tons), by Country 2024 & 2032
- Figure 65: Asia Pacific Oil & Gas Downstream Market in Egypt Revenue Share (%), by Country 2024 & 2032
- Figure 66: Asia Pacific Oil & Gas Downstream Market in Egypt Volume Share (%), by Country 2024 & 2032
List of Tables
- Table 1: Global Oil & Gas Downstream Market in Egypt Revenue USD Billion Forecast, by Region 2019 & 2032
- Table 2: Global Oil & Gas Downstream Market in Egypt Volume K Tons Forecast, by Region 2019 & 2032
- Table 3: Global Oil & Gas Downstream Market in Egypt Revenue USD Billion Forecast, by Refineries 2019 & 2032
- Table 4: Global Oil & Gas Downstream Market in Egypt Volume K Tons Forecast, by Refineries 2019 & 2032
- Table 5: Global Oil & Gas Downstream Market in Egypt Revenue USD Billion Forecast, by Petrochemical Pants 2019 & 2032
- Table 6: Global Oil & Gas Downstream Market in Egypt Volume K Tons Forecast, by Petrochemical Pants 2019 & 2032
- Table 7: Global Oil & Gas Downstream Market in Egypt Revenue USD Billion Forecast, by Region 2019 & 2032
- Table 8: Global Oil & Gas Downstream Market in Egypt Volume K Tons Forecast, by Region 2019 & 2032
- Table 9: Global Oil & Gas Downstream Market in Egypt Revenue USD Billion Forecast, by Country 2019 & 2032
- Table 10: Global Oil & Gas Downstream Market in Egypt Volume K Tons Forecast, by Country 2019 & 2032
- Table 11: Global Oil & Gas Downstream Market in Egypt Revenue USD Billion Forecast, by Refineries 2019 & 2032
- Table 12: Global Oil & Gas Downstream Market in Egypt Volume K Tons Forecast, by Refineries 2019 & 2032
- Table 13: Global Oil & Gas Downstream Market in Egypt Revenue USD Billion Forecast, by Petrochemical Pants 2019 & 2032
- Table 14: Global Oil & Gas Downstream Market in Egypt Volume K Tons Forecast, by Petrochemical Pants 2019 & 2032
- Table 15: Global Oil & Gas Downstream Market in Egypt Revenue USD Billion Forecast, by Country 2019 & 2032
- Table 16: Global Oil & Gas Downstream Market in Egypt Volume K Tons Forecast, by Country 2019 & 2032
- Table 17: United States Oil & Gas Downstream Market in Egypt Revenue (USD Billion) Forecast, by Application 2019 & 2032
- Table 18: United States Oil & Gas Downstream Market in Egypt Volume (K Tons) Forecast, by Application 2019 & 2032
- Table 19: Canada Oil & Gas Downstream Market in Egypt Revenue (USD Billion) Forecast, by Application 2019 & 2032
- Table 20: Canada Oil & Gas Downstream Market in Egypt Volume (K Tons) Forecast, by Application 2019 & 2032
- Table 21: Mexico Oil & Gas Downstream Market in Egypt Revenue (USD Billion) Forecast, by Application 2019 & 2032
- Table 22: Mexico Oil & Gas Downstream Market in Egypt Volume (K Tons) Forecast, by Application 2019 & 2032
- Table 23: Global Oil & Gas Downstream Market in Egypt Revenue USD Billion Forecast, by Refineries 2019 & 2032
- Table 24: Global Oil & Gas Downstream Market in Egypt Volume K Tons Forecast, by Refineries 2019 & 2032
- Table 25: Global Oil & Gas Downstream Market in Egypt Revenue USD Billion Forecast, by Petrochemical Pants 2019 & 2032
- Table 26: Global Oil & Gas Downstream Market in Egypt Volume K Tons Forecast, by Petrochemical Pants 2019 & 2032
- Table 27: Global Oil & Gas Downstream Market in Egypt Revenue USD Billion Forecast, by Country 2019 & 2032
- Table 28: Global Oil & Gas Downstream Market in Egypt Volume K Tons Forecast, by Country 2019 & 2032
- Table 29: Brazil Oil & Gas Downstream Market in Egypt Revenue (USD Billion) Forecast, by Application 2019 & 2032
- Table 30: Brazil Oil & Gas Downstream Market in Egypt Volume (K Tons) Forecast, by Application 2019 & 2032
- Table 31: Argentina Oil & Gas Downstream Market in Egypt Revenue (USD Billion) Forecast, by Application 2019 & 2032
- Table 32: Argentina Oil & Gas Downstream Market in Egypt Volume (K Tons) Forecast, by Application 2019 & 2032
- Table 33: Rest of South America Oil & Gas Downstream Market in Egypt Revenue (USD Billion) Forecast, by Application 2019 & 2032
- Table 34: Rest of South America Oil & Gas Downstream Market in Egypt Volume (K Tons) Forecast, by Application 2019 & 2032
- Table 35: Global Oil & Gas Downstream Market in Egypt Revenue USD Billion Forecast, by Refineries 2019 & 2032
- Table 36: Global Oil & Gas Downstream Market in Egypt Volume K Tons Forecast, by Refineries 2019 & 2032
- Table 37: Global Oil & Gas Downstream Market in Egypt Revenue USD Billion Forecast, by Petrochemical Pants 2019 & 2032
- Table 38: Global Oil & Gas Downstream Market in Egypt Volume K Tons Forecast, by Petrochemical Pants 2019 & 2032
- Table 39: Global Oil & Gas Downstream Market in Egypt Revenue USD Billion Forecast, by Country 2019 & 2032
- Table 40: Global Oil & Gas Downstream Market in Egypt Volume K Tons Forecast, by Country 2019 & 2032
- Table 41: United Kingdom Oil & Gas Downstream Market in Egypt Revenue (USD Billion) Forecast, by Application 2019 & 2032
- Table 42: United Kingdom Oil & Gas Downstream Market in Egypt Volume (K Tons) Forecast, by Application 2019 & 2032
- Table 43: Germany Oil & Gas Downstream Market in Egypt Revenue (USD Billion) Forecast, by Application 2019 & 2032
- Table 44: Germany Oil & Gas Downstream Market in Egypt Volume (K Tons) Forecast, by Application 2019 & 2032
- Table 45: France Oil & Gas Downstream Market in Egypt Revenue (USD Billion) Forecast, by Application 2019 & 2032
- Table 46: France Oil & Gas Downstream Market in Egypt Volume (K Tons) Forecast, by Application 2019 & 2032
- Table 47: Italy Oil & Gas Downstream Market in Egypt Revenue (USD Billion) Forecast, by Application 2019 & 2032
- Table 48: Italy Oil & Gas Downstream Market in Egypt Volume (K Tons) Forecast, by Application 2019 & 2032
- Table 49: Spain Oil & Gas Downstream Market in Egypt Revenue (USD Billion) Forecast, by Application 2019 & 2032
- Table 50: Spain Oil & Gas Downstream Market in Egypt Volume (K Tons) Forecast, by Application 2019 & 2032
- Table 51: Russia Oil & Gas Downstream Market in Egypt Revenue (USD Billion) Forecast, by Application 2019 & 2032
- Table 52: Russia Oil & Gas Downstream Market in Egypt Volume (K Tons) Forecast, by Application 2019 & 2032
- Table 53: Benelux Oil & Gas Downstream Market in Egypt Revenue (USD Billion) Forecast, by Application 2019 & 2032
- Table 54: Benelux Oil & Gas Downstream Market in Egypt Volume (K Tons) Forecast, by Application 2019 & 2032
- Table 55: Nordics Oil & Gas Downstream Market in Egypt Revenue (USD Billion) Forecast, by Application 2019 & 2032
- Table 56: Nordics Oil & Gas Downstream Market in Egypt Volume (K Tons) Forecast, by Application 2019 & 2032
- Table 57: Rest of Europe Oil & Gas Downstream Market in Egypt Revenue (USD Billion) Forecast, by Application 2019 & 2032
- Table 58: Rest of Europe Oil & Gas Downstream Market in Egypt Volume (K Tons) Forecast, by Application 2019 & 2032
- Table 59: Global Oil & Gas Downstream Market in Egypt Revenue USD Billion Forecast, by Refineries 2019 & 2032
- Table 60: Global Oil & Gas Downstream Market in Egypt Volume K Tons Forecast, by Refineries 2019 & 2032
- Table 61: Global Oil & Gas Downstream Market in Egypt Revenue USD Billion Forecast, by Petrochemical Pants 2019 & 2032
- Table 62: Global Oil & Gas Downstream Market in Egypt Volume K Tons Forecast, by Petrochemical Pants 2019 & 2032
- Table 63: Global Oil & Gas Downstream Market in Egypt Revenue USD Billion Forecast, by Country 2019 & 2032
- Table 64: Global Oil & Gas Downstream Market in Egypt Volume K Tons Forecast, by Country 2019 & 2032
- Table 65: Turkey Oil & Gas Downstream Market in Egypt Revenue (USD Billion) Forecast, by Application 2019 & 2032
- Table 66: Turkey Oil & Gas Downstream Market in Egypt Volume (K Tons) Forecast, by Application 2019 & 2032
- Table 67: Israel Oil & Gas Downstream Market in Egypt Revenue (USD Billion) Forecast, by Application 2019 & 2032
- Table 68: Israel Oil & Gas Downstream Market in Egypt Volume (K Tons) Forecast, by Application 2019 & 2032
- Table 69: GCC Oil & Gas Downstream Market in Egypt Revenue (USD Billion) Forecast, by Application 2019 & 2032
- Table 70: GCC Oil & Gas Downstream Market in Egypt Volume (K Tons) Forecast, by Application 2019 & 2032
- Table 71: North Africa Oil & Gas Downstream Market in Egypt Revenue (USD Billion) Forecast, by Application 2019 & 2032
- Table 72: North Africa Oil & Gas Downstream Market in Egypt Volume (K Tons) Forecast, by Application 2019 & 2032
- Table 73: South Africa Oil & Gas Downstream Market in Egypt Revenue (USD Billion) Forecast, by Application 2019 & 2032
- Table 74: South Africa Oil & Gas Downstream Market in Egypt Volume (K Tons) Forecast, by Application 2019 & 2032
- Table 75: Rest of Middle East & Africa Oil & Gas Downstream Market in Egypt Revenue (USD Billion) Forecast, by Application 2019 & 2032
- Table 76: Rest of Middle East & Africa Oil & Gas Downstream Market in Egypt Volume (K Tons) Forecast, by Application 2019 & 2032
- Table 77: Global Oil & Gas Downstream Market in Egypt Revenue USD Billion Forecast, by Refineries 2019 & 2032
- Table 78: Global Oil & Gas Downstream Market in Egypt Volume K Tons Forecast, by Refineries 2019 & 2032
- Table 79: Global Oil & Gas Downstream Market in Egypt Revenue USD Billion Forecast, by Petrochemical Pants 2019 & 2032
- Table 80: Global Oil & Gas Downstream Market in Egypt Volume K Tons Forecast, by Petrochemical Pants 2019 & 2032
- Table 81: Global Oil & Gas Downstream Market in Egypt Revenue USD Billion Forecast, by Country 2019 & 2032
- Table 82: Global Oil & Gas Downstream Market in Egypt Volume K Tons Forecast, by Country 2019 & 2032
- Table 83: China Oil & Gas Downstream Market in Egypt Revenue (USD Billion) Forecast, by Application 2019 & 2032
- Table 84: China Oil & Gas Downstream Market in Egypt Volume (K Tons) Forecast, by Application 2019 & 2032
- Table 85: India Oil & Gas Downstream Market in Egypt Revenue (USD Billion) Forecast, by Application 2019 & 2032
- Table 86: India Oil & Gas Downstream Market in Egypt Volume (K Tons) Forecast, by Application 2019 & 2032
- Table 87: Japan Oil & Gas Downstream Market in Egypt Revenue (USD Billion) Forecast, by Application 2019 & 2032
- Table 88: Japan Oil & Gas Downstream Market in Egypt Volume (K Tons) Forecast, by Application 2019 & 2032
- Table 89: South Korea Oil & Gas Downstream Market in Egypt Revenue (USD Billion) Forecast, by Application 2019 & 2032
- Table 90: South Korea Oil & Gas Downstream Market in Egypt Volume (K Tons) Forecast, by Application 2019 & 2032
- Table 91: ASEAN Oil & Gas Downstream Market in Egypt Revenue (USD Billion) Forecast, by Application 2019 & 2032
- Table 92: ASEAN Oil & Gas Downstream Market in Egypt Volume (K Tons) Forecast, by Application 2019 & 2032
- Table 93: Oceania Oil & Gas Downstream Market in Egypt Revenue (USD Billion) Forecast, by Application 2019 & 2032
- Table 94: Oceania Oil & Gas Downstream Market in Egypt Volume (K Tons) Forecast, by Application 2019 & 2032
- Table 95: Rest of Asia Pacific Oil & Gas Downstream Market in Egypt Revenue (USD Billion) Forecast, by Application 2019 & 2032
- Table 96: Rest of Asia Pacific Oil & Gas Downstream Market in Egypt Volume (K Tons) Forecast, by Application 2019 & 2032
Frequently Asked Questions
1. What is the projected Compound Annual Growth Rate (CAGR) of the Oil & Gas Downstream Market in Egypt?
The projected CAGR is approximately 5.00%.
2. Which companies are prominent players in the Oil & Gas Downstream Market in Egypt?
Key companies in the market include Shell PLC, ExxonMobil Corporation, Egyptian General Petroleum Corporation, Chevron Corporation, TotalEnergies SE, Egyptian Petrochemical Holdings Company*List Not Exhaustive, BP PLC, Eni SpA , Apache Corporation , Egyptian Natural Gas Holding Company (EGAS).
3. What are the main segments of the Oil & Gas Downstream Market in Egypt?
The market segments include Refineries, Petrochemical Pants.
4. Can you provide details about the market size?
The market size is estimated to be USD 8.2 USD Billion as of 2022.
5. What are some drivers contributing to market growth?
4.; Increasing Power Demand4.; Increasing Penetration of Renewable Energy.
6. What are the notable trends driving market growth?
Refineries to Dominate the Market.
7. Are there any restraints impacting market growth?
4.; Inadequate Infrastructure in the Country.
8. Can you provide examples of recent developments in the market?
In August 2022, Egypt's Anchorage Investments shortlisted four international companies to construct a USD 2 billion petrochemicals complex in the Suez Canal Economic Zone on the Red Sea. The companies shortlisted are Hyundai, Samsung, Tecnicas Reunidas, and Technip Energies.
9. What pricing options are available for accessing the report?
Pricing options include single-user, multi-user, and enterprise licenses priced at USD 3800, USD 4500, and USD 5800 respectively.
10. Is the market size provided in terms of value or volume?
The market size is provided in terms of value, measured in USD Billion and volume, measured in K Tons.
11. Are there any specific market keywords associated with the report?
Yes, the market keyword associated with the report is "Oil & Gas Downstream Market in Egypt," which aids in identifying and referencing the specific market segment covered.
12. How do I determine which pricing option suits my needs best?
The pricing options vary based on user requirements and access needs. Individual users may opt for single-user licenses, while businesses requiring broader access may choose multi-user or enterprise licenses for cost-effective access to the report.
13. Are there any additional resources or data provided in the Oil & Gas Downstream Market in Egypt report?
While the report offers comprehensive insights, it's advisable to review the specific contents or supplementary materials provided to ascertain if additional resources or data are available.
14. How can I stay updated on further developments or reports in the Oil & Gas Downstream Market in Egypt?
To stay informed about further developments, trends, and reports in the Oil & Gas Downstream Market in Egypt, consider subscribing to industry newsletters, following relevant companies and organizations, or regularly checking reputable industry news sources and publications.
Methodology
Step 1 - Identification of Relevant Samples Size from Population Database


Step 2 - Approaches for Defining Global Market Size (Value, Volume* & Price*)

Note*: In applicable scenarios
Step 3 - Data Sources
Primary Research
- Web Analytics
- Survey Reports
- Research Institute
- Latest Research Reports
- Opinion Leaders
Secondary Research
- Annual Reports
- White Paper
- Latest Press Release
- Industry Association
- Paid Database
- Investor Presentations

Step 4 - Data Triangulation
Involves using different sources of information in order to increase the validity of a study
These sources are likely to be stakeholders in a program - participants, other researchers, program staff, other community members, and so on.
Then we put all data in single framework & apply various statistical tools to find out the dynamic on the market.
During the analysis stage, feedback from the stakeholder groups would be compared to determine areas of agreement as well as areas of divergence


