Key Insights
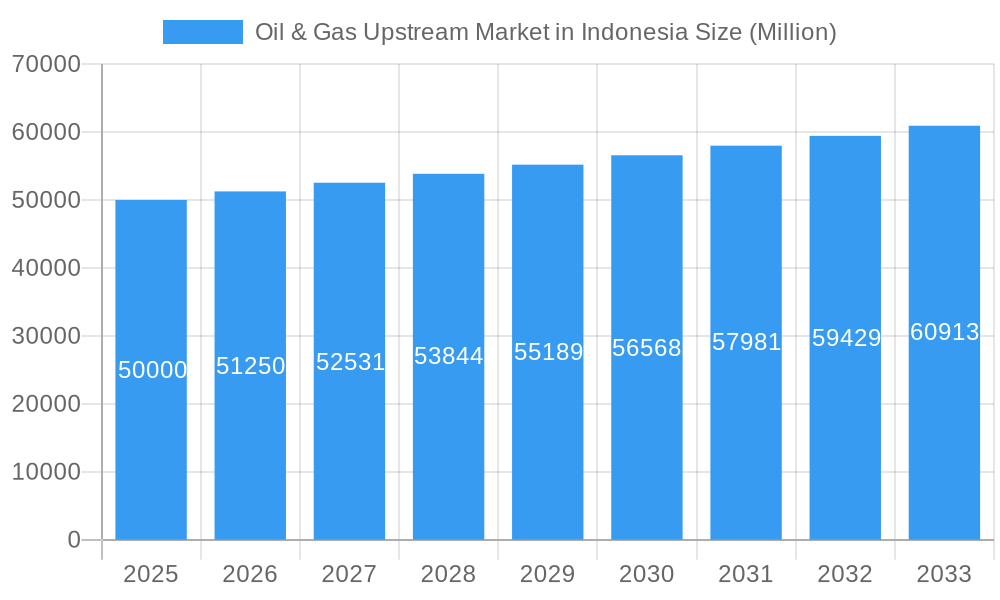
The Indonesian oil and gas upstream market, encompassing onshore and offshore operations, is experiencing robust growth, projected to maintain a CAGR exceeding 2.50% from 2025 to 2033. This expansion is driven by increasing domestic energy demand fueled by Indonesia's economic development and population growth. Furthermore, strategic government initiatives aimed at bolstering energy security and attracting foreign investment are contributing significantly to market expansion. The market is segmented by product type (crude oil, natural gas, and other products), with crude oil currently dominating the sector due to its high demand for both domestic consumption and export. However, growing emphasis on cleaner energy sources and diversification efforts may lead to increased investment in natural gas and other, potentially renewable, energy projects in the coming years. Key players like Pertamina, ExxonMobil, and Chevron are actively involved, leveraging their expertise and capital to capitalize on these opportunities. Challenges remain, however, including aging infrastructure requiring significant investment for upgrades and maintenance, as well as environmental concerns related to exploration and production activities. Navigating these challenges successfully will be crucial for sustained growth and responsible development of Indonesia's significant oil and gas resources.
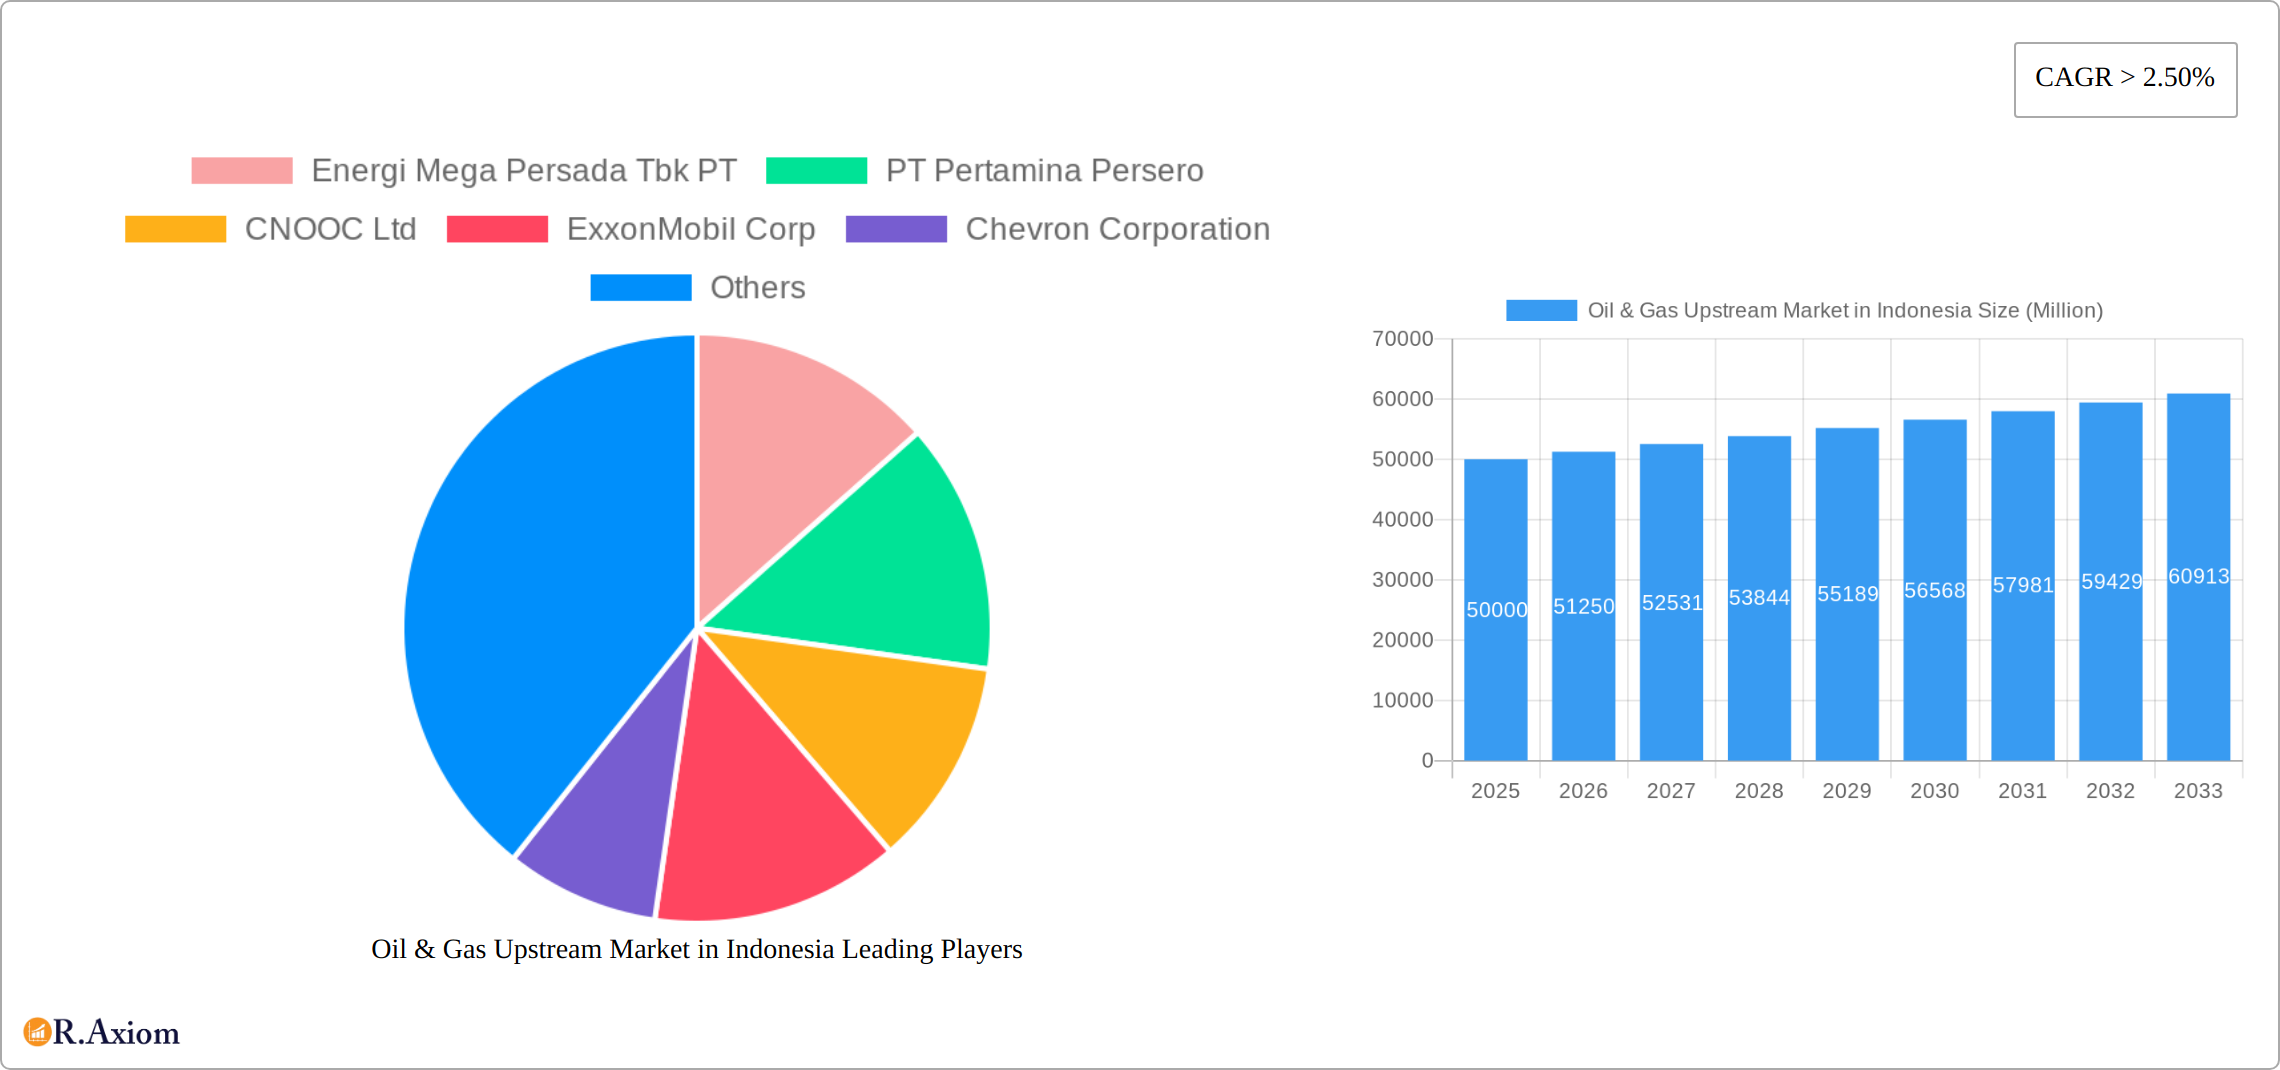
Oil & Gas Upstream Market in Indonesia Market Size (In Billion)
The forecast period (2025-2033) anticipates continued expansion, albeit potentially at a moderated rate compared to the initial years due to global energy transition initiatives and the increasing adoption of renewable energy sources. Nevertheless, Indonesia's strategic location and substantial reserves ensure the long-term relevance of its upstream oil and gas sector. Ongoing technological advancements aimed at enhancing efficiency and reducing environmental impact, such as improved exploration techniques and enhanced oil recovery methods, will play a key role in shaping the future trajectory of the market. Competitive intensity among existing players and potential new entrants will further influence market dynamics, necessitating strategic partnerships and innovative approaches to maintain a strong market position. The onshore segment is expected to retain a substantial share of the market due to established infrastructure and relative ease of access compared to offshore operations, which often involve higher capital expenditure and technological complexity.
Oil & Gas Upstream Market in Indonesia Company Market Share
This comprehensive report provides an in-depth analysis of the Indonesian oil and gas upstream market, offering invaluable insights for industry stakeholders, investors, and strategic decision-makers. The study covers the period from 2019 to 2033, with a base year of 2025 and a forecast period spanning 2025-2033. The report leverages extensive primary and secondary research, providing detailed market sizing, segmentation, and future growth projections.
Oil & Gas Upstream Market in Indonesia Market Concentration & Innovation
This section analyzes the Indonesian oil and gas upstream market's competitive landscape, focusing on market concentration, innovation drivers, regulatory frameworks, and M&A activities. The market is characterized by a mix of both international and domestic players, with PT Pertamina Persero holding a significant market share. However, the presence of companies like CNOOC Ltd, ExxonMobil Corp, and Chevron Corporation signifies considerable international involvement.
Market Concentration: PT Pertamina Persero dominates the market, holding an estimated xx% market share in 2025, followed by CNOOC Ltd at xx% and ExxonMobil Corp at xx%. The remaining market share is distributed among several other players including Energi Mega Persada Tbk PT, Black Platinum Energy Ltd, Petroliam Nasional Berhad (Petronas), and Indrillco Group.
Innovation Drivers: Technological advancements in exploration and production, including enhanced oil recovery (EOR) techniques and digitalization, are key innovation drivers. The government's focus on improving energy efficiency and reducing emissions also incentivizes innovation in cleaner energy solutions.
Regulatory Framework: Indonesia's regulatory framework plays a crucial role in shaping market dynamics. Government policies related to licensing, environmental regulations, and fiscal incentives significantly influence investment decisions and operational strategies.
M&A Activities: The Indonesian oil and gas upstream sector has witnessed significant M&A activity in recent years, with total deal values exceeding $xx Million in the period 2019-2024. These activities are driven by the desire to expand operations, access new resources, and improve operational efficiency. Future M&A activity is expected to continue, driven by the need for consolidation and access to technology.
Oil & Gas Upstream Market in Indonesia Industry Trends & Insights
The Indonesian oil and gas upstream market is poised for significant growth, projected to achieve a Compound Annual Growth Rate (CAGR) of [Insert Updated CAGR Percentage]% during the forecast period (2025-2033). This optimistic outlook stems from several converging factors: a robust increase in domestic energy demand fueled by Indonesia's burgeoning economy; substantial investments in exploration and production (E&P) activities, both domestically and through foreign direct investment; and proactive government policies designed to bolster energy security and enhance the sector's competitiveness. These initiatives include [Mention specific government policies or programs, e.g., tax incentives, deregulation measures].
However, this growth trajectory isn't without its complexities. While increasing energy consumption remains a primary driver, the market faces considerable headwinds. Fluctuations in global oil prices continue to present a major challenge, impacting investment decisions and profitability. Furthermore, the global shift towards renewable energy sources and increasing environmental concerns necessitate a strategic pivot towards sustainability within the sector. This translates into a growing need for enhanced environmental, social, and governance (ESG) practices, pushing companies to adopt cleaner technologies such as carbon capture, utilization, and storage (CCUS) and reduce their environmental footprint. The incorporation of advanced technologies, including Artificial Intelligence (AI) and Machine Learning (ML) for predictive maintenance and optimized resource allocation, is gradually gaining traction, although wider adoption requires further investment and development. The competitive landscape is dynamic, with established players and new entrants vying for market share through strategic partnerships, technological innovation, and operational efficiency improvements.
Dominant Markets & Segments in Oil & Gas Upstream Market in Indonesia
Dominant Segment Analysis:
Location of Deployment: Offshore oil and gas production currently dominates the Indonesian upstream market due to the substantial reserves located in the offshore areas. The government's initiatives to improve offshore infrastructure are further strengthening this dominance. Onshore production accounts for a smaller share of the market, with challenges primarily related to land acquisition and environmental concerns.
Product: Crude oil currently constitutes the most significant segment, holding approximately xx% of the market share, followed by natural gas at xx%. "Other products" comprising liquefied petroleum gas (LPG), condensate, and other by-products hold a smaller market share.
Key Drivers:
- Economic Policies: Government incentives and tax benefits for oil and gas exploration and production heavily influence the market.
- Infrastructure Development: Investments in infrastructure, particularly pipelines and transportation networks, play a vital role in facilitating production and distribution.
- Regulatory Framework: Stable and predictable regulatory environments attract investment and stimulate market growth.
Oil & Gas Upstream Market in Indonesia Product Developments
Innovation is crucial for maintaining competitiveness in the Indonesian upstream sector. Significant advancements in Enhanced Oil Recovery (EOR) techniques, such as polymer flooding and chemical injection, are extending the productive lifespan of mature oil fields and improving recovery rates. Simultaneously, the adoption of data analytics and digitalization across the value chain is streamlining operations, reducing costs, and optimizing production processes. The push for decarbonization is driving innovation in carbon capture and storage (CCS) and other emissions reduction technologies. However, wider adoption of these cleaner technologies requires overcoming significant technological, economic, and regulatory hurdles. The success of these innovations hinges on their cost-effectiveness, efficiency, and demonstrable environmental benefits, with a focus on reducing the sector's overall carbon intensity.
Report Scope & Segmentation Analysis
Location of Deployment: The report segments the market based on onshore and offshore operations, analyzing their respective market sizes, growth projections, and competitive dynamics.
Product: The market is further segmented into Crude Oil, Natural Gas, and Other Products. Each segment's market size, growth projections, and competitive landscape are analyzed individually.
Overall, the report provides a comprehensive understanding of the market structure and dynamics within each segment, including future growth potentials and competitive landscape.
Key Drivers of Oil & Gas Upstream Market in Indonesia Growth
The sustained growth of Indonesia's oil and gas upstream market is underpinned by a confluence of factors: a consistently strong domestic energy demand fueled by robust economic growth; government incentives and initiatives aimed at boosting domestic production and attracting foreign investment; the ongoing exploration and development of new oil and gas reserves, particularly in [mention specific regions or fields]; and the continuous improvement of E&P technologies leading to increased efficiency and reduced costs. Further, the strategic focus on developing Indonesia's domestic gas resources to support power generation and industrial needs is significantly contributing to market growth.
Challenges in the Oil & Gas Upstream Market in Indonesia Sector
Despite its potential, the Indonesian oil and gas upstream sector grapples with substantial challenges. The inherent volatility of global oil and gas prices remains a significant concern, influencing investment decisions and project viability. Bureaucratic hurdles and complex regulatory processes can lead to delays in project approvals and implementation. Furthermore, the sector faces intensifying competition from renewable energy sources, requiring a long-term strategic adaptation to ensure sustained growth. Addressing these challenges requires a collaborative approach involving government, industry stakeholders, and international partners. This includes streamlining regulatory frameworks, fostering a conducive investment climate, and supporting the development and adoption of sustainable technologies.
Emerging Opportunities in Oil & Gas Upstream Market in Indonesia
The sector presents growth opportunities in deepwater exploration and production, given the vast untapped reserves in this area. Technological innovations in EOR and CCS are creating new avenues for increasing oil and gas recovery and reducing environmental impact. Furthermore, increasing domestic demand and a supportive government policy environment contribute to a favorable investment climate for this sector.
Leading Players in the Oil & Gas Upstream Market in Indonesia Market
- Energi Mega Persada Tbk PT
- PT Pertamina Persero
- CNOOC Ltd
- ExxonMobil Corp
- Chevron Corporation
- Black Platinum Energy Ltd
- Petroliam Nasional Berhad (Petronas)
- Indrillco Group
Key Developments in Oil & Gas Upstream Market in Indonesia Industry
- [Month Year]: Launch of a new deepwater exploration project by [Company Name].
- [Month Year]: Successful implementation of an enhanced oil recovery technique by [Company Name], boosting production by xx%.
- [Month Year]: Acquisition of [Company A] by [Company B], resulting in increased market share and synergies. (Note: Replace bracketed information with actual data.)
Strategic Outlook for Oil & Gas Upstream Market in Indonesia Market
The Indonesian oil and gas upstream market presents a compelling long-term investment opportunity, driven by persistent growth in domestic energy demand, significant untapped reserves, and continuous technological advancements. Strategic partnerships between national and international oil companies are crucial to unlock the sector's full potential. Investment in deepwater exploration and production, coupled with a decisive commitment to cleaner technologies and sustainable practices, will be essential to ensure the sector's long-term viability and environmental responsibility. A supportive regulatory environment, combined with a focus on technological innovation and operational efficiency, will be key determinants of future growth and success.
Oil & Gas Upstream Market in Indonesia Segmentation
-
1. Location of Deployment
- 1.1. Onshore
- 1.2. Offshore
-
2. Product
- 2.1. Crude Oil
- 2.2. Natural Gas
- 2.3. Other Products
Oil & Gas Upstream Market in Indonesia Segmentation By Geography
-
1. North America
- 1.1. United States
- 1.2. Canada
- 1.3. Mexico
-
2. South America
- 2.1. Brazil
- 2.2. Argentina
- 2.3. Rest of South America
-
3. Europe
- 3.1. United Kingdom
- 3.2. Germany
- 3.3. France
- 3.4. Italy
- 3.5. Spain
- 3.6. Russia
- 3.7. Benelux
- 3.8. Nordics
- 3.9. Rest of Europe
-
4. Middle East & Africa
- 4.1. Turkey
- 4.2. Israel
- 4.3. GCC
- 4.4. North Africa
- 4.5. South Africa
- 4.6. Rest of Middle East & Africa
-
5. Asia Pacific
- 5.1. China
- 5.2. India
- 5.3. Japan
- 5.4. South Korea
- 5.5. ASEAN
- 5.6. Oceania
- 5.7. Rest of Asia Pacific
Oil & Gas Upstream Market in Indonesia Regional Market Share
Geographic Coverage of Oil & Gas Upstream Market in Indonesia
Oil & Gas Upstream Market in Indonesia REPORT HIGHLIGHTS
| Aspects | Details |
|---|---|
| Study Period | 2020-2034 |
| Base Year | 2025 |
| Estimated Year | 2026 |
| Forecast Period | 2026-2034 |
| Historical Period | 2020-2025 |
| Growth Rate | CAGR of 7.66% from 2020-2034 |
| Segmentation |
|
Table of Contents
- 1. Introduction
- 1.1. Research Scope
- 1.2. Market Segmentation
- 1.3. Research Objective
- 1.4. Definitions and Assumptions
- 2. Executive Summary
- 2.1. Market Snapshot
- 3. Market Dynamics
- 3.1. Market Drivers
- 3.2. Market Restrains
- 3.3. Market Trends
- 3.4. Market Opportunities
- 4. Market Factor Analysis
- 4.1. Porters Five Forces
- 4.1.1. Bargaining Power of Suppliers
- 4.1.2. Bargaining Power of Buyers
- 4.1.3. Threat of New Entrants
- 4.1.4. Threat of Substitutes
- 4.1.5. Competitive Rivalry
- 4.2. PESTEL analysis
- 4.3. BCG Analysis
- 4.3.1. Stars (High Growth, High Market Share)
- 4.3.2. Cash Cows (Low Growth, High Market Share)
- 4.3.3. Question Mark (High Growth, Low Market Share)
- 4.3.4. Dogs (Low Growth, Low Market Share)
- 4.4. Ansoff Matrix Analysis
- 4.5. Supply Chain Analysis
- 4.6. Regulatory Landscape
- 4.7. Current Market Potential and Opportunity Assessment (TAM–SAM–SOM Framework)
- 4.8. RAX Analyst Note
- 4.1. Porters Five Forces
- 5. Market Analysis, Insights and Forecast 2021-2033
- 5.1. Market Analysis, Insights and Forecast - by Location of Deployment
- 5.1.1. Onshore
- 5.1.2. Offshore
- 5.2. Market Analysis, Insights and Forecast - by Product
- 5.2.1. Crude Oil
- 5.2.2. Natural Gas
- 5.2.3. Other Products
- 5.3. Market Analysis, Insights and Forecast - by Region
- 5.3.1. North America
- 5.3.2. South America
- 5.3.3. Europe
- 5.3.4. Middle East & Africa
- 5.3.5. Asia Pacific
- 5.1. Market Analysis, Insights and Forecast - by Location of Deployment
- 6. Global Oil & Gas Upstream Market in Indonesia Analysis, Insights and Forecast, 2021-2033
- 6.1. Market Analysis, Insights and Forecast - by Location of Deployment
- 6.1.1. Onshore
- 6.1.2. Offshore
- 6.2. Market Analysis, Insights and Forecast - by Product
- 6.2.1. Crude Oil
- 6.2.2. Natural Gas
- 6.2.3. Other Products
- 6.1. Market Analysis, Insights and Forecast - by Location of Deployment
- 7. North America Oil & Gas Upstream Market in Indonesia Analysis, Insights and Forecast, 2020-2032
- 7.1. Market Analysis, Insights and Forecast - by Location of Deployment
- 7.1.1. Onshore
- 7.1.2. Offshore
- 7.2. Market Analysis, Insights and Forecast - by Product
- 7.2.1. Crude Oil
- 7.2.2. Natural Gas
- 7.2.3. Other Products
- 7.1. Market Analysis, Insights and Forecast - by Location of Deployment
- 8. South America Oil & Gas Upstream Market in Indonesia Analysis, Insights and Forecast, 2020-2032
- 8.1. Market Analysis, Insights and Forecast - by Location of Deployment
- 8.1.1. Onshore
- 8.1.2. Offshore
- 8.2. Market Analysis, Insights and Forecast - by Product
- 8.2.1. Crude Oil
- 8.2.2. Natural Gas
- 8.2.3. Other Products
- 8.1. Market Analysis, Insights and Forecast - by Location of Deployment
- 9. Europe Oil & Gas Upstream Market in Indonesia Analysis, Insights and Forecast, 2020-2032
- 9.1. Market Analysis, Insights and Forecast - by Location of Deployment
- 9.1.1. Onshore
- 9.1.2. Offshore
- 9.2. Market Analysis, Insights and Forecast - by Product
- 9.2.1. Crude Oil
- 9.2.2. Natural Gas
- 9.2.3. Other Products
- 9.1. Market Analysis, Insights and Forecast - by Location of Deployment
- 10. Middle East & Africa Oil & Gas Upstream Market in Indonesia Analysis, Insights and Forecast, 2020-2032
- 10.1. Market Analysis, Insights and Forecast - by Location of Deployment
- 10.1.1. Onshore
- 10.1.2. Offshore
- 10.2. Market Analysis, Insights and Forecast - by Product
- 10.2.1. Crude Oil
- 10.2.2. Natural Gas
- 10.2.3. Other Products
- 10.1. Market Analysis, Insights and Forecast - by Location of Deployment
- 11. Asia Pacific Oil & Gas Upstream Market in Indonesia Analysis, Insights and Forecast, 2020-2032
- 11.1. Market Analysis, Insights and Forecast - by Location of Deployment
- 11.1.1. Onshore
- 11.1.2. Offshore
- 11.2. Market Analysis, Insights and Forecast - by Product
- 11.2.1. Crude Oil
- 11.2.2. Natural Gas
- 11.2.3. Other Products
- 11.1. Market Analysis, Insights and Forecast - by Location of Deployment
- 12. Competitive Analysis
- 12.1. Company Profiles
- 12.1.1 Energi Mega Persada Tbk PT
- 12.1.1.1. Company Overview
- 12.1.1.2. Products
- 12.1.1.3. Company Financials
- 12.1.1.4. SWOT Analysis
- 12.1.2 PT Pertamina Persero
- 12.1.2.1. Company Overview
- 12.1.2.2. Products
- 12.1.2.3. Company Financials
- 12.1.2.4. SWOT Analysis
- 12.1.3 CNOOC Ltd
- 12.1.3.1. Company Overview
- 12.1.3.2. Products
- 12.1.3.3. Company Financials
- 12.1.3.4. SWOT Analysis
- 12.1.4 ExxonMobil Corp
- 12.1.4.1. Company Overview
- 12.1.4.2. Products
- 12.1.4.3. Company Financials
- 12.1.4.4. SWOT Analysis
- 12.1.5 Chevron Corporation
- 12.1.5.1. Company Overview
- 12.1.5.2. Products
- 12.1.5.3. Company Financials
- 12.1.5.4. SWOT Analysis
- 12.1.6 Black Platinum Energy Ltd
- 12.1.6.1. Company Overview
- 12.1.6.2. Products
- 12.1.6.3. Company Financials
- 12.1.6.4. SWOT Analysis
- 12.1.7 Petroliam Nasional Berhad (Petronas)*List Not Exhaustive
- 12.1.7.1. Company Overview
- 12.1.7.2. Products
- 12.1.7.3. Company Financials
- 12.1.7.4. SWOT Analysis
- 12.1.8 Indrillco Group
- 12.1.8.1. Company Overview
- 12.1.8.2. Products
- 12.1.8.3. Company Financials
- 12.1.8.4. SWOT Analysis
- 12.1.1 Energi Mega Persada Tbk PT
- 12.2. Market Entropy
- 12.2.1 Company's Key Areas Served
- 12.2.2 Recent Developments
- 12.3. Company Market Share Analysis 2025
- 12.3.1 Top 5 Companies Market Share Analysis
- 12.3.2 Top 3 Companies Market Share Analysis
- 12.4. List of Potential Customers
- 13. Research Methodology
List of Figures
- Figure 1: Global Oil & Gas Upstream Market in Indonesia Revenue Breakdown (billion, %) by Region 2025 & 2033
- Figure 2: North America Oil & Gas Upstream Market in Indonesia Revenue (billion), by Location of Deployment 2025 & 2033
- Figure 3: North America Oil & Gas Upstream Market in Indonesia Revenue Share (%), by Location of Deployment 2025 & 2033
- Figure 4: North America Oil & Gas Upstream Market in Indonesia Revenue (billion), by Product 2025 & 2033
- Figure 5: North America Oil & Gas Upstream Market in Indonesia Revenue Share (%), by Product 2025 & 2033
- Figure 6: North America Oil & Gas Upstream Market in Indonesia Revenue (billion), by Country 2025 & 2033
- Figure 7: North America Oil & Gas Upstream Market in Indonesia Revenue Share (%), by Country 2025 & 2033
- Figure 8: South America Oil & Gas Upstream Market in Indonesia Revenue (billion), by Location of Deployment 2025 & 2033
- Figure 9: South America Oil & Gas Upstream Market in Indonesia Revenue Share (%), by Location of Deployment 2025 & 2033
- Figure 10: South America Oil & Gas Upstream Market in Indonesia Revenue (billion), by Product 2025 & 2033
- Figure 11: South America Oil & Gas Upstream Market in Indonesia Revenue Share (%), by Product 2025 & 2033
- Figure 12: South America Oil & Gas Upstream Market in Indonesia Revenue (billion), by Country 2025 & 2033
- Figure 13: South America Oil & Gas Upstream Market in Indonesia Revenue Share (%), by Country 2025 & 2033
- Figure 14: Europe Oil & Gas Upstream Market in Indonesia Revenue (billion), by Location of Deployment 2025 & 2033
- Figure 15: Europe Oil & Gas Upstream Market in Indonesia Revenue Share (%), by Location of Deployment 2025 & 2033
- Figure 16: Europe Oil & Gas Upstream Market in Indonesia Revenue (billion), by Product 2025 & 2033
- Figure 17: Europe Oil & Gas Upstream Market in Indonesia Revenue Share (%), by Product 2025 & 2033
- Figure 18: Europe Oil & Gas Upstream Market in Indonesia Revenue (billion), by Country 2025 & 2033
- Figure 19: Europe Oil & Gas Upstream Market in Indonesia Revenue Share (%), by Country 2025 & 2033
- Figure 20: Middle East & Africa Oil & Gas Upstream Market in Indonesia Revenue (billion), by Location of Deployment 2025 & 2033
- Figure 21: Middle East & Africa Oil & Gas Upstream Market in Indonesia Revenue Share (%), by Location of Deployment 2025 & 2033
- Figure 22: Middle East & Africa Oil & Gas Upstream Market in Indonesia Revenue (billion), by Product 2025 & 2033
- Figure 23: Middle East & Africa Oil & Gas Upstream Market in Indonesia Revenue Share (%), by Product 2025 & 2033
- Figure 24: Middle East & Africa Oil & Gas Upstream Market in Indonesia Revenue (billion), by Country 2025 & 2033
- Figure 25: Middle East & Africa Oil & Gas Upstream Market in Indonesia Revenue Share (%), by Country 2025 & 2033
- Figure 26: Asia Pacific Oil & Gas Upstream Market in Indonesia Revenue (billion), by Location of Deployment 2025 & 2033
- Figure 27: Asia Pacific Oil & Gas Upstream Market in Indonesia Revenue Share (%), by Location of Deployment 2025 & 2033
- Figure 28: Asia Pacific Oil & Gas Upstream Market in Indonesia Revenue (billion), by Product 2025 & 2033
- Figure 29: Asia Pacific Oil & Gas Upstream Market in Indonesia Revenue Share (%), by Product 2025 & 2033
- Figure 30: Asia Pacific Oil & Gas Upstream Market in Indonesia Revenue (billion), by Country 2025 & 2033
- Figure 31: Asia Pacific Oil & Gas Upstream Market in Indonesia Revenue Share (%), by Country 2025 & 2033
List of Tables
- Table 1: Global Oil & Gas Upstream Market in Indonesia Revenue billion Forecast, by Location of Deployment 2020 & 2033
- Table 2: Global Oil & Gas Upstream Market in Indonesia Revenue billion Forecast, by Product 2020 & 2033
- Table 3: Global Oil & Gas Upstream Market in Indonesia Revenue billion Forecast, by Region 2020 & 2033
- Table 4: Global Oil & Gas Upstream Market in Indonesia Revenue billion Forecast, by Location of Deployment 2020 & 2033
- Table 5: Global Oil & Gas Upstream Market in Indonesia Revenue billion Forecast, by Product 2020 & 2033
- Table 6: Global Oil & Gas Upstream Market in Indonesia Revenue billion Forecast, by Country 2020 & 2033
- Table 7: United States Oil & Gas Upstream Market in Indonesia Revenue (billion) Forecast, by Application 2020 & 2033
- Table 8: Canada Oil & Gas Upstream Market in Indonesia Revenue (billion) Forecast, by Application 2020 & 2033
- Table 9: Mexico Oil & Gas Upstream Market in Indonesia Revenue (billion) Forecast, by Application 2020 & 2033
- Table 10: Global Oil & Gas Upstream Market in Indonesia Revenue billion Forecast, by Location of Deployment 2020 & 2033
- Table 11: Global Oil & Gas Upstream Market in Indonesia Revenue billion Forecast, by Product 2020 & 2033
- Table 12: Global Oil & Gas Upstream Market in Indonesia Revenue billion Forecast, by Country 2020 & 2033
- Table 13: Brazil Oil & Gas Upstream Market in Indonesia Revenue (billion) Forecast, by Application 2020 & 2033
- Table 14: Argentina Oil & Gas Upstream Market in Indonesia Revenue (billion) Forecast, by Application 2020 & 2033
- Table 15: Rest of South America Oil & Gas Upstream Market in Indonesia Revenue (billion) Forecast, by Application 2020 & 2033
- Table 16: Global Oil & Gas Upstream Market in Indonesia Revenue billion Forecast, by Location of Deployment 2020 & 2033
- Table 17: Global Oil & Gas Upstream Market in Indonesia Revenue billion Forecast, by Product 2020 & 2033
- Table 18: Global Oil & Gas Upstream Market in Indonesia Revenue billion Forecast, by Country 2020 & 2033
- Table 19: United Kingdom Oil & Gas Upstream Market in Indonesia Revenue (billion) Forecast, by Application 2020 & 2033
- Table 20: Germany Oil & Gas Upstream Market in Indonesia Revenue (billion) Forecast, by Application 2020 & 2033
- Table 21: France Oil & Gas Upstream Market in Indonesia Revenue (billion) Forecast, by Application 2020 & 2033
- Table 22: Italy Oil & Gas Upstream Market in Indonesia Revenue (billion) Forecast, by Application 2020 & 2033
- Table 23: Spain Oil & Gas Upstream Market in Indonesia Revenue (billion) Forecast, by Application 2020 & 2033
- Table 24: Russia Oil & Gas Upstream Market in Indonesia Revenue (billion) Forecast, by Application 2020 & 2033
- Table 25: Benelux Oil & Gas Upstream Market in Indonesia Revenue (billion) Forecast, by Application 2020 & 2033
- Table 26: Nordics Oil & Gas Upstream Market in Indonesia Revenue (billion) Forecast, by Application 2020 & 2033
- Table 27: Rest of Europe Oil & Gas Upstream Market in Indonesia Revenue (billion) Forecast, by Application 2020 & 2033
- Table 28: Global Oil & Gas Upstream Market in Indonesia Revenue billion Forecast, by Location of Deployment 2020 & 2033
- Table 29: Global Oil & Gas Upstream Market in Indonesia Revenue billion Forecast, by Product 2020 & 2033
- Table 30: Global Oil & Gas Upstream Market in Indonesia Revenue billion Forecast, by Country 2020 & 2033
- Table 31: Turkey Oil & Gas Upstream Market in Indonesia Revenue (billion) Forecast, by Application 2020 & 2033
- Table 32: Israel Oil & Gas Upstream Market in Indonesia Revenue (billion) Forecast, by Application 2020 & 2033
- Table 33: GCC Oil & Gas Upstream Market in Indonesia Revenue (billion) Forecast, by Application 2020 & 2033
- Table 34: North Africa Oil & Gas Upstream Market in Indonesia Revenue (billion) Forecast, by Application 2020 & 2033
- Table 35: South Africa Oil & Gas Upstream Market in Indonesia Revenue (billion) Forecast, by Application 2020 & 2033
- Table 36: Rest of Middle East & Africa Oil & Gas Upstream Market in Indonesia Revenue (billion) Forecast, by Application 2020 & 2033
- Table 37: Global Oil & Gas Upstream Market in Indonesia Revenue billion Forecast, by Location of Deployment 2020 & 2033
- Table 38: Global Oil & Gas Upstream Market in Indonesia Revenue billion Forecast, by Product 2020 & 2033
- Table 39: Global Oil & Gas Upstream Market in Indonesia Revenue billion Forecast, by Country 2020 & 2033
- Table 40: China Oil & Gas Upstream Market in Indonesia Revenue (billion) Forecast, by Application 2020 & 2033
- Table 41: India Oil & Gas Upstream Market in Indonesia Revenue (billion) Forecast, by Application 2020 & 2033
- Table 42: Japan Oil & Gas Upstream Market in Indonesia Revenue (billion) Forecast, by Application 2020 & 2033
- Table 43: South Korea Oil & Gas Upstream Market in Indonesia Revenue (billion) Forecast, by Application 2020 & 2033
- Table 44: ASEAN Oil & Gas Upstream Market in Indonesia Revenue (billion) Forecast, by Application 2020 & 2033
- Table 45: Oceania Oil & Gas Upstream Market in Indonesia Revenue (billion) Forecast, by Application 2020 & 2033
- Table 46: Rest of Asia Pacific Oil & Gas Upstream Market in Indonesia Revenue (billion) Forecast, by Application 2020 & 2033
Frequently Asked Questions
1. What is the projected Compound Annual Growth Rate (CAGR) of the Oil & Gas Upstream Market in Indonesia?
The projected CAGR is approximately 7.66%.
2. Which companies are prominent players in the Oil & Gas Upstream Market in Indonesia?
Key companies in the market include Energi Mega Persada Tbk PT, PT Pertamina Persero, CNOOC Ltd, ExxonMobil Corp, Chevron Corporation, Black Platinum Energy Ltd, Petroliam Nasional Berhad (Petronas)*List Not Exhaustive, Indrillco Group.
3. What are the main segments of the Oil & Gas Upstream Market in Indonesia?
The market segments include Location of Deployment, Product.
4. Can you provide details about the market size?
The market size is estimated to be USD 281.5 billion as of 2022.
5. What are some drivers contributing to market growth?
4.; Increasing Demand from Industrial Applications4.; Growing Infrastructure Across the World.
6. What are the notable trends driving market growth?
Crude Oil Segment Expected to Dominate the Market.
7. Are there any restraints impacting market growth?
4.; A Rise In Concerns Related To Carbon Emissions And A Shift Towards Electric Vehicles And Renewable Sources Of Energy.
8. Can you provide examples of recent developments in the market?
N/A
9. What pricing options are available for accessing the report?
Pricing options include single-user, multi-user, and enterprise licenses priced at USD 3800, USD 4500, and USD 5800 respectively.
10. Is the market size provided in terms of value or volume?
The market size is provided in terms of value, measured in billion.
11. Are there any specific market keywords associated with the report?
Yes, the market keyword associated with the report is "Oil & Gas Upstream Market in Indonesia," which aids in identifying and referencing the specific market segment covered.
12. How do I determine which pricing option suits my needs best?
The pricing options vary based on user requirements and access needs. Individual users may opt for single-user licenses, while businesses requiring broader access may choose multi-user or enterprise licenses for cost-effective access to the report.
13. Are there any additional resources or data provided in the Oil & Gas Upstream Market in Indonesia report?
While the report offers comprehensive insights, it's advisable to review the specific contents or supplementary materials provided to ascertain if additional resources or data are available.
14. How can I stay updated on further developments or reports in the Oil & Gas Upstream Market in Indonesia?
To stay informed about further developments, trends, and reports in the Oil & Gas Upstream Market in Indonesia, consider subscribing to industry newsletters, following relevant companies and organizations, or regularly checking reputable industry news sources and publications.
Methodology
Step 1 - Identification of Relevant Samples Size from Population Database


Step 2 - Approaches for Defining Global Market Size (Value, Volume* & Price*)

Note*: In applicable scenarios
Step 3 - Data Sources
Primary Research
- Web Analytics
- Survey Reports
- Research Institute
- Latest Research Reports
- Opinion Leaders
Secondary Research
- Annual Reports
- White Paper
- Latest Press Release
- Industry Association
- Paid Database
- Investor Presentations

Step 4 - Data Triangulation
Involves using different sources of information in order to increase the validity of a study
These sources are likely to be stakeholders in a program - participants, other researchers, program staff, other community members, and so on.
Then we put all data in single framework & apply various statistical tools to find out the dynamic on the market.
During the analysis stage, feedback from the stakeholder groups would be compared to determine areas of agreement as well as areas of divergence

