
Key Insights
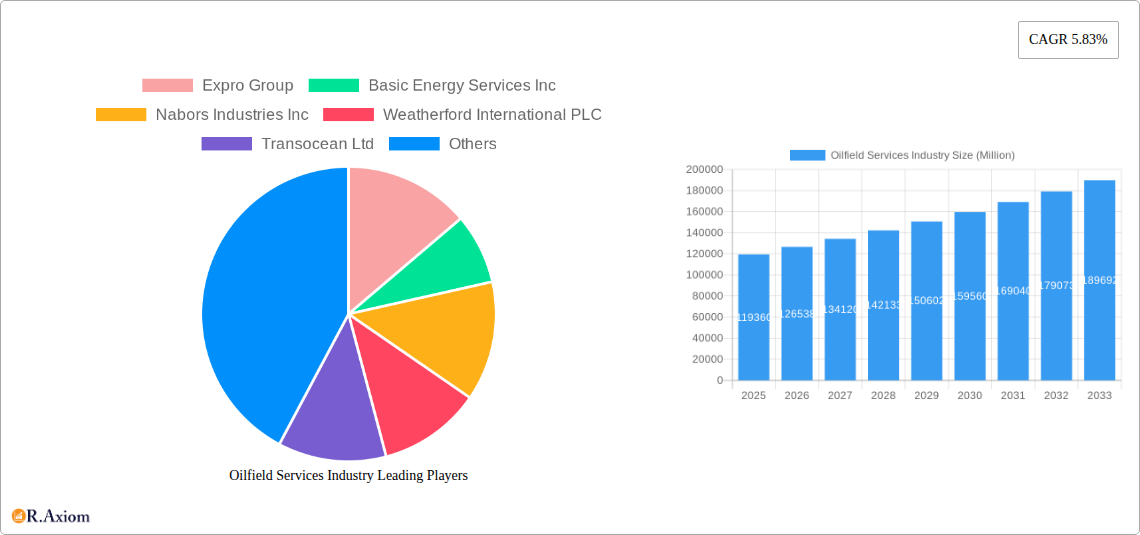
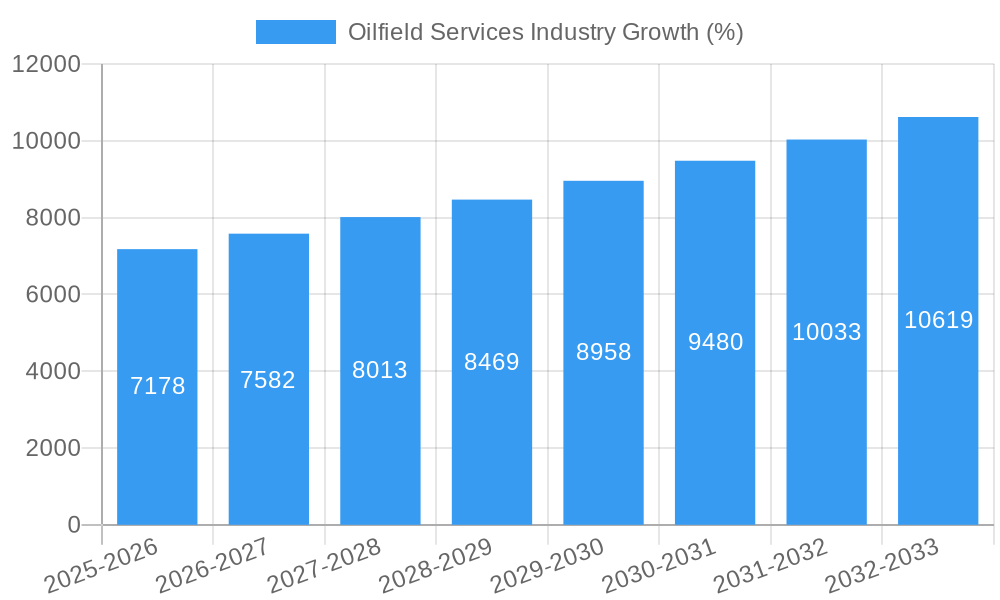
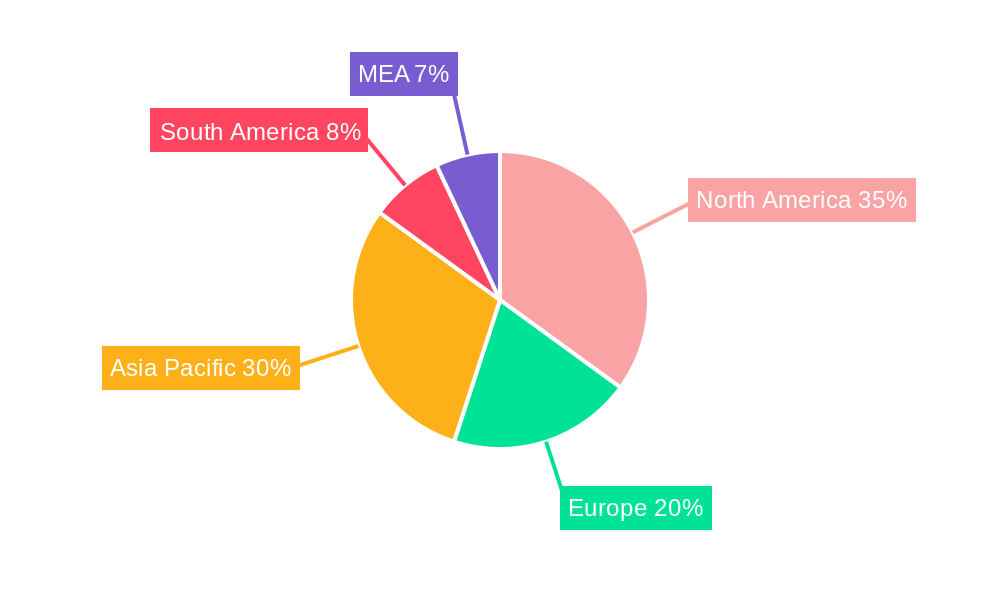
The global oilfield services market, valued at $119.36 billion in 2025, is projected to experience robust growth, driven primarily by increasing global energy demand and ongoing exploration and production activities in established and emerging oil and gas regions. The Compound Annual Growth Rate (CAGR) of 5.83% from 2025 to 2033 indicates a significant expansion of the market over the forecast period. Key growth drivers include the rising adoption of advanced technologies like automation and digitalization in drilling, completion, and production operations. Furthermore, government initiatives supporting energy independence and infrastructure development in various regions are contributing to market growth. While factors like fluctuating oil prices and environmental concerns act as restraints, the long-term outlook remains positive due to continued investment in oil and gas infrastructure and the persistent need to meet global energy needs. The market segmentation reveals strong performance across all service types (Drilling, Completion, Production & Intervention, and Other Services) and deployment locations (Onshore and Offshore). North America and the Asia-Pacific region are expected to dominate the market, driven by significant exploration and production activities and supportive government policies.
The competitive landscape is characterized by the presence of both large multinational corporations and smaller specialized service providers. Companies like Schlumberger, Halliburton, Baker Hughes, and Weatherford are major players, leveraging their technological expertise and global reach. However, the increasing focus on sustainability and cost optimization is leading to the emergence of smaller, agile companies that offer specialized and technologically advanced services. The market is witnessing a trend towards consolidation, with strategic mergers and acquisitions playing a significant role in shaping the competitive dynamics. Future growth will depend on the ability of companies to adapt to technological advancements, environmental regulations, and evolving market demands, focusing on efficiency, safety, and sustainability. The continued rise in energy demand, particularly in developing economies, coupled with technological innovations, will continue to drive the expansion of the oilfield services market throughout the forecast period.
This detailed report provides a comprehensive analysis of the Oilfield Services industry, covering market size, segmentation, key players, growth drivers, challenges, and future opportunities. The study period spans from 2019 to 2033, with 2025 serving as the base and estimated year. The report utilizes data from the historical period (2019-2024) and forecasts market trends up to 2033. This in-depth analysis is crucial for industry stakeholders, investors, and strategic decision-makers seeking to navigate the complexities and capitalize on the potential of this dynamic sector. The report projects a market value exceeding xx Million by 2033.
Oilfield Services Industry Market Concentration & Innovation
The oilfield services market is characterized by a moderately concentrated structure, with a few multinational giants and numerous smaller specialized players. Market share is highly dynamic, influenced by M&A activity, technological advancements, and fluctuating oil prices. Schlumberger Limited and Halliburton Company consistently hold significant market share, while other key players like Baker Hughes Company, Weatherford International PLC, and Expro Group compete fiercely. The total M&A deal value in the industry between 2019 and 2024 is estimated at xx Million.
- Market Concentration: The Herfindahl-Hirschman Index (HHI) for the oilfield services market is estimated at xx, indicating a moderately concentrated market.
- Innovation Drivers: Technological advancements, particularly in automation, digitalization, and enhanced oil recovery (EOR) techniques, are key innovation drivers. The push for sustainable practices and carbon capture technologies also influences innovation.
- Regulatory Frameworks: Stringent safety and environmental regulations impact operational costs and necessitate technological innovation.
- Product Substitutes: The availability of alternative energy sources and evolving drilling techniques present potential substitutes for traditional oilfield services.
- End-User Trends: The increasing demand for efficient, cost-effective, and environmentally conscious oil and gas production influences end-user preferences and shapes market demands.
- M&A Activities: Strategic mergers and acquisitions are common, driven by the need to expand geographical reach, enhance technological capabilities, and consolidate market share. Notable deals include [Insert specific example of an M&A deal if available, with deal value].
Oilfield Services Industry Industry Trends & Insights
The oilfield services market is experiencing significant transformation driven by several factors. Technological disruptions, such as the adoption of artificial intelligence (AI) and automation, are increasing operational efficiency and reducing costs. The global shift toward renewable energy sources presents both challenges and opportunities, compelling companies to adapt and innovate. While the industry experienced a downturn in 2020 due to the COVID-19 pandemic, the subsequent recovery, aided by rising oil prices, fuelled substantial growth.
The Compound Annual Growth Rate (CAGR) for the oilfield services market during the forecast period (2025-2033) is projected to be xx%. Market penetration of new technologies, such as AI-powered drilling optimization, is expected to increase significantly over the next decade, reaching xx% by 2033. Consumer preferences are shifting towards environmentally friendly technologies, thereby driving innovation in this direction and favoring companies that incorporate sustainable practices. Competitive dynamics are intense, with leading players investing heavily in R&D and strategic alliances to maintain a competitive edge.
Dominant Markets & Segments in Oilfield Services Industry
The global oilfield services market is geographically diverse, with significant activity in North America, the Middle East, and Asia-Pacific. Within the service type segments, Drilling Services and Production & Intervention Services consistently represent the largest shares of the market, reflecting the continuous need for exploration, well completion, and ongoing production optimization. Offshore deployments also command a notable share due to increasing exploration and production activities in deepwater environments.
- Dominant Region: The Middle East and North America are projected to be the leading regions for oilfield services throughout the forecast period.
- Dominant Segment (Service Type): Drilling services and Production & Intervention Services.
- Dominant Segment (Location): Offshore segments show robust growth due to deepwater exploration.
Key Drivers:
- North America: Strong shale gas production, established infrastructure, and technological advancements.
- Middle East: Significant oil reserves, large-scale projects, and government investments.
- Asia-Pacific: Growing energy demand, increasing exploration activity, and development of offshore fields.
- Offshore: High demand driven by deepwater exploration and production, technological innovation in subsea operations, and the need for specialized services.
The dominance of these regions and segments is primarily driven by factors such as abundant oil and gas reserves, favorable government policies, substantial investments in infrastructure development, and ongoing technological advancements.
Oilfield Services Industry Product Developments
Recent product innovations focus on enhancing efficiency, safety, and environmental sustainability. This includes the development of advanced drilling technologies, automated well completion systems, digital oilfield solutions leveraging AI and machine learning, and improved production optimization techniques for increased efficiency and cost reduction. These innovations are designed to address specific market needs, including minimizing environmental impact and maximizing operational performance, leading to improved return on investments.
Report Scope & Segmentation Analysis
This report segments the oilfield services market based on service type and location of deployment.
Service Type:
- Drilling Services: This segment includes onshore and offshore drilling activities, and is expected to show a CAGR of xx% during the forecast period. Competitive dynamics are shaped by technological advancements and the adoption of automation.
- Completion Services: This segment encompasses well completion operations and is projected to experience a CAGR of xx%. The demand for efficient and sustainable completion techniques is driving innovation in this area.
- Production and Intervention Services: This segment focuses on production optimization and well intervention techniques. The growth of this segment is expected to be xx% CAGR due to the increasing focus on enhancing productivity and extending well life.
- Other Services: This segment encompasses a broad range of other services, such as pipeline maintenance and environmental remediation. The growth will be mainly driven by increasing regulatory requirements.
Location of Deployment:
- Onshore: This segment is projected to grow at a CAGR of xx%. Competition in this area is intense, with various companies offering similar services.
- Offshore: This segment is predicted to demonstrate a higher CAGR of xx% due to the exploration and production of oil and gas resources in deepwater areas. This area shows increasing demand for sophisticated technologies and specialized expertise.
Key Drivers of Oilfield Services Industry Growth
Several factors fuel the growth of the oilfield services industry. Increased global energy demand, particularly in developing economies, necessitates higher oil and gas production. Technological advancements, including automation and digitalization, enhance efficiency and reduce operational costs, thereby stimulating market growth. Government initiatives aimed at promoting exploration and production in various regions also positively influence market expansion. Finally, the continuing development and implementation of carbon capture and storage technologies are creating new opportunities.
Challenges in the Oilfield Services Industry Sector
The oilfield services industry faces several challenges. Fluctuations in oil prices directly impact investment and demand, leading to market instability. Stringent environmental regulations and safety standards necessitate significant investments in compliance, impacting profitability. Supply chain disruptions and logistical complexities can cause delays and cost overruns. Intense competition among established players and the emergence of new entrants creates pressure on margins.
Emerging Opportunities in Oilfield Services Industry
The industry is witnessing numerous opportunities. The rise of unconventional resources, such as shale gas, creates new demand for specialized services. The growing emphasis on environmental sustainability opens avenues for companies providing eco-friendly solutions, such as carbon capture and storage (CCS) and enhanced oil recovery (EOR) technologies. The ongoing digital transformation presents opportunities for companies providing advanced data analytics and automation solutions. New markets in developing economies with growing energy demands also offer substantial potential for expansion.
Leading Players in the Oilfield Services Industry Market
- Expro Group
- Basic Energy Services Inc
- Nabors Industries Inc
- Weatherford International PLC
- Transocean Ltd
- Baker Hughes Company
- China Oilfield Services Limited
- Halliburton Company
- OiLSERV
- Schlumberger Limited
- Valaris PLC
Key Developments in Oilfield Services Industry Industry
September 2023: SLB signed a subsurface technology agreement with INEOS Energy, focusing on AI-driven operational performance improvements and CCS technologies. This collaboration signifies a significant advancement in subsurface technology and highlights the growing importance of AI in the oilfield services industry. It positions SLB as a key innovator in environmentally conscious oil and gas extraction.
April 2023: QatarEnergy and Shell PLC agreed to explore the C-10 block offshore Mauritania. This development underscores the continued interest in offshore exploration and the potential for significant new oil and gas discoveries, creating new demand for specialized oilfield services in the region. The potential for significant investment and production increases strengthens the outlook for oilfield service providers active in offshore operations.
Strategic Outlook for Oilfield Services Industry Market
The oilfield services market is poised for continued growth, driven by sustained global energy demand, technological innovation, and investments in exploration and production activities. The adoption of digitalization, automation, and sustainable technologies will reshape the industry landscape, favoring companies with strong technological capabilities and a commitment to environmental stewardship. New market opportunities in unconventional resources and developing economies present lucrative avenues for expansion and growth. The forecast period is expected to witness increased market consolidation through mergers and acquisitions, resulting in a more concentrated but technologically advanced industry.
Oilfield Services Industry Segmentation
-
1. Service Type
- 1.1. Drilling Services
- 1.2. Completion Services
- 1.3. Production and Intervention Services
- 1.4. Other Services
-
2. Location of Deployment
- 2.1. Onshore
- 2.2. Offshore
Oilfield Services Industry Segmentation By Geography
-
1. North America
- 1.1. United States
- 1.2. Canada
- 1.3. Rest of North America
-
2. Europe
- 2.1. Germany
- 2.2. France
- 2.3. United Kingdom
- 2.4. Italy
- 2.5. Russia
- 2.6. Spain
- 2.7. NORDIC
- 2.8. Turkey
- 2.9. Rest of Europe
-
3. Asia Pacific
- 3.1. China
- 3.2. India
- 3.3. Japan
- 3.4. South Korea
- 3.5. Malaysia
- 3.6. Thailand
- 3.7. Vietnam
- 3.8. Rest of Asia Pacific
-
4. South America
- 4.1. Brazil
- 4.2. Argentina
- 4.3. Colombia
- 4.4. Rest of South America
-
5. Middle East and Africa
- 5.1. Saudi Arabia
- 5.2. United Arab Emirates
- 5.3. South Africa
- 5.4. Nigeria
- 5.5. Qatar
- 5.6. Egypt
- 5.7. Rest of the Middle East and Africa
Oilfield Services Industry REPORT HIGHLIGHTS
| Aspects | Details |
|---|---|
| Study Period | 2019-2033 |
| Base Year | 2024 |
| Estimated Year | 2025 |
| Forecast Period | 2025-2033 |
| Historical Period | 2019-2024 |
| Growth Rate | CAGR of 5.83% from 2019-2033 |
| Segmentation |
|
Table of Contents
- 1. Introduction
- 1.1. Research Scope
- 1.2. Market Segmentation
- 1.3. Research Methodology
- 1.4. Definitions and Assumptions
- 2. Executive Summary
- 2.1. Introduction
- 3. Market Dynamics
- 3.1. Introduction
- 3.2. Market Drivers
- 3.2.1 4.; Increasing Development of Gas Reserves and Advanced Technology
- 3.2.2 Tools
- 3.2.3 and Equipment4.; Increasing Investment in the Oilfield Services across World
- 3.3. Market Restrains
- 3.3.1 4.; The Volatile Oil Prices Over the Recent Period
- 3.3.2 Owing to the Supply-Demand Gap
- 3.4. Market Trends
- 3.4.1. Drilling Services Are Expected to Dominate the Market
- 4. Market Factor Analysis
- 4.1. Porters Five Forces
- 4.2. Supply/Value Chain
- 4.3. PESTEL analysis
- 4.4. Market Entropy
- 4.5. Patent/Trademark Analysis
- 5. Global Oilfield Services Industry Analysis, Insights and Forecast, 2019-2031
- 5.1. Market Analysis, Insights and Forecast - by Service Type
- 5.1.1. Drilling Services
- 5.1.2. Completion Services
- 5.1.3. Production and Intervention Services
- 5.1.4. Other Services
- 5.2. Market Analysis, Insights and Forecast - by Location of Deployment
- 5.2.1. Onshore
- 5.2.2. Offshore
- 5.3. Market Analysis, Insights and Forecast - by Region
- 5.3.1. North America
- 5.3.2. Europe
- 5.3.3. Asia Pacific
- 5.3.4. South America
- 5.3.5. Middle East and Africa
- 5.1. Market Analysis, Insights and Forecast - by Service Type
- 6. North America Oilfield Services Industry Analysis, Insights and Forecast, 2019-2031
- 6.1. Market Analysis, Insights and Forecast - by Service Type
- 6.1.1. Drilling Services
- 6.1.2. Completion Services
- 6.1.3. Production and Intervention Services
- 6.1.4. Other Services
- 6.2. Market Analysis, Insights and Forecast - by Location of Deployment
- 6.2.1. Onshore
- 6.2.2. Offshore
- 6.1. Market Analysis, Insights and Forecast - by Service Type
- 7. Europe Oilfield Services Industry Analysis, Insights and Forecast, 2019-2031
- 7.1. Market Analysis, Insights and Forecast - by Service Type
- 7.1.1. Drilling Services
- 7.1.2. Completion Services
- 7.1.3. Production and Intervention Services
- 7.1.4. Other Services
- 7.2. Market Analysis, Insights and Forecast - by Location of Deployment
- 7.2.1. Onshore
- 7.2.2. Offshore
- 7.1. Market Analysis, Insights and Forecast - by Service Type
- 8. Asia Pacific Oilfield Services Industry Analysis, Insights and Forecast, 2019-2031
- 8.1. Market Analysis, Insights and Forecast - by Service Type
- 8.1.1. Drilling Services
- 8.1.2. Completion Services
- 8.1.3. Production and Intervention Services
- 8.1.4. Other Services
- 8.2. Market Analysis, Insights and Forecast - by Location of Deployment
- 8.2.1. Onshore
- 8.2.2. Offshore
- 8.1. Market Analysis, Insights and Forecast - by Service Type
- 9. South America Oilfield Services Industry Analysis, Insights and Forecast, 2019-2031
- 9.1. Market Analysis, Insights and Forecast - by Service Type
- 9.1.1. Drilling Services
- 9.1.2. Completion Services
- 9.1.3. Production and Intervention Services
- 9.1.4. Other Services
- 9.2. Market Analysis, Insights and Forecast - by Location of Deployment
- 9.2.1. Onshore
- 9.2.2. Offshore
- 9.1. Market Analysis, Insights and Forecast - by Service Type
- 10. Middle East and Africa Oilfield Services Industry Analysis, Insights and Forecast, 2019-2031
- 10.1. Market Analysis, Insights and Forecast - by Service Type
- 10.1.1. Drilling Services
- 10.1.2. Completion Services
- 10.1.3. Production and Intervention Services
- 10.1.4. Other Services
- 10.2. Market Analysis, Insights and Forecast - by Location of Deployment
- 10.2.1. Onshore
- 10.2.2. Offshore
- 10.1. Market Analysis, Insights and Forecast - by Service Type
- 11. North America Oilfield Services Industry Analysis, Insights and Forecast, 2019-2031
- 11.1. Market Analysis, Insights and Forecast - By Country/Sub-region
- 11.1.1 United States
- 11.1.2 Canada
- 11.1.3 Mexico
- 12. Europe Oilfield Services Industry Analysis, Insights and Forecast, 2019-2031
- 12.1. Market Analysis, Insights and Forecast - By Country/Sub-region
- 12.1.1 Germany
- 12.1.2 United Kingdom
- 12.1.3 France
- 12.1.4 Spain
- 12.1.5 Italy
- 12.1.6 Spain
- 12.1.7 Belgium
- 12.1.8 Netherland
- 12.1.9 Nordics
- 12.1.10 Rest of Europe
- 13. Asia Pacific Oilfield Services Industry Analysis, Insights and Forecast, 2019-2031
- 13.1. Market Analysis, Insights and Forecast - By Country/Sub-region
- 13.1.1 China
- 13.1.2 Japan
- 13.1.3 India
- 13.1.4 South Korea
- 13.1.5 Southeast Asia
- 13.1.6 Australia
- 13.1.7 Indonesia
- 13.1.8 Phillipes
- 13.1.9 Singapore
- 13.1.10 Thailandc
- 13.1.11 Rest of Asia Pacific
- 14. South America Oilfield Services Industry Analysis, Insights and Forecast, 2019-2031
- 14.1. Market Analysis, Insights and Forecast - By Country/Sub-region
- 14.1.1 Brazil
- 14.1.2 Argentina
- 14.1.3 Peru
- 14.1.4 Chile
- 14.1.5 Colombia
- 14.1.6 Ecuador
- 14.1.7 Venezuela
- 14.1.8 Rest of South America
- 15. MEA Oilfield Services Industry Analysis, Insights and Forecast, 2019-2031
- 15.1. Market Analysis, Insights and Forecast - By Country/Sub-region
- 15.1.1 United Arab Emirates
- 15.1.2 Saudi Arabia
- 15.1.3 South Africa
- 15.1.4 Rest of Middle East and Africa
- 16. Competitive Analysis
- 16.1. Global Market Share Analysis 2024
- 16.2. Company Profiles
- 16.2.1 Expro Group
- 16.2.1.1. Overview
- 16.2.1.2. Products
- 16.2.1.3. SWOT Analysis
- 16.2.1.4. Recent Developments
- 16.2.1.5. Financials (Based on Availability)
- 16.2.2 Basic Energy Services Inc
- 16.2.2.1. Overview
- 16.2.2.2. Products
- 16.2.2.3. SWOT Analysis
- 16.2.2.4. Recent Developments
- 16.2.2.5. Financials (Based on Availability)
- 16.2.3 Nabors Industries Inc
- 16.2.3.1. Overview
- 16.2.3.2. Products
- 16.2.3.3. SWOT Analysis
- 16.2.3.4. Recent Developments
- 16.2.3.5. Financials (Based on Availability)
- 16.2.4 Weatherford International PLC
- 16.2.4.1. Overview
- 16.2.4.2. Products
- 16.2.4.3. SWOT Analysis
- 16.2.4.4. Recent Developments
- 16.2.4.5. Financials (Based on Availability)
- 16.2.5 Transocean Ltd
- 16.2.5.1. Overview
- 16.2.5.2. Products
- 16.2.5.3. SWOT Analysis
- 16.2.5.4. Recent Developments
- 16.2.5.5. Financials (Based on Availability)
- 16.2.6 Baker Hughes Company
- 16.2.6.1. Overview
- 16.2.6.2. Products
- 16.2.6.3. SWOT Analysis
- 16.2.6.4. Recent Developments
- 16.2.6.5. Financials (Based on Availability)
- 16.2.7 China Oilfield Services Limited
- 16.2.7.1. Overview
- 16.2.7.2. Products
- 16.2.7.3. SWOT Analysis
- 16.2.7.4. Recent Developments
- 16.2.7.5. Financials (Based on Availability)
- 16.2.8 Halliburton Company
- 16.2.8.1. Overview
- 16.2.8.2. Products
- 16.2.8.3. SWOT Analysis
- 16.2.8.4. Recent Developments
- 16.2.8.5. Financials (Based on Availability)
- 16.2.9 OiLSERV
- 16.2.9.1. Overview
- 16.2.9.2. Products
- 16.2.9.3. SWOT Analysis
- 16.2.9.4. Recent Developments
- 16.2.9.5. Financials (Based on Availability)
- 16.2.10 Schlumberger Limited
- 16.2.10.1. Overview
- 16.2.10.2. Products
- 16.2.10.3. SWOT Analysis
- 16.2.10.4. Recent Developments
- 16.2.10.5. Financials (Based on Availability)
- 16.2.11 Valaris PLC
- 16.2.11.1. Overview
- 16.2.11.2. Products
- 16.2.11.3. SWOT Analysis
- 16.2.11.4. Recent Developments
- 16.2.11.5. Financials (Based on Availability)
- 16.2.1 Expro Group
List of Figures
- Figure 1: Global Oilfield Services Industry Revenue Breakdown (Million, %) by Region 2024 & 2032
- Figure 2: North America Oilfield Services Industry Revenue (Million), by Country 2024 & 2032
- Figure 3: North America Oilfield Services Industry Revenue Share (%), by Country 2024 & 2032
- Figure 4: Europe Oilfield Services Industry Revenue (Million), by Country 2024 & 2032
- Figure 5: Europe Oilfield Services Industry Revenue Share (%), by Country 2024 & 2032
- Figure 6: Asia Pacific Oilfield Services Industry Revenue (Million), by Country 2024 & 2032
- Figure 7: Asia Pacific Oilfield Services Industry Revenue Share (%), by Country 2024 & 2032
- Figure 8: South America Oilfield Services Industry Revenue (Million), by Country 2024 & 2032
- Figure 9: South America Oilfield Services Industry Revenue Share (%), by Country 2024 & 2032
- Figure 10: MEA Oilfield Services Industry Revenue (Million), by Country 2024 & 2032
- Figure 11: MEA Oilfield Services Industry Revenue Share (%), by Country 2024 & 2032
- Figure 12: North America Oilfield Services Industry Revenue (Million), by Service Type 2024 & 2032
- Figure 13: North America Oilfield Services Industry Revenue Share (%), by Service Type 2024 & 2032
- Figure 14: North America Oilfield Services Industry Revenue (Million), by Location of Deployment 2024 & 2032
- Figure 15: North America Oilfield Services Industry Revenue Share (%), by Location of Deployment 2024 & 2032
- Figure 16: North America Oilfield Services Industry Revenue (Million), by Country 2024 & 2032
- Figure 17: North America Oilfield Services Industry Revenue Share (%), by Country 2024 & 2032
- Figure 18: Europe Oilfield Services Industry Revenue (Million), by Service Type 2024 & 2032
- Figure 19: Europe Oilfield Services Industry Revenue Share (%), by Service Type 2024 & 2032
- Figure 20: Europe Oilfield Services Industry Revenue (Million), by Location of Deployment 2024 & 2032
- Figure 21: Europe Oilfield Services Industry Revenue Share (%), by Location of Deployment 2024 & 2032
- Figure 22: Europe Oilfield Services Industry Revenue (Million), by Country 2024 & 2032
- Figure 23: Europe Oilfield Services Industry Revenue Share (%), by Country 2024 & 2032
- Figure 24: Asia Pacific Oilfield Services Industry Revenue (Million), by Service Type 2024 & 2032
- Figure 25: Asia Pacific Oilfield Services Industry Revenue Share (%), by Service Type 2024 & 2032
- Figure 26: Asia Pacific Oilfield Services Industry Revenue (Million), by Location of Deployment 2024 & 2032
- Figure 27: Asia Pacific Oilfield Services Industry Revenue Share (%), by Location of Deployment 2024 & 2032
- Figure 28: Asia Pacific Oilfield Services Industry Revenue (Million), by Country 2024 & 2032
- Figure 29: Asia Pacific Oilfield Services Industry Revenue Share (%), by Country 2024 & 2032
- Figure 30: South America Oilfield Services Industry Revenue (Million), by Service Type 2024 & 2032
- Figure 31: South America Oilfield Services Industry Revenue Share (%), by Service Type 2024 & 2032
- Figure 32: South America Oilfield Services Industry Revenue (Million), by Location of Deployment 2024 & 2032
- Figure 33: South America Oilfield Services Industry Revenue Share (%), by Location of Deployment 2024 & 2032
- Figure 34: South America Oilfield Services Industry Revenue (Million), by Country 2024 & 2032
- Figure 35: South America Oilfield Services Industry Revenue Share (%), by Country 2024 & 2032
- Figure 36: Middle East and Africa Oilfield Services Industry Revenue (Million), by Service Type 2024 & 2032
- Figure 37: Middle East and Africa Oilfield Services Industry Revenue Share (%), by Service Type 2024 & 2032
- Figure 38: Middle East and Africa Oilfield Services Industry Revenue (Million), by Location of Deployment 2024 & 2032
- Figure 39: Middle East and Africa Oilfield Services Industry Revenue Share (%), by Location of Deployment 2024 & 2032
- Figure 40: Middle East and Africa Oilfield Services Industry Revenue (Million), by Country 2024 & 2032
- Figure 41: Middle East and Africa Oilfield Services Industry Revenue Share (%), by Country 2024 & 2032
List of Tables
- Table 1: Global Oilfield Services Industry Revenue Million Forecast, by Region 2019 & 2032
- Table 2: Global Oilfield Services Industry Revenue Million Forecast, by Service Type 2019 & 2032
- Table 3: Global Oilfield Services Industry Revenue Million Forecast, by Location of Deployment 2019 & 2032
- Table 4: Global Oilfield Services Industry Revenue Million Forecast, by Region 2019 & 2032
- Table 5: Global Oilfield Services Industry Revenue Million Forecast, by Country 2019 & 2032
- Table 6: United States Oilfield Services Industry Revenue (Million) Forecast, by Application 2019 & 2032
- Table 7: Canada Oilfield Services Industry Revenue (Million) Forecast, by Application 2019 & 2032
- Table 8: Mexico Oilfield Services Industry Revenue (Million) Forecast, by Application 2019 & 2032
- Table 9: Global Oilfield Services Industry Revenue Million Forecast, by Country 2019 & 2032
- Table 10: Germany Oilfield Services Industry Revenue (Million) Forecast, by Application 2019 & 2032
- Table 11: United Kingdom Oilfield Services Industry Revenue (Million) Forecast, by Application 2019 & 2032
- Table 12: France Oilfield Services Industry Revenue (Million) Forecast, by Application 2019 & 2032
- Table 13: Spain Oilfield Services Industry Revenue (Million) Forecast, by Application 2019 & 2032
- Table 14: Italy Oilfield Services Industry Revenue (Million) Forecast, by Application 2019 & 2032
- Table 15: Spain Oilfield Services Industry Revenue (Million) Forecast, by Application 2019 & 2032
- Table 16: Belgium Oilfield Services Industry Revenue (Million) Forecast, by Application 2019 & 2032
- Table 17: Netherland Oilfield Services Industry Revenue (Million) Forecast, by Application 2019 & 2032
- Table 18: Nordics Oilfield Services Industry Revenue (Million) Forecast, by Application 2019 & 2032
- Table 19: Rest of Europe Oilfield Services Industry Revenue (Million) Forecast, by Application 2019 & 2032
- Table 20: Global Oilfield Services Industry Revenue Million Forecast, by Country 2019 & 2032
- Table 21: China Oilfield Services Industry Revenue (Million) Forecast, by Application 2019 & 2032
- Table 22: Japan Oilfield Services Industry Revenue (Million) Forecast, by Application 2019 & 2032
- Table 23: India Oilfield Services Industry Revenue (Million) Forecast, by Application 2019 & 2032
- Table 24: South Korea Oilfield Services Industry Revenue (Million) Forecast, by Application 2019 & 2032
- Table 25: Southeast Asia Oilfield Services Industry Revenue (Million) Forecast, by Application 2019 & 2032
- Table 26: Australia Oilfield Services Industry Revenue (Million) Forecast, by Application 2019 & 2032
- Table 27: Indonesia Oilfield Services Industry Revenue (Million) Forecast, by Application 2019 & 2032
- Table 28: Phillipes Oilfield Services Industry Revenue (Million) Forecast, by Application 2019 & 2032
- Table 29: Singapore Oilfield Services Industry Revenue (Million) Forecast, by Application 2019 & 2032
- Table 30: Thailandc Oilfield Services Industry Revenue (Million) Forecast, by Application 2019 & 2032
- Table 31: Rest of Asia Pacific Oilfield Services Industry Revenue (Million) Forecast, by Application 2019 & 2032
- Table 32: Global Oilfield Services Industry Revenue Million Forecast, by Country 2019 & 2032
- Table 33: Brazil Oilfield Services Industry Revenue (Million) Forecast, by Application 2019 & 2032
- Table 34: Argentina Oilfield Services Industry Revenue (Million) Forecast, by Application 2019 & 2032
- Table 35: Peru Oilfield Services Industry Revenue (Million) Forecast, by Application 2019 & 2032
- Table 36: Chile Oilfield Services Industry Revenue (Million) Forecast, by Application 2019 & 2032
- Table 37: Colombia Oilfield Services Industry Revenue (Million) Forecast, by Application 2019 & 2032
- Table 38: Ecuador Oilfield Services Industry Revenue (Million) Forecast, by Application 2019 & 2032
- Table 39: Venezuela Oilfield Services Industry Revenue (Million) Forecast, by Application 2019 & 2032
- Table 40: Rest of South America Oilfield Services Industry Revenue (Million) Forecast, by Application 2019 & 2032
- Table 41: Global Oilfield Services Industry Revenue Million Forecast, by Country 2019 & 2032
- Table 42: United Arab Emirates Oilfield Services Industry Revenue (Million) Forecast, by Application 2019 & 2032
- Table 43: Saudi Arabia Oilfield Services Industry Revenue (Million) Forecast, by Application 2019 & 2032
- Table 44: South Africa Oilfield Services Industry Revenue (Million) Forecast, by Application 2019 & 2032
- Table 45: Rest of Middle East and Africa Oilfield Services Industry Revenue (Million) Forecast, by Application 2019 & 2032
- Table 46: Global Oilfield Services Industry Revenue Million Forecast, by Service Type 2019 & 2032
- Table 47: Global Oilfield Services Industry Revenue Million Forecast, by Location of Deployment 2019 & 2032
- Table 48: Global Oilfield Services Industry Revenue Million Forecast, by Country 2019 & 2032
- Table 49: United States Oilfield Services Industry Revenue (Million) Forecast, by Application 2019 & 2032
- Table 50: Canada Oilfield Services Industry Revenue (Million) Forecast, by Application 2019 & 2032
- Table 51: Rest of North America Oilfield Services Industry Revenue (Million) Forecast, by Application 2019 & 2032
- Table 52: Global Oilfield Services Industry Revenue Million Forecast, by Service Type 2019 & 2032
- Table 53: Global Oilfield Services Industry Revenue Million Forecast, by Location of Deployment 2019 & 2032
- Table 54: Global Oilfield Services Industry Revenue Million Forecast, by Country 2019 & 2032
- Table 55: Germany Oilfield Services Industry Revenue (Million) Forecast, by Application 2019 & 2032
- Table 56: France Oilfield Services Industry Revenue (Million) Forecast, by Application 2019 & 2032
- Table 57: United Kingdom Oilfield Services Industry Revenue (Million) Forecast, by Application 2019 & 2032
- Table 58: Italy Oilfield Services Industry Revenue (Million) Forecast, by Application 2019 & 2032
- Table 59: Russia Oilfield Services Industry Revenue (Million) Forecast, by Application 2019 & 2032
- Table 60: Spain Oilfield Services Industry Revenue (Million) Forecast, by Application 2019 & 2032
- Table 61: NORDIC Oilfield Services Industry Revenue (Million) Forecast, by Application 2019 & 2032
- Table 62: Turkey Oilfield Services Industry Revenue (Million) Forecast, by Application 2019 & 2032
- Table 63: Rest of Europe Oilfield Services Industry Revenue (Million) Forecast, by Application 2019 & 2032
- Table 64: Global Oilfield Services Industry Revenue Million Forecast, by Service Type 2019 & 2032
- Table 65: Global Oilfield Services Industry Revenue Million Forecast, by Location of Deployment 2019 & 2032
- Table 66: Global Oilfield Services Industry Revenue Million Forecast, by Country 2019 & 2032
- Table 67: China Oilfield Services Industry Revenue (Million) Forecast, by Application 2019 & 2032
- Table 68: India Oilfield Services Industry Revenue (Million) Forecast, by Application 2019 & 2032
- Table 69: Japan Oilfield Services Industry Revenue (Million) Forecast, by Application 2019 & 2032
- Table 70: South Korea Oilfield Services Industry Revenue (Million) Forecast, by Application 2019 & 2032
- Table 71: Malaysia Oilfield Services Industry Revenue (Million) Forecast, by Application 2019 & 2032
- Table 72: Thailand Oilfield Services Industry Revenue (Million) Forecast, by Application 2019 & 2032
- Table 73: Vietnam Oilfield Services Industry Revenue (Million) Forecast, by Application 2019 & 2032
- Table 74: Rest of Asia Pacific Oilfield Services Industry Revenue (Million) Forecast, by Application 2019 & 2032
- Table 75: Global Oilfield Services Industry Revenue Million Forecast, by Service Type 2019 & 2032
- Table 76: Global Oilfield Services Industry Revenue Million Forecast, by Location of Deployment 2019 & 2032
- Table 77: Global Oilfield Services Industry Revenue Million Forecast, by Country 2019 & 2032
- Table 78: Brazil Oilfield Services Industry Revenue (Million) Forecast, by Application 2019 & 2032
- Table 79: Argentina Oilfield Services Industry Revenue (Million) Forecast, by Application 2019 & 2032
- Table 80: Colombia Oilfield Services Industry Revenue (Million) Forecast, by Application 2019 & 2032
- Table 81: Rest of South America Oilfield Services Industry Revenue (Million) Forecast, by Application 2019 & 2032
- Table 82: Global Oilfield Services Industry Revenue Million Forecast, by Service Type 2019 & 2032
- Table 83: Global Oilfield Services Industry Revenue Million Forecast, by Location of Deployment 2019 & 2032
- Table 84: Global Oilfield Services Industry Revenue Million Forecast, by Country 2019 & 2032
- Table 85: Saudi Arabia Oilfield Services Industry Revenue (Million) Forecast, by Application 2019 & 2032
- Table 86: United Arab Emirates Oilfield Services Industry Revenue (Million) Forecast, by Application 2019 & 2032
- Table 87: South Africa Oilfield Services Industry Revenue (Million) Forecast, by Application 2019 & 2032
- Table 88: Nigeria Oilfield Services Industry Revenue (Million) Forecast, by Application 2019 & 2032
- Table 89: Qatar Oilfield Services Industry Revenue (Million) Forecast, by Application 2019 & 2032
- Table 90: Egypt Oilfield Services Industry Revenue (Million) Forecast, by Application 2019 & 2032
- Table 91: Rest of the Middle East and Africa Oilfield Services Industry Revenue (Million) Forecast, by Application 2019 & 2032
Frequently Asked Questions
1. What is the projected Compound Annual Growth Rate (CAGR) of the Oilfield Services Industry?
The projected CAGR is approximately 5.83%.
2. Which companies are prominent players in the Oilfield Services Industry?
Key companies in the market include Expro Group, Basic Energy Services Inc, Nabors Industries Inc, Weatherford International PLC, Transocean Ltd, Baker Hughes Company, China Oilfield Services Limited, Halliburton Company, OiLSERV, Schlumberger Limited, Valaris PLC.
3. What are the main segments of the Oilfield Services Industry?
The market segments include Service Type, Location of Deployment.
4. Can you provide details about the market size?
The market size is estimated to be USD 119.36 Million as of 2022.
5. What are some drivers contributing to market growth?
4.; Increasing Development of Gas Reserves and Advanced Technology. Tools. and Equipment4.; Increasing Investment in the Oilfield Services across World.
6. What are the notable trends driving market growth?
Drilling Services Are Expected to Dominate the Market.
7. Are there any restraints impacting market growth?
4.; The Volatile Oil Prices Over the Recent Period. Owing to the Supply-Demand Gap.
8. Can you provide examples of recent developments in the market?
September 2023: SLB signed a subsurface technology agreement with INEOS Energy, the energy division of INEOS, a global chemical and manufacturing company. INEOS Energy will partner with SLB’s Performance Centre in Aberdeen to collaborate and innovate subsurface technologies, including AI capabilities, to help it drive operational performance for continued growth, new acquisitions, and carbon capture and storage (CCS).
9. What pricing options are available for accessing the report?
Pricing options include single-user, multi-user, and enterprise licenses priced at USD 4750, USD 5250, and USD 8750 respectively.
10. Is the market size provided in terms of value or volume?
The market size is provided in terms of value, measured in Million.
11. Are there any specific market keywords associated with the report?
Yes, the market keyword associated with the report is "Oilfield Services Industry," which aids in identifying and referencing the specific market segment covered.
12. How do I determine which pricing option suits my needs best?
The pricing options vary based on user requirements and access needs. Individual users may opt for single-user licenses, while businesses requiring broader access may choose multi-user or enterprise licenses for cost-effective access to the report.
13. Are there any additional resources or data provided in the Oilfield Services Industry report?
While the report offers comprehensive insights, it's advisable to review the specific contents or supplementary materials provided to ascertain if additional resources or data are available.
14. How can I stay updated on further developments or reports in the Oilfield Services Industry?
To stay informed about further developments, trends, and reports in the Oilfield Services Industry, consider subscribing to industry newsletters, following relevant companies and organizations, or regularly checking reputable industry news sources and publications.
Methodology
Step 1 - Identification of Relevant Samples Size from Population Database


Step 2 - Approaches for Defining Global Market Size (Value, Volume* & Price*)

Note*: In applicable scenarios
Step 3 - Data Sources
Primary Research
- Web Analytics
- Survey Reports
- Research Institute
- Latest Research Reports
- Opinion Leaders
Secondary Research
- Annual Reports
- White Paper
- Latest Press Release
- Industry Association
- Paid Database
- Investor Presentations

Step 4 - Data Triangulation
Involves using different sources of information in order to increase the validity of a study
These sources are likely to be stakeholders in a program - participants, other researchers, program staff, other community members, and so on.
Then we put all data in single framework & apply various statistical tools to find out the dynamic on the market.
During the analysis stage, feedback from the stakeholder groups would be compared to determine areas of agreement as well as areas of divergence


