
Key Insights
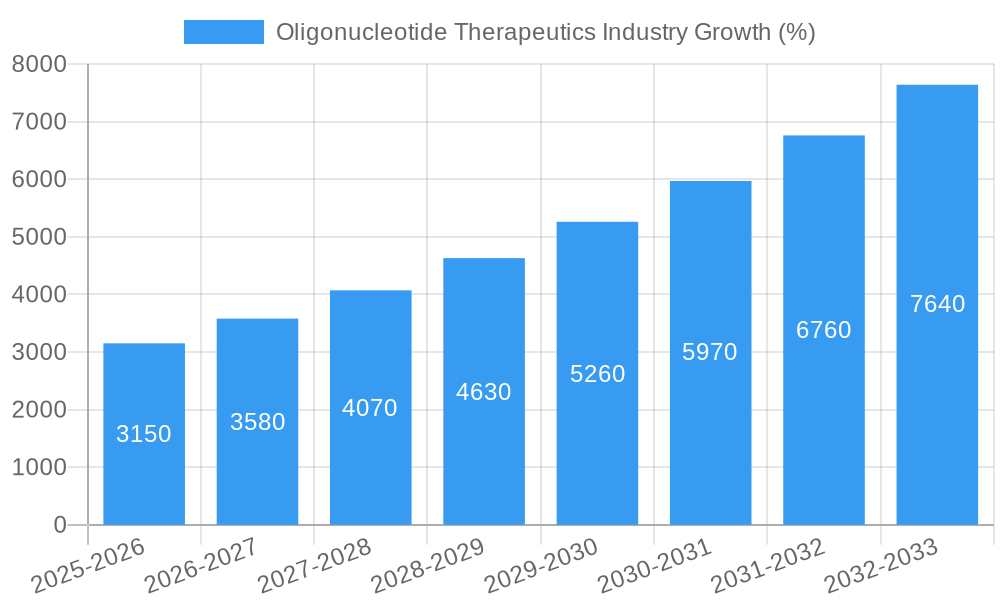
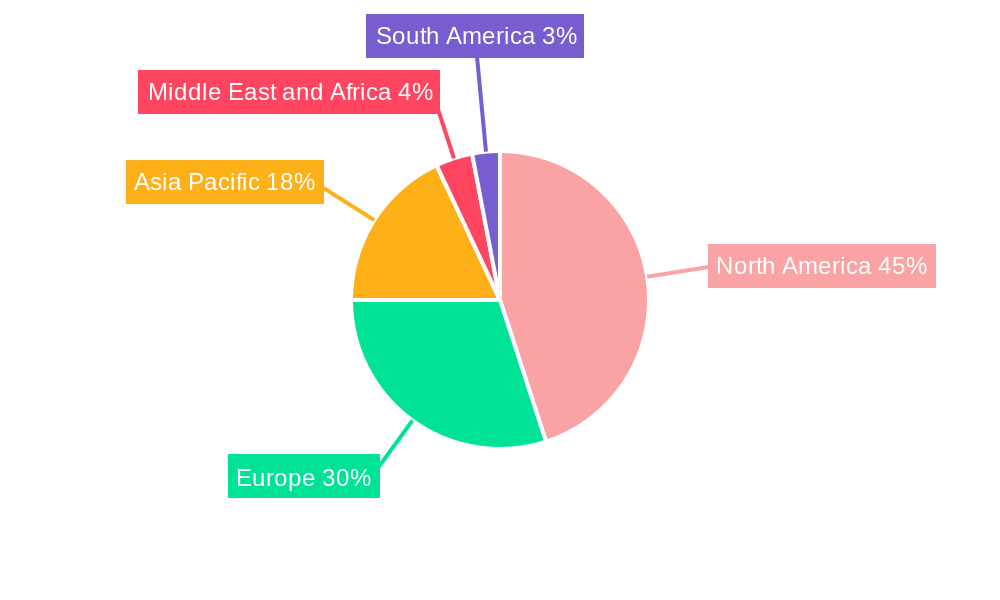
The oligonucleotide therapeutics market is experiencing robust growth, driven by advancements in oligonucleotide technology, increasing prevalence of genetic disorders, and the rising demand for personalized medicine. The market's Compound Annual Growth Rate (CAGR) of 12.30% from 2019 to 2024 indicates significant expansion, and this trajectory is projected to continue throughout the forecast period (2025-2033). Key drivers include the successful development and approval of several oligonucleotide-based drugs for various diseases, including rare genetic disorders and cancer. The increasing research and development investments by pharmaceutical and biotechnology companies, coupled with strategic partnerships and collaborations, further fuel market growth. Segment-wise, the therapeutic application segment holds the largest market share, followed by diagnostics and research. Within the end-user segment, pharmaceutical and biotechnology companies are the major consumers of oligonucleotide therapeutics, investing heavily in developing novel treatments. The market is geographically diverse, with North America and Europe currently dominating due to high healthcare expenditure and established research infrastructure. However, the Asia-Pacific region is expected to exhibit rapid growth in the coming years due to increasing awareness, rising disposable incomes, and improving healthcare facilities. While challenges remain, including high manufacturing costs, stringent regulatory approvals, and potential side effects associated with some oligonucleotide therapies, the overall market outlook remains positive, driven by continuous technological advancements and expanding therapeutic applications.
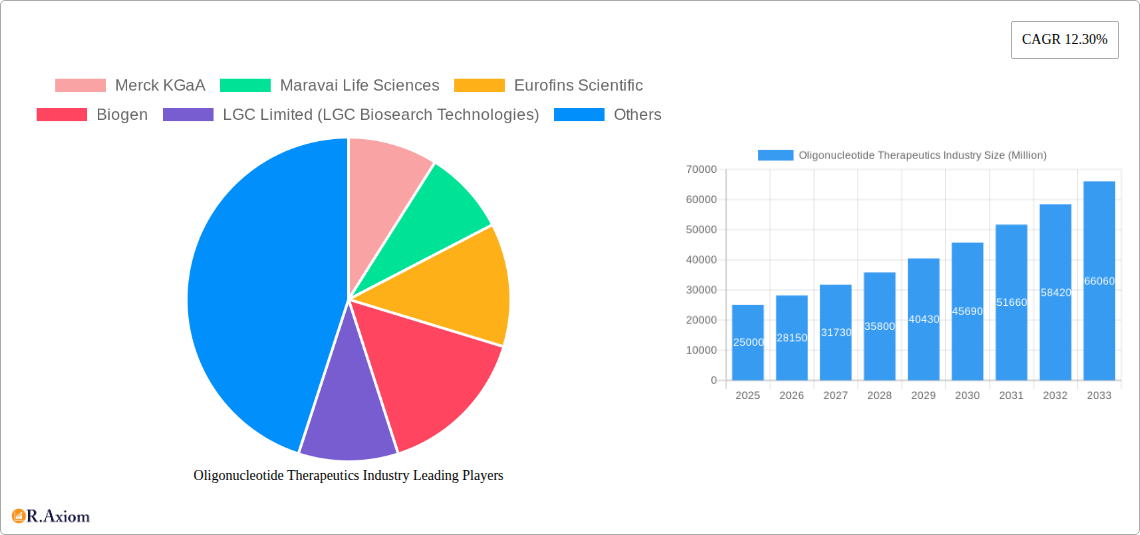
The competitive landscape is characterized by a mix of large multinational corporations and specialized oligonucleotide manufacturers. Companies like Merck KGaA, Maravai Life Sciences, and Thermo Fisher Scientific hold significant market share, leveraging their established expertise and extensive product portfolios. However, smaller, specialized companies are also making significant contributions through innovation and focused therapeutic areas. Future growth will likely be driven by advancements in delivery methods (e.g., improved lipid nanoparticles), the exploration of novel oligonucleotide chemistries, and the expansion of therapeutic applications into new disease areas. The industry is also witnessing a surge in the development of next-generation sequencing technologies which are expected to enhance drug discovery and clinical trials and therefore boost the market in the coming years.
Oligonucleotide Therapeutics Industry: A Comprehensive Market Report (2019-2033)
This detailed report provides a comprehensive analysis of the oligonucleotide therapeutics industry, encompassing market size, segmentation, growth drivers, challenges, and future outlook. It covers the period from 2019 to 2033, with a focus on 2025 as the base and estimated year. The report offers actionable insights for industry stakeholders, including manufacturers, researchers, investors, and regulatory bodies. The market is valued at xx Million in 2025 and is projected to reach xx Million by 2033, exhibiting a CAGR of xx% during the forecast period (2025-2033).
Oligonucleotide Therapeutics Industry Market Concentration & Innovation
The oligonucleotide therapeutics market is characterized by a moderately concentrated landscape, with a few major players holding significant market share. Merck KGaA, Thermo Fisher Scientific, and Danaher Corporation are among the leading companies, collectively accounting for approximately xx% of the market in 2025. However, the market also features numerous smaller players specializing in niche segments or specific technologies. Innovation is a key driver, fueled by advancements in oligonucleotide chemistry, delivery systems, and therapeutic applications. The regulatory landscape is evolving, with agencies like the FDA actively shaping the approval process for oligonucleotide-based therapies. The increasing prevalence of chronic diseases and growing demand for targeted therapies are major factors driving market growth. Significant M&A activity has been observed, with deals totaling xx Million in the last five years, reflecting industry consolidation and expansion strategies. Examples include the strategic collaboration between Bachem and Eli Lilly & Company (April 2022). Product substitution remains a moderate threat due to the emergence of alternative therapeutic modalities, and end-user trends indicate a strong preference for safer, more effective, and targeted treatment options.
- Market Share: Top 3 players hold approximately xx% in 2025.
- M&A Deal Value (2019-2024): xx Million
- Key Innovation Drivers: Advancements in oligonucleotide chemistry, delivery systems, and therapeutic applications.
- Regulatory Frameworks: Evolving approval processes from agencies like the FDA.
Oligonucleotide Therapeutics Industry Industry Trends & Insights
The oligonucleotide therapeutics market is experiencing robust growth driven by technological advancements, increasing prevalence of chronic diseases, and rising investments in research and development. Technological disruptions, such as CRISPR-Cas9 gene editing and improved delivery systems (e.g., lipid nanoparticles), have significantly expanded the therapeutic potential of oligonucleotides. Consumer preferences are shifting towards personalized and targeted therapies with minimal side effects, which further fuels the adoption of oligonucleotide-based treatments. Competitive dynamics are characterized by strategic collaborations, mergers and acquisitions, and a continuous race to develop novel oligonucleotide therapies. The market exhibits significant geographic variations, with North America and Europe currently dominating, while Asia-Pacific is poised for substantial growth. The market penetration of oligonucleotide therapeutics is increasing steadily, particularly in oncology and genetic disorders.
Dominant Markets & Segments in Oligonucleotide Therapeutics Industry
The North American region holds the largest market share, driven by high healthcare expenditure, robust research infrastructure, and the presence of major pharmaceutical and biotechnology companies. Within applications, the therapeutics segment is the most dominant, driven by the increasing approval and launch of oligonucleotide-based drugs. Among end-users, pharmaceutical and biotechnology companies are the largest consumers, primarily for drug development and manufacturing. Synthesized oligonucleotide products constitute the largest product type segment.
- Leading Region: North America
- Dominant Application Segment: Therapeutics
- Largest End-User: Pharmaceutical and Biotechnology Companies
- Largest Product Type: Synthesized Oligonucleotide Products
- Key Drivers (North America): High healthcare expenditure, robust R&D infrastructure, presence of major players.
Oligonucleotide Therapeutics Industry Product Developments
Recent product innovations focus on improved oligonucleotide design, targeted delivery systems, and enhanced therapeutic efficacy. Examples include the development of modified oligonucleotides with improved stability and reduced immunogenicity. These advances significantly expand the therapeutic applications of oligonucleotides, increasing market penetration and creating new opportunities for treatment of previously untreatable diseases. The market fit is strong due to the unmet needs in several therapeutic areas and the inherent advantages of targeted therapy offered by oligonucleotides.
Report Scope & Segmentation Analysis
This report segments the oligonucleotide therapeutics market by application (Research, Diagnostics, Therapeutics), end-user (Academic Research Institutes, Pharmaceutical and Biotechnology Companies, Hospital and Diagnostic Laboratories), and product type (Synthesized Oligonucleotide Products, Reagents, Equipment, Services). Each segment's growth trajectory is analyzed, considering market size, growth rate, and competitive dynamics. The report provides detailed forecasts for each segment during the study period (2019-2033).
- Application: The Therapeutics segment is expected to witness the highest CAGR during the forecast period.
- End-User: Pharmaceutical and Biotechnology Companies are projected to dominate the market.
- Product Type: Synthesized Oligonucleotide Products segment will continue to hold a significant share.
Key Drivers of Oligonucleotide Therapeutics Industry Growth
Several key factors are driving the growth of the oligonucleotide therapeutics industry. These include the increasing prevalence of chronic diseases such as cancer and genetic disorders, ongoing technological advancements that improve oligonucleotide design, stability, and delivery methods, and growing investments in research and development. Favorable regulatory frameworks that streamline the approval process for novel oligonucleotide-based therapeutics also contribute to the market expansion. Furthermore, the rising demand for personalized medicine and the successful launch of several oligonucleotide-based drugs in recent years are adding momentum.
Challenges in the Oligonucleotide Therapeutics Industry Sector
The oligonucleotide therapeutics industry faces several challenges, including high research and development costs, complex manufacturing processes, stringent regulatory approvals, and potential side effects associated with some oligonucleotide-based therapies. Supply chain disruptions and the emergence of alternative therapeutic modalities also pose challenges. Competition is intense among established players and emerging biotech companies, influencing pricing strategies and market share. The difficulty in achieving efficient delivery to the target site and immune responses associated with some oligonucleotide therapies also hinder widespread adoption.
Emerging Opportunities in Oligonucleotide Therapeutics Industry
Several emerging opportunities exist within the oligonucleotide therapeutics industry. These include the development of new therapeutic applications for oligonucleotides, such as gene editing and RNA interference, the development of advanced drug delivery systems to improve efficacy and reduce side effects, and the expansion into new geographical markets with unmet needs. The growing focus on personalized medicine and biomarker discovery is opening up new avenues for oligonucleotide-based therapies. Advances in AI and machine learning offer possibilities for optimized oligonucleotide design and improved treatment strategies.
Leading Players in the Oligonucleotide Therapeutics Industry Market
- Merck KGaA
- Maravai Life Sciences
- Eurofins Scientific
- Biogen
- LGC Limited (LGC Biosearch Technologies)
- Danaher Corporation
- GenScript
- Sarepta Therapeutics Inc
- Thermo Fisher Scientific
- Bio-Synthesis Inc
- Agilent Technologies
- Kaneka Corporation (Eurogentec)
Key Developments in Oligonucleotide Therapeutics Industry Industry
- July 2022: WuXi STA launched a new large-scale oligonucleotide and peptide manufacturing facility, enhancing capacity for oligonucleotide therapeutics development and manufacturing.
- April 2022: Bachem entered a strategic collaboration with Eli Lilly & Company to develop and manufacture oligonucleotide-based active pharmaceutical ingredients, furthering innovation in oligonucleotide manufacturing technology.
Strategic Outlook for Oligonucleotide Therapeutics Industry Market
The oligonucleotide therapeutics market is poised for substantial growth over the next decade, driven by continued technological advancements, increasing demand for targeted therapies, and a growing understanding of the underlying mechanisms of various diseases. The emergence of novel oligonucleotide-based drugs and the ongoing development of improved delivery systems will fuel market expansion. Strategic collaborations and investments in research and development will further propel the industry's growth trajectory, solidifying its position as a pivotal therapeutic modality.
Oligonucleotide Therapeutics Industry Segmentation
-
1. Product Type
- 1.1. Synthesized Oligonucleotide Products
- 1.2. Reagents
- 1.3. Equipment
- 1.4. Services
-
2. Application
- 2.1. Research
- 2.2. Diagnostics
- 2.3. Therapeutics
-
3. End-user
- 3.1. Academic Research Institutes
- 3.2. Pharmaceutical and Biotechnology Companies
- 3.3. Hospital and Diagnostic Laboratories
Oligonucleotide Therapeutics Industry Segmentation By Geography
-
1. North America
- 1.1. United States
- 1.2. Canada
- 1.3. Mexico
-
2. Europe
- 2.1. Germany
- 2.2. United Kingdom
- 2.3. France
- 2.4. Italy
- 2.5. Spain
- 2.6. Rest of Europe
-
3. Asia Pacific
- 3.1. China
- 3.2. Japan
- 3.3. India
- 3.4. Australia
- 3.5. South Korea
- 3.6. Rest of Asia Pacific
-
4. Middle East and Africa
- 4.1. GCC
- 4.2. South Africa
- 4.3. Rest of Middle East and Africa
-
5. South America
- 5.1. Brazil
- 5.2. Argentina
- 5.3. Rest of South America
Oligonucleotide Therapeutics Industry REPORT HIGHLIGHTS
| Aspects | Details |
|---|---|
| Study Period | 2019-2033 |
| Base Year | 2024 |
| Estimated Year | 2025 |
| Forecast Period | 2025-2033 |
| Historical Period | 2019-2024 |
| Growth Rate | CAGR of 12.30% from 2019-2033 |
| Segmentation |
|
Table of Contents
- 1. Introduction
- 1.1. Research Scope
- 1.2. Market Segmentation
- 1.3. Research Methodology
- 1.4. Definitions and Assumptions
- 2. Executive Summary
- 2.1. Introduction
- 3. Market Dynamics
- 3.1. Introduction
- 3.2. Market Drivers
- 3.2.1. Increasing Government Investments and R&D Expenditure in Pharmaceutical and Biotechnology Companies; The Use of Synthesized Oligonucleotides in Molecular Diagnostics and Clinical Applications
- 3.3. Market Restrains
- 3.3.1. High Treatment Cost of Oligonucleotides; Lack of Skilled Professionals and Research Support in Undeveloped Countries
- 3.4. Market Trends
- 3.4.1. Therapeutic Segment Expected to Register a High CAGR
- 4. Market Factor Analysis
- 4.1. Porters Five Forces
- 4.2. Supply/Value Chain
- 4.3. PESTEL analysis
- 4.4. Market Entropy
- 4.5. Patent/Trademark Analysis
- 5. Global Oligonucleotide Therapeutics Industry Analysis, Insights and Forecast, 2019-2031
- 5.1. Market Analysis, Insights and Forecast - by Product Type
- 5.1.1. Synthesized Oligonucleotide Products
- 5.1.2. Reagents
- 5.1.3. Equipment
- 5.1.4. Services
- 5.2. Market Analysis, Insights and Forecast - by Application
- 5.2.1. Research
- 5.2.2. Diagnostics
- 5.2.3. Therapeutics
- 5.3. Market Analysis, Insights and Forecast - by End-user
- 5.3.1. Academic Research Institutes
- 5.3.2. Pharmaceutical and Biotechnology Companies
- 5.3.3. Hospital and Diagnostic Laboratories
- 5.4. Market Analysis, Insights and Forecast - by Region
- 5.4.1. North America
- 5.4.2. Europe
- 5.4.3. Asia Pacific
- 5.4.4. Middle East and Africa
- 5.4.5. South America
- 5.1. Market Analysis, Insights and Forecast - by Product Type
- 6. North America Oligonucleotide Therapeutics Industry Analysis, Insights and Forecast, 2019-2031
- 6.1. Market Analysis, Insights and Forecast - by Product Type
- 6.1.1. Synthesized Oligonucleotide Products
- 6.1.2. Reagents
- 6.1.3. Equipment
- 6.1.4. Services
- 6.2. Market Analysis, Insights and Forecast - by Application
- 6.2.1. Research
- 6.2.2. Diagnostics
- 6.2.3. Therapeutics
- 6.3. Market Analysis, Insights and Forecast - by End-user
- 6.3.1. Academic Research Institutes
- 6.3.2. Pharmaceutical and Biotechnology Companies
- 6.3.3. Hospital and Diagnostic Laboratories
- 6.1. Market Analysis, Insights and Forecast - by Product Type
- 7. Europe Oligonucleotide Therapeutics Industry Analysis, Insights and Forecast, 2019-2031
- 7.1. Market Analysis, Insights and Forecast - by Product Type
- 7.1.1. Synthesized Oligonucleotide Products
- 7.1.2. Reagents
- 7.1.3. Equipment
- 7.1.4. Services
- 7.2. Market Analysis, Insights and Forecast - by Application
- 7.2.1. Research
- 7.2.2. Diagnostics
- 7.2.3. Therapeutics
- 7.3. Market Analysis, Insights and Forecast - by End-user
- 7.3.1. Academic Research Institutes
- 7.3.2. Pharmaceutical and Biotechnology Companies
- 7.3.3. Hospital and Diagnostic Laboratories
- 7.1. Market Analysis, Insights and Forecast - by Product Type
- 8. Asia Pacific Oligonucleotide Therapeutics Industry Analysis, Insights and Forecast, 2019-2031
- 8.1. Market Analysis, Insights and Forecast - by Product Type
- 8.1.1. Synthesized Oligonucleotide Products
- 8.1.2. Reagents
- 8.1.3. Equipment
- 8.1.4. Services
- 8.2. Market Analysis, Insights and Forecast - by Application
- 8.2.1. Research
- 8.2.2. Diagnostics
- 8.2.3. Therapeutics
- 8.3. Market Analysis, Insights and Forecast - by End-user
- 8.3.1. Academic Research Institutes
- 8.3.2. Pharmaceutical and Biotechnology Companies
- 8.3.3. Hospital and Diagnostic Laboratories
- 8.1. Market Analysis, Insights and Forecast - by Product Type
- 9. Middle East and Africa Oligonucleotide Therapeutics Industry Analysis, Insights and Forecast, 2019-2031
- 9.1. Market Analysis, Insights and Forecast - by Product Type
- 9.1.1. Synthesized Oligonucleotide Products
- 9.1.2. Reagents
- 9.1.3. Equipment
- 9.1.4. Services
- 9.2. Market Analysis, Insights and Forecast - by Application
- 9.2.1. Research
- 9.2.2. Diagnostics
- 9.2.3. Therapeutics
- 9.3. Market Analysis, Insights and Forecast - by End-user
- 9.3.1. Academic Research Institutes
- 9.3.2. Pharmaceutical and Biotechnology Companies
- 9.3.3. Hospital and Diagnostic Laboratories
- 9.1. Market Analysis, Insights and Forecast - by Product Type
- 10. South America Oligonucleotide Therapeutics Industry Analysis, Insights and Forecast, 2019-2031
- 10.1. Market Analysis, Insights and Forecast - by Product Type
- 10.1.1. Synthesized Oligonucleotide Products
- 10.1.2. Reagents
- 10.1.3. Equipment
- 10.1.4. Services
- 10.2. Market Analysis, Insights and Forecast - by Application
- 10.2.1. Research
- 10.2.2. Diagnostics
- 10.2.3. Therapeutics
- 10.3. Market Analysis, Insights and Forecast - by End-user
- 10.3.1. Academic Research Institutes
- 10.3.2. Pharmaceutical and Biotechnology Companies
- 10.3.3. Hospital and Diagnostic Laboratories
- 10.1. Market Analysis, Insights and Forecast - by Product Type
- 11. North America Oligonucleotide Therapeutics Industry Analysis, Insights and Forecast, 2019-2031
- 11.1. Market Analysis, Insights and Forecast - By Country/Sub-region
- 11.1.1 United States
- 11.1.2 Canada
- 11.1.3 Mexico
- 12. Europe Oligonucleotide Therapeutics Industry Analysis, Insights and Forecast, 2019-2031
- 12.1. Market Analysis, Insights and Forecast - By Country/Sub-region
- 12.1.1 Germany
- 12.1.2 United Kingdom
- 12.1.3 France
- 12.1.4 Italy
- 12.1.5 Spain
- 12.1.6 Rest of Europe
- 13. Asia Pacific Oligonucleotide Therapeutics Industry Analysis, Insights and Forecast, 2019-2031
- 13.1. Market Analysis, Insights and Forecast - By Country/Sub-region
- 13.1.1 China
- 13.1.2 Japan
- 13.1.3 India
- 13.1.4 Australia
- 13.1.5 South Korea
- 13.1.6 Rest of Asia Pacific
- 14. Middle East and Africa Oligonucleotide Therapeutics Industry Analysis, Insights and Forecast, 2019-2031
- 14.1. Market Analysis, Insights and Forecast - By Country/Sub-region
- 14.1.1 GCC
- 14.1.2 South Africa
- 14.1.3 Rest of Middle East and Africa
- 15. South America Oligonucleotide Therapeutics Industry Analysis, Insights and Forecast, 2019-2031
- 15.1. Market Analysis, Insights and Forecast - By Country/Sub-region
- 15.1.1 Brazil
- 15.1.2 Argentina
- 15.1.3 Rest of South America
- 16. Competitive Analysis
- 16.1. Global Market Share Analysis 2024
- 16.2. Company Profiles
- 16.2.1 Merck KGaA
- 16.2.1.1. Overview
- 16.2.1.2. Products
- 16.2.1.3. SWOT Analysis
- 16.2.1.4. Recent Developments
- 16.2.1.5. Financials (Based on Availability)
- 16.2.2 Maravai Life Sciences
- 16.2.2.1. Overview
- 16.2.2.2. Products
- 16.2.2.3. SWOT Analysis
- 16.2.2.4. Recent Developments
- 16.2.2.5. Financials (Based on Availability)
- 16.2.3 Eurofins Scientific
- 16.2.3.1. Overview
- 16.2.3.2. Products
- 16.2.3.3. SWOT Analysis
- 16.2.3.4. Recent Developments
- 16.2.3.5. Financials (Based on Availability)
- 16.2.4 Biogen
- 16.2.4.1. Overview
- 16.2.4.2. Products
- 16.2.4.3. SWOT Analysis
- 16.2.4.4. Recent Developments
- 16.2.4.5. Financials (Based on Availability)
- 16.2.5 LGC Limited (LGC Biosearch Technologies)
- 16.2.5.1. Overview
- 16.2.5.2. Products
- 16.2.5.3. SWOT Analysis
- 16.2.5.4. Recent Developments
- 16.2.5.5. Financials (Based on Availability)
- 16.2.6 Danaher Corporation
- 16.2.6.1. Overview
- 16.2.6.2. Products
- 16.2.6.3. SWOT Analysis
- 16.2.6.4. Recent Developments
- 16.2.6.5. Financials (Based on Availability)
- 16.2.7 GenScript
- 16.2.7.1. Overview
- 16.2.7.2. Products
- 16.2.7.3. SWOT Analysis
- 16.2.7.4. Recent Developments
- 16.2.7.5. Financials (Based on Availability)
- 16.2.8 Sarepta Therapeutics Inc
- 16.2.8.1. Overview
- 16.2.8.2. Products
- 16.2.8.3. SWOT Analysis
- 16.2.8.4. Recent Developments
- 16.2.8.5. Financials (Based on Availability)
- 16.2.9 Thermo Fisher Scientific
- 16.2.9.1. Overview
- 16.2.9.2. Products
- 16.2.9.3. SWOT Analysis
- 16.2.9.4. Recent Developments
- 16.2.9.5. Financials (Based on Availability)
- 16.2.10 Bio-Synthesis Inc
- 16.2.10.1. Overview
- 16.2.10.2. Products
- 16.2.10.3. SWOT Analysis
- 16.2.10.4. Recent Developments
- 16.2.10.5. Financials (Based on Availability)
- 16.2.11 Agilent Technologies
- 16.2.11.1. Overview
- 16.2.11.2. Products
- 16.2.11.3. SWOT Analysis
- 16.2.11.4. Recent Developments
- 16.2.11.5. Financials (Based on Availability)
- 16.2.12 Kaneka Corporation (Eurogentec)
- 16.2.12.1. Overview
- 16.2.12.2. Products
- 16.2.12.3. SWOT Analysis
- 16.2.12.4. Recent Developments
- 16.2.12.5. Financials (Based on Availability)
- 16.2.1 Merck KGaA
List of Figures
- Figure 1: Global Oligonucleotide Therapeutics Industry Revenue Breakdown (Million, %) by Region 2024 & 2032
- Figure 2: Global Oligonucleotide Therapeutics Industry Volume Breakdown (K Unit, %) by Region 2024 & 2032
- Figure 3: North America Oligonucleotide Therapeutics Industry Revenue (Million), by Country 2024 & 2032
- Figure 4: North America Oligonucleotide Therapeutics Industry Volume (K Unit), by Country 2024 & 2032
- Figure 5: North America Oligonucleotide Therapeutics Industry Revenue Share (%), by Country 2024 & 2032
- Figure 6: North America Oligonucleotide Therapeutics Industry Volume Share (%), by Country 2024 & 2032
- Figure 7: Europe Oligonucleotide Therapeutics Industry Revenue (Million), by Country 2024 & 2032
- Figure 8: Europe Oligonucleotide Therapeutics Industry Volume (K Unit), by Country 2024 & 2032
- Figure 9: Europe Oligonucleotide Therapeutics Industry Revenue Share (%), by Country 2024 & 2032
- Figure 10: Europe Oligonucleotide Therapeutics Industry Volume Share (%), by Country 2024 & 2032
- Figure 11: Asia Pacific Oligonucleotide Therapeutics Industry Revenue (Million), by Country 2024 & 2032
- Figure 12: Asia Pacific Oligonucleotide Therapeutics Industry Volume (K Unit), by Country 2024 & 2032
- Figure 13: Asia Pacific Oligonucleotide Therapeutics Industry Revenue Share (%), by Country 2024 & 2032
- Figure 14: Asia Pacific Oligonucleotide Therapeutics Industry Volume Share (%), by Country 2024 & 2032
- Figure 15: Middle East and Africa Oligonucleotide Therapeutics Industry Revenue (Million), by Country 2024 & 2032
- Figure 16: Middle East and Africa Oligonucleotide Therapeutics Industry Volume (K Unit), by Country 2024 & 2032
- Figure 17: Middle East and Africa Oligonucleotide Therapeutics Industry Revenue Share (%), by Country 2024 & 2032
- Figure 18: Middle East and Africa Oligonucleotide Therapeutics Industry Volume Share (%), by Country 2024 & 2032
- Figure 19: South America Oligonucleotide Therapeutics Industry Revenue (Million), by Country 2024 & 2032
- Figure 20: South America Oligonucleotide Therapeutics Industry Volume (K Unit), by Country 2024 & 2032
- Figure 21: South America Oligonucleotide Therapeutics Industry Revenue Share (%), by Country 2024 & 2032
- Figure 22: South America Oligonucleotide Therapeutics Industry Volume Share (%), by Country 2024 & 2032
- Figure 23: North America Oligonucleotide Therapeutics Industry Revenue (Million), by Product Type 2024 & 2032
- Figure 24: North America Oligonucleotide Therapeutics Industry Volume (K Unit), by Product Type 2024 & 2032
- Figure 25: North America Oligonucleotide Therapeutics Industry Revenue Share (%), by Product Type 2024 & 2032
- Figure 26: North America Oligonucleotide Therapeutics Industry Volume Share (%), by Product Type 2024 & 2032
- Figure 27: North America Oligonucleotide Therapeutics Industry Revenue (Million), by Application 2024 & 2032
- Figure 28: North America Oligonucleotide Therapeutics Industry Volume (K Unit), by Application 2024 & 2032
- Figure 29: North America Oligonucleotide Therapeutics Industry Revenue Share (%), by Application 2024 & 2032
- Figure 30: North America Oligonucleotide Therapeutics Industry Volume Share (%), by Application 2024 & 2032
- Figure 31: North America Oligonucleotide Therapeutics Industry Revenue (Million), by End-user 2024 & 2032
- Figure 32: North America Oligonucleotide Therapeutics Industry Volume (K Unit), by End-user 2024 & 2032
- Figure 33: North America Oligonucleotide Therapeutics Industry Revenue Share (%), by End-user 2024 & 2032
- Figure 34: North America Oligonucleotide Therapeutics Industry Volume Share (%), by End-user 2024 & 2032
- Figure 35: North America Oligonucleotide Therapeutics Industry Revenue (Million), by Country 2024 & 2032
- Figure 36: North America Oligonucleotide Therapeutics Industry Volume (K Unit), by Country 2024 & 2032
- Figure 37: North America Oligonucleotide Therapeutics Industry Revenue Share (%), by Country 2024 & 2032
- Figure 38: North America Oligonucleotide Therapeutics Industry Volume Share (%), by Country 2024 & 2032
- Figure 39: Europe Oligonucleotide Therapeutics Industry Revenue (Million), by Product Type 2024 & 2032
- Figure 40: Europe Oligonucleotide Therapeutics Industry Volume (K Unit), by Product Type 2024 & 2032
- Figure 41: Europe Oligonucleotide Therapeutics Industry Revenue Share (%), by Product Type 2024 & 2032
- Figure 42: Europe Oligonucleotide Therapeutics Industry Volume Share (%), by Product Type 2024 & 2032
- Figure 43: Europe Oligonucleotide Therapeutics Industry Revenue (Million), by Application 2024 & 2032
- Figure 44: Europe Oligonucleotide Therapeutics Industry Volume (K Unit), by Application 2024 & 2032
- Figure 45: Europe Oligonucleotide Therapeutics Industry Revenue Share (%), by Application 2024 & 2032
- Figure 46: Europe Oligonucleotide Therapeutics Industry Volume Share (%), by Application 2024 & 2032
- Figure 47: Europe Oligonucleotide Therapeutics Industry Revenue (Million), by End-user 2024 & 2032
- Figure 48: Europe Oligonucleotide Therapeutics Industry Volume (K Unit), by End-user 2024 & 2032
- Figure 49: Europe Oligonucleotide Therapeutics Industry Revenue Share (%), by End-user 2024 & 2032
- Figure 50: Europe Oligonucleotide Therapeutics Industry Volume Share (%), by End-user 2024 & 2032
- Figure 51: Europe Oligonucleotide Therapeutics Industry Revenue (Million), by Country 2024 & 2032
- Figure 52: Europe Oligonucleotide Therapeutics Industry Volume (K Unit), by Country 2024 & 2032
- Figure 53: Europe Oligonucleotide Therapeutics Industry Revenue Share (%), by Country 2024 & 2032
- Figure 54: Europe Oligonucleotide Therapeutics Industry Volume Share (%), by Country 2024 & 2032
- Figure 55: Asia Pacific Oligonucleotide Therapeutics Industry Revenue (Million), by Product Type 2024 & 2032
- Figure 56: Asia Pacific Oligonucleotide Therapeutics Industry Volume (K Unit), by Product Type 2024 & 2032
- Figure 57: Asia Pacific Oligonucleotide Therapeutics Industry Revenue Share (%), by Product Type 2024 & 2032
- Figure 58: Asia Pacific Oligonucleotide Therapeutics Industry Volume Share (%), by Product Type 2024 & 2032
- Figure 59: Asia Pacific Oligonucleotide Therapeutics Industry Revenue (Million), by Application 2024 & 2032
- Figure 60: Asia Pacific Oligonucleotide Therapeutics Industry Volume (K Unit), by Application 2024 & 2032
- Figure 61: Asia Pacific Oligonucleotide Therapeutics Industry Revenue Share (%), by Application 2024 & 2032
- Figure 62: Asia Pacific Oligonucleotide Therapeutics Industry Volume Share (%), by Application 2024 & 2032
- Figure 63: Asia Pacific Oligonucleotide Therapeutics Industry Revenue (Million), by End-user 2024 & 2032
- Figure 64: Asia Pacific Oligonucleotide Therapeutics Industry Volume (K Unit), by End-user 2024 & 2032
- Figure 65: Asia Pacific Oligonucleotide Therapeutics Industry Revenue Share (%), by End-user 2024 & 2032
- Figure 66: Asia Pacific Oligonucleotide Therapeutics Industry Volume Share (%), by End-user 2024 & 2032
- Figure 67: Asia Pacific Oligonucleotide Therapeutics Industry Revenue (Million), by Country 2024 & 2032
- Figure 68: Asia Pacific Oligonucleotide Therapeutics Industry Volume (K Unit), by Country 2024 & 2032
- Figure 69: Asia Pacific Oligonucleotide Therapeutics Industry Revenue Share (%), by Country 2024 & 2032
- Figure 70: Asia Pacific Oligonucleotide Therapeutics Industry Volume Share (%), by Country 2024 & 2032
- Figure 71: Middle East and Africa Oligonucleotide Therapeutics Industry Revenue (Million), by Product Type 2024 & 2032
- Figure 72: Middle East and Africa Oligonucleotide Therapeutics Industry Volume (K Unit), by Product Type 2024 & 2032
- Figure 73: Middle East and Africa Oligonucleotide Therapeutics Industry Revenue Share (%), by Product Type 2024 & 2032
- Figure 74: Middle East and Africa Oligonucleotide Therapeutics Industry Volume Share (%), by Product Type 2024 & 2032
- Figure 75: Middle East and Africa Oligonucleotide Therapeutics Industry Revenue (Million), by Application 2024 & 2032
- Figure 76: Middle East and Africa Oligonucleotide Therapeutics Industry Volume (K Unit), by Application 2024 & 2032
- Figure 77: Middle East and Africa Oligonucleotide Therapeutics Industry Revenue Share (%), by Application 2024 & 2032
- Figure 78: Middle East and Africa Oligonucleotide Therapeutics Industry Volume Share (%), by Application 2024 & 2032
- Figure 79: Middle East and Africa Oligonucleotide Therapeutics Industry Revenue (Million), by End-user 2024 & 2032
- Figure 80: Middle East and Africa Oligonucleotide Therapeutics Industry Volume (K Unit), by End-user 2024 & 2032
- Figure 81: Middle East and Africa Oligonucleotide Therapeutics Industry Revenue Share (%), by End-user 2024 & 2032
- Figure 82: Middle East and Africa Oligonucleotide Therapeutics Industry Volume Share (%), by End-user 2024 & 2032
- Figure 83: Middle East and Africa Oligonucleotide Therapeutics Industry Revenue (Million), by Country 2024 & 2032
- Figure 84: Middle East and Africa Oligonucleotide Therapeutics Industry Volume (K Unit), by Country 2024 & 2032
- Figure 85: Middle East and Africa Oligonucleotide Therapeutics Industry Revenue Share (%), by Country 2024 & 2032
- Figure 86: Middle East and Africa Oligonucleotide Therapeutics Industry Volume Share (%), by Country 2024 & 2032
- Figure 87: South America Oligonucleotide Therapeutics Industry Revenue (Million), by Product Type 2024 & 2032
- Figure 88: South America Oligonucleotide Therapeutics Industry Volume (K Unit), by Product Type 2024 & 2032
- Figure 89: South America Oligonucleotide Therapeutics Industry Revenue Share (%), by Product Type 2024 & 2032
- Figure 90: South America Oligonucleotide Therapeutics Industry Volume Share (%), by Product Type 2024 & 2032
- Figure 91: South America Oligonucleotide Therapeutics Industry Revenue (Million), by Application 2024 & 2032
- Figure 92: South America Oligonucleotide Therapeutics Industry Volume (K Unit), by Application 2024 & 2032
- Figure 93: South America Oligonucleotide Therapeutics Industry Revenue Share (%), by Application 2024 & 2032
- Figure 94: South America Oligonucleotide Therapeutics Industry Volume Share (%), by Application 2024 & 2032
- Figure 95: South America Oligonucleotide Therapeutics Industry Revenue (Million), by End-user 2024 & 2032
- Figure 96: South America Oligonucleotide Therapeutics Industry Volume (K Unit), by End-user 2024 & 2032
- Figure 97: South America Oligonucleotide Therapeutics Industry Revenue Share (%), by End-user 2024 & 2032
- Figure 98: South America Oligonucleotide Therapeutics Industry Volume Share (%), by End-user 2024 & 2032
- Figure 99: South America Oligonucleotide Therapeutics Industry Revenue (Million), by Country 2024 & 2032
- Figure 100: South America Oligonucleotide Therapeutics Industry Volume (K Unit), by Country 2024 & 2032
- Figure 101: South America Oligonucleotide Therapeutics Industry Revenue Share (%), by Country 2024 & 2032
- Figure 102: South America Oligonucleotide Therapeutics Industry Volume Share (%), by Country 2024 & 2032
List of Tables
- Table 1: Global Oligonucleotide Therapeutics Industry Revenue Million Forecast, by Region 2019 & 2032
- Table 2: Global Oligonucleotide Therapeutics Industry Volume K Unit Forecast, by Region 2019 & 2032
- Table 3: Global Oligonucleotide Therapeutics Industry Revenue Million Forecast, by Product Type 2019 & 2032
- Table 4: Global Oligonucleotide Therapeutics Industry Volume K Unit Forecast, by Product Type 2019 & 2032
- Table 5: Global Oligonucleotide Therapeutics Industry Revenue Million Forecast, by Application 2019 & 2032
- Table 6: Global Oligonucleotide Therapeutics Industry Volume K Unit Forecast, by Application 2019 & 2032
- Table 7: Global Oligonucleotide Therapeutics Industry Revenue Million Forecast, by End-user 2019 & 2032
- Table 8: Global Oligonucleotide Therapeutics Industry Volume K Unit Forecast, by End-user 2019 & 2032
- Table 9: Global Oligonucleotide Therapeutics Industry Revenue Million Forecast, by Region 2019 & 2032
- Table 10: Global Oligonucleotide Therapeutics Industry Volume K Unit Forecast, by Region 2019 & 2032
- Table 11: Global Oligonucleotide Therapeutics Industry Revenue Million Forecast, by Country 2019 & 2032
- Table 12: Global Oligonucleotide Therapeutics Industry Volume K Unit Forecast, by Country 2019 & 2032
- Table 13: United States Oligonucleotide Therapeutics Industry Revenue (Million) Forecast, by Application 2019 & 2032
- Table 14: United States Oligonucleotide Therapeutics Industry Volume (K Unit) Forecast, by Application 2019 & 2032
- Table 15: Canada Oligonucleotide Therapeutics Industry Revenue (Million) Forecast, by Application 2019 & 2032
- Table 16: Canada Oligonucleotide Therapeutics Industry Volume (K Unit) Forecast, by Application 2019 & 2032
- Table 17: Mexico Oligonucleotide Therapeutics Industry Revenue (Million) Forecast, by Application 2019 & 2032
- Table 18: Mexico Oligonucleotide Therapeutics Industry Volume (K Unit) Forecast, by Application 2019 & 2032
- Table 19: Global Oligonucleotide Therapeutics Industry Revenue Million Forecast, by Country 2019 & 2032
- Table 20: Global Oligonucleotide Therapeutics Industry Volume K Unit Forecast, by Country 2019 & 2032
- Table 21: Germany Oligonucleotide Therapeutics Industry Revenue (Million) Forecast, by Application 2019 & 2032
- Table 22: Germany Oligonucleotide Therapeutics Industry Volume (K Unit) Forecast, by Application 2019 & 2032
- Table 23: United Kingdom Oligonucleotide Therapeutics Industry Revenue (Million) Forecast, by Application 2019 & 2032
- Table 24: United Kingdom Oligonucleotide Therapeutics Industry Volume (K Unit) Forecast, by Application 2019 & 2032
- Table 25: France Oligonucleotide Therapeutics Industry Revenue (Million) Forecast, by Application 2019 & 2032
- Table 26: France Oligonucleotide Therapeutics Industry Volume (K Unit) Forecast, by Application 2019 & 2032
- Table 27: Italy Oligonucleotide Therapeutics Industry Revenue (Million) Forecast, by Application 2019 & 2032
- Table 28: Italy Oligonucleotide Therapeutics Industry Volume (K Unit) Forecast, by Application 2019 & 2032
- Table 29: Spain Oligonucleotide Therapeutics Industry Revenue (Million) Forecast, by Application 2019 & 2032
- Table 30: Spain Oligonucleotide Therapeutics Industry Volume (K Unit) Forecast, by Application 2019 & 2032
- Table 31: Rest of Europe Oligonucleotide Therapeutics Industry Revenue (Million) Forecast, by Application 2019 & 2032
- Table 32: Rest of Europe Oligonucleotide Therapeutics Industry Volume (K Unit) Forecast, by Application 2019 & 2032
- Table 33: Global Oligonucleotide Therapeutics Industry Revenue Million Forecast, by Country 2019 & 2032
- Table 34: Global Oligonucleotide Therapeutics Industry Volume K Unit Forecast, by Country 2019 & 2032
- Table 35: China Oligonucleotide Therapeutics Industry Revenue (Million) Forecast, by Application 2019 & 2032
- Table 36: China Oligonucleotide Therapeutics Industry Volume (K Unit) Forecast, by Application 2019 & 2032
- Table 37: Japan Oligonucleotide Therapeutics Industry Revenue (Million) Forecast, by Application 2019 & 2032
- Table 38: Japan Oligonucleotide Therapeutics Industry Volume (K Unit) Forecast, by Application 2019 & 2032
- Table 39: India Oligonucleotide Therapeutics Industry Revenue (Million) Forecast, by Application 2019 & 2032
- Table 40: India Oligonucleotide Therapeutics Industry Volume (K Unit) Forecast, by Application 2019 & 2032
- Table 41: Australia Oligonucleotide Therapeutics Industry Revenue (Million) Forecast, by Application 2019 & 2032
- Table 42: Australia Oligonucleotide Therapeutics Industry Volume (K Unit) Forecast, by Application 2019 & 2032
- Table 43: South Korea Oligonucleotide Therapeutics Industry Revenue (Million) Forecast, by Application 2019 & 2032
- Table 44: South Korea Oligonucleotide Therapeutics Industry Volume (K Unit) Forecast, by Application 2019 & 2032
- Table 45: Rest of Asia Pacific Oligonucleotide Therapeutics Industry Revenue (Million) Forecast, by Application 2019 & 2032
- Table 46: Rest of Asia Pacific Oligonucleotide Therapeutics Industry Volume (K Unit) Forecast, by Application 2019 & 2032
- Table 47: Global Oligonucleotide Therapeutics Industry Revenue Million Forecast, by Country 2019 & 2032
- Table 48: Global Oligonucleotide Therapeutics Industry Volume K Unit Forecast, by Country 2019 & 2032
- Table 49: GCC Oligonucleotide Therapeutics Industry Revenue (Million) Forecast, by Application 2019 & 2032
- Table 50: GCC Oligonucleotide Therapeutics Industry Volume (K Unit) Forecast, by Application 2019 & 2032
- Table 51: South Africa Oligonucleotide Therapeutics Industry Revenue (Million) Forecast, by Application 2019 & 2032
- Table 52: South Africa Oligonucleotide Therapeutics Industry Volume (K Unit) Forecast, by Application 2019 & 2032
- Table 53: Rest of Middle East and Africa Oligonucleotide Therapeutics Industry Revenue (Million) Forecast, by Application 2019 & 2032
- Table 54: Rest of Middle East and Africa Oligonucleotide Therapeutics Industry Volume (K Unit) Forecast, by Application 2019 & 2032
- Table 55: Global Oligonucleotide Therapeutics Industry Revenue Million Forecast, by Country 2019 & 2032
- Table 56: Global Oligonucleotide Therapeutics Industry Volume K Unit Forecast, by Country 2019 & 2032
- Table 57: Brazil Oligonucleotide Therapeutics Industry Revenue (Million) Forecast, by Application 2019 & 2032
- Table 58: Brazil Oligonucleotide Therapeutics Industry Volume (K Unit) Forecast, by Application 2019 & 2032
- Table 59: Argentina Oligonucleotide Therapeutics Industry Revenue (Million) Forecast, by Application 2019 & 2032
- Table 60: Argentina Oligonucleotide Therapeutics Industry Volume (K Unit) Forecast, by Application 2019 & 2032
- Table 61: Rest of South America Oligonucleotide Therapeutics Industry Revenue (Million) Forecast, by Application 2019 & 2032
- Table 62: Rest of South America Oligonucleotide Therapeutics Industry Volume (K Unit) Forecast, by Application 2019 & 2032
- Table 63: Global Oligonucleotide Therapeutics Industry Revenue Million Forecast, by Product Type 2019 & 2032
- Table 64: Global Oligonucleotide Therapeutics Industry Volume K Unit Forecast, by Product Type 2019 & 2032
- Table 65: Global Oligonucleotide Therapeutics Industry Revenue Million Forecast, by Application 2019 & 2032
- Table 66: Global Oligonucleotide Therapeutics Industry Volume K Unit Forecast, by Application 2019 & 2032
- Table 67: Global Oligonucleotide Therapeutics Industry Revenue Million Forecast, by End-user 2019 & 2032
- Table 68: Global Oligonucleotide Therapeutics Industry Volume K Unit Forecast, by End-user 2019 & 2032
- Table 69: Global Oligonucleotide Therapeutics Industry Revenue Million Forecast, by Country 2019 & 2032
- Table 70: Global Oligonucleotide Therapeutics Industry Volume K Unit Forecast, by Country 2019 & 2032
- Table 71: United States Oligonucleotide Therapeutics Industry Revenue (Million) Forecast, by Application 2019 & 2032
- Table 72: United States Oligonucleotide Therapeutics Industry Volume (K Unit) Forecast, by Application 2019 & 2032
- Table 73: Canada Oligonucleotide Therapeutics Industry Revenue (Million) Forecast, by Application 2019 & 2032
- Table 74: Canada Oligonucleotide Therapeutics Industry Volume (K Unit) Forecast, by Application 2019 & 2032
- Table 75: Mexico Oligonucleotide Therapeutics Industry Revenue (Million) Forecast, by Application 2019 & 2032
- Table 76: Mexico Oligonucleotide Therapeutics Industry Volume (K Unit) Forecast, by Application 2019 & 2032
- Table 77: Global Oligonucleotide Therapeutics Industry Revenue Million Forecast, by Product Type 2019 & 2032
- Table 78: Global Oligonucleotide Therapeutics Industry Volume K Unit Forecast, by Product Type 2019 & 2032
- Table 79: Global Oligonucleotide Therapeutics Industry Revenue Million Forecast, by Application 2019 & 2032
- Table 80: Global Oligonucleotide Therapeutics Industry Volume K Unit Forecast, by Application 2019 & 2032
- Table 81: Global Oligonucleotide Therapeutics Industry Revenue Million Forecast, by End-user 2019 & 2032
- Table 82: Global Oligonucleotide Therapeutics Industry Volume K Unit Forecast, by End-user 2019 & 2032
- Table 83: Global Oligonucleotide Therapeutics Industry Revenue Million Forecast, by Country 2019 & 2032
- Table 84: Global Oligonucleotide Therapeutics Industry Volume K Unit Forecast, by Country 2019 & 2032
- Table 85: Germany Oligonucleotide Therapeutics Industry Revenue (Million) Forecast, by Application 2019 & 2032
- Table 86: Germany Oligonucleotide Therapeutics Industry Volume (K Unit) Forecast, by Application 2019 & 2032
- Table 87: United Kingdom Oligonucleotide Therapeutics Industry Revenue (Million) Forecast, by Application 2019 & 2032
- Table 88: United Kingdom Oligonucleotide Therapeutics Industry Volume (K Unit) Forecast, by Application 2019 & 2032
- Table 89: France Oligonucleotide Therapeutics Industry Revenue (Million) Forecast, by Application 2019 & 2032
- Table 90: France Oligonucleotide Therapeutics Industry Volume (K Unit) Forecast, by Application 2019 & 2032
- Table 91: Italy Oligonucleotide Therapeutics Industry Revenue (Million) Forecast, by Application 2019 & 2032
- Table 92: Italy Oligonucleotide Therapeutics Industry Volume (K Unit) Forecast, by Application 2019 & 2032
- Table 93: Spain Oligonucleotide Therapeutics Industry Revenue (Million) Forecast, by Application 2019 & 2032
- Table 94: Spain Oligonucleotide Therapeutics Industry Volume (K Unit) Forecast, by Application 2019 & 2032
- Table 95: Rest of Europe Oligonucleotide Therapeutics Industry Revenue (Million) Forecast, by Application 2019 & 2032
- Table 96: Rest of Europe Oligonucleotide Therapeutics Industry Volume (K Unit) Forecast, by Application 2019 & 2032
- Table 97: Global Oligonucleotide Therapeutics Industry Revenue Million Forecast, by Product Type 2019 & 2032
- Table 98: Global Oligonucleotide Therapeutics Industry Volume K Unit Forecast, by Product Type 2019 & 2032
- Table 99: Global Oligonucleotide Therapeutics Industry Revenue Million Forecast, by Application 2019 & 2032
- Table 100: Global Oligonucleotide Therapeutics Industry Volume K Unit Forecast, by Application 2019 & 2032
- Table 101: Global Oligonucleotide Therapeutics Industry Revenue Million Forecast, by End-user 2019 & 2032
- Table 102: Global Oligonucleotide Therapeutics Industry Volume K Unit Forecast, by End-user 2019 & 2032
- Table 103: Global Oligonucleotide Therapeutics Industry Revenue Million Forecast, by Country 2019 & 2032
- Table 104: Global Oligonucleotide Therapeutics Industry Volume K Unit Forecast, by Country 2019 & 2032
- Table 105: China Oligonucleotide Therapeutics Industry Revenue (Million) Forecast, by Application 2019 & 2032
- Table 106: China Oligonucleotide Therapeutics Industry Volume (K Unit) Forecast, by Application 2019 & 2032
- Table 107: Japan Oligonucleotide Therapeutics Industry Revenue (Million) Forecast, by Application 2019 & 2032
- Table 108: Japan Oligonucleotide Therapeutics Industry Volume (K Unit) Forecast, by Application 2019 & 2032
- Table 109: India Oligonucleotide Therapeutics Industry Revenue (Million) Forecast, by Application 2019 & 2032
- Table 110: India Oligonucleotide Therapeutics Industry Volume (K Unit) Forecast, by Application 2019 & 2032
- Table 111: Australia Oligonucleotide Therapeutics Industry Revenue (Million) Forecast, by Application 2019 & 2032
- Table 112: Australia Oligonucleotide Therapeutics Industry Volume (K Unit) Forecast, by Application 2019 & 2032
- Table 113: South Korea Oligonucleotide Therapeutics Industry Revenue (Million) Forecast, by Application 2019 & 2032
- Table 114: South Korea Oligonucleotide Therapeutics Industry Volume (K Unit) Forecast, by Application 2019 & 2032
- Table 115: Rest of Asia Pacific Oligonucleotide Therapeutics Industry Revenue (Million) Forecast, by Application 2019 & 2032
- Table 116: Rest of Asia Pacific Oligonucleotide Therapeutics Industry Volume (K Unit) Forecast, by Application 2019 & 2032
- Table 117: Global Oligonucleotide Therapeutics Industry Revenue Million Forecast, by Product Type 2019 & 2032
- Table 118: Global Oligonucleotide Therapeutics Industry Volume K Unit Forecast, by Product Type 2019 & 2032
- Table 119: Global Oligonucleotide Therapeutics Industry Revenue Million Forecast, by Application 2019 & 2032
- Table 120: Global Oligonucleotide Therapeutics Industry Volume K Unit Forecast, by Application 2019 & 2032
- Table 121: Global Oligonucleotide Therapeutics Industry Revenue Million Forecast, by End-user 2019 & 2032
- Table 122: Global Oligonucleotide Therapeutics Industry Volume K Unit Forecast, by End-user 2019 & 2032
- Table 123: Global Oligonucleotide Therapeutics Industry Revenue Million Forecast, by Country 2019 & 2032
- Table 124: Global Oligonucleotide Therapeutics Industry Volume K Unit Forecast, by Country 2019 & 2032
- Table 125: GCC Oligonucleotide Therapeutics Industry Revenue (Million) Forecast, by Application 2019 & 2032
- Table 126: GCC Oligonucleotide Therapeutics Industry Volume (K Unit) Forecast, by Application 2019 & 2032
- Table 127: South Africa Oligonucleotide Therapeutics Industry Revenue (Million) Forecast, by Application 2019 & 2032
- Table 128: South Africa Oligonucleotide Therapeutics Industry Volume (K Unit) Forecast, by Application 2019 & 2032
- Table 129: Rest of Middle East and Africa Oligonucleotide Therapeutics Industry Revenue (Million) Forecast, by Application 2019 & 2032
- Table 130: Rest of Middle East and Africa Oligonucleotide Therapeutics Industry Volume (K Unit) Forecast, by Application 2019 & 2032
- Table 131: Global Oligonucleotide Therapeutics Industry Revenue Million Forecast, by Product Type 2019 & 2032
- Table 132: Global Oligonucleotide Therapeutics Industry Volume K Unit Forecast, by Product Type 2019 & 2032
- Table 133: Global Oligonucleotide Therapeutics Industry Revenue Million Forecast, by Application 2019 & 2032
- Table 134: Global Oligonucleotide Therapeutics Industry Volume K Unit Forecast, by Application 2019 & 2032
- Table 135: Global Oligonucleotide Therapeutics Industry Revenue Million Forecast, by End-user 2019 & 2032
- Table 136: Global Oligonucleotide Therapeutics Industry Volume K Unit Forecast, by End-user 2019 & 2032
- Table 137: Global Oligonucleotide Therapeutics Industry Revenue Million Forecast, by Country 2019 & 2032
- Table 138: Global Oligonucleotide Therapeutics Industry Volume K Unit Forecast, by Country 2019 & 2032
- Table 139: Brazil Oligonucleotide Therapeutics Industry Revenue (Million) Forecast, by Application 2019 & 2032
- Table 140: Brazil Oligonucleotide Therapeutics Industry Volume (K Unit) Forecast, by Application 2019 & 2032
- Table 141: Argentina Oligonucleotide Therapeutics Industry Revenue (Million) Forecast, by Application 2019 & 2032
- Table 142: Argentina Oligonucleotide Therapeutics Industry Volume (K Unit) Forecast, by Application 2019 & 2032
- Table 143: Rest of South America Oligonucleotide Therapeutics Industry Revenue (Million) Forecast, by Application 2019 & 2032
- Table 144: Rest of South America Oligonucleotide Therapeutics Industry Volume (K Unit) Forecast, by Application 2019 & 2032
Frequently Asked Questions
1. What is the projected Compound Annual Growth Rate (CAGR) of the Oligonucleotide Therapeutics Industry?
The projected CAGR is approximately 12.30%.
2. Which companies are prominent players in the Oligonucleotide Therapeutics Industry?
Key companies in the market include Merck KGaA, Maravai Life Sciences, Eurofins Scientific, Biogen, LGC Limited (LGC Biosearch Technologies), Danaher Corporation, GenScript, Sarepta Therapeutics Inc , Thermo Fisher Scientific, Bio-Synthesis Inc, Agilent Technologies, Kaneka Corporation (Eurogentec).
3. What are the main segments of the Oligonucleotide Therapeutics Industry?
The market segments include Product Type, Application, End-user.
4. Can you provide details about the market size?
The market size is estimated to be USD XX Million as of 2022.
5. What are some drivers contributing to market growth?
Increasing Government Investments and R&D Expenditure in Pharmaceutical and Biotechnology Companies; The Use of Synthesized Oligonucleotides in Molecular Diagnostics and Clinical Applications.
6. What are the notable trends driving market growth?
Therapeutic Segment Expected to Register a High CAGR.
7. Are there any restraints impacting market growth?
High Treatment Cost of Oligonucleotides; Lack of Skilled Professionals and Research Support in Undeveloped Countries.
8. Can you provide examples of recent developments in the market?
July 2022: WuXi STA, a subsidiary of WuXi AppTec, launched a new large-scale oligonucleotide and peptide manufacturing facility at its Changzhou campus. This new launch enhances its capacity and capability to meet the fast-growing customer needs for oligonucleotide and peptide therapeutics development and manufacturing worldwide.
9. What pricing options are available for accessing the report?
Pricing options include single-user, multi-user, and enterprise licenses priced at USD 4750, USD 5250, and USD 8750 respectively.
10. Is the market size provided in terms of value or volume?
The market size is provided in terms of value, measured in Million and volume, measured in K Unit.
11. Are there any specific market keywords associated with the report?
Yes, the market keyword associated with the report is "Oligonucleotide Therapeutics Industry," which aids in identifying and referencing the specific market segment covered.
12. How do I determine which pricing option suits my needs best?
The pricing options vary based on user requirements and access needs. Individual users may opt for single-user licenses, while businesses requiring broader access may choose multi-user or enterprise licenses for cost-effective access to the report.
13. Are there any additional resources or data provided in the Oligonucleotide Therapeutics Industry report?
While the report offers comprehensive insights, it's advisable to review the specific contents or supplementary materials provided to ascertain if additional resources or data are available.
14. How can I stay updated on further developments or reports in the Oligonucleotide Therapeutics Industry?
To stay informed about further developments, trends, and reports in the Oligonucleotide Therapeutics Industry, consider subscribing to industry newsletters, following relevant companies and organizations, or regularly checking reputable industry news sources and publications.
Methodology
Step 1 - Identification of Relevant Samples Size from Population Database


Step 2 - Approaches for Defining Global Market Size (Value, Volume* & Price*)

Note*: In applicable scenarios
Step 3 - Data Sources
Primary Research
- Web Analytics
- Survey Reports
- Research Institute
- Latest Research Reports
- Opinion Leaders
Secondary Research
- Annual Reports
- White Paper
- Latest Press Release
- Industry Association
- Paid Database
- Investor Presentations

Step 4 - Data Triangulation
Involves using different sources of information in order to increase the validity of a study
These sources are likely to be stakeholders in a program - participants, other researchers, program staff, other community members, and so on.
Then we put all data in single framework & apply various statistical tools to find out the dynamic on the market.
During the analysis stage, feedback from the stakeholder groups would be compared to determine areas of agreement as well as areas of divergence


