
Key Insights
The optical encryption market, currently experiencing robust growth, is projected to reach a significant size driven by the increasing demand for secure data transmission across various sectors. The 8.10% CAGR from 2019-2024 indicates a consistently expanding market, fueled by the rising adoption of cloud computing, the proliferation of data centers, and heightened cybersecurity concerns across industries like BFSI, government, and healthcare. The market segmentation reveals strong growth in datacenter and cloud applications, reflecting the critical need for secure data transmission in these environments. Higher data rates (40G-100G and above) are also driving market expansion, reflecting the escalating bandwidth requirements of modern networks. Technological advancements in encryption layers (Layer 1, Layer 2, and Layer 3) are contributing to more sophisticated and robust security solutions, further stimulating market growth. While challenges like high initial investment costs and the complexity of implementing optical encryption solutions may act as restraints, the escalating threats of data breaches and cyberattacks are overriding these factors. The geographical analysis reveals strong growth across North America and Asia Pacific, driven by early adoption of advanced technologies and significant investment in data infrastructure within these regions. The competitive landscape is characterized by established players like Cisco, Juniper, and Huawei, along with emerging companies constantly innovating to enhance security and performance.
Looking ahead to 2033, continued expansion is anticipated. The market will likely witness further segmentation based on specific application requirements and evolving security threats. Growth will be primarily driven by increased 5G network deployments, the expansion of the Internet of Things (IoT), and the adoption of edge computing. Companies focusing on developing more cost-effective and user-friendly optical encryption solutions, tailored for specific industry needs, are expected to gain significant market share. Furthermore, collaborations and partnerships between technology providers and cybersecurity firms will be key to unlocking market potential and driving broader adoption of optical encryption technology. The market's continued trajectory suggests a strong outlook for companies involved in research, development, and deployment of advanced optical encryption solutions.
Optical Encryption Market: A Comprehensive Report (2019-2033)
This in-depth report provides a comprehensive analysis of the Optical Encryption Market, offering invaluable insights for stakeholders across the value chain. The study covers the period from 2019 to 2033, with 2025 serving as the base and estimated year. The report leverages rigorous research methodologies and data analysis to deliver actionable intelligence, empowering businesses to make informed decisions and capitalize on emerging opportunities. The market is segmented by end-user vertical, encryption type, and data rate, allowing for granular analysis of market dynamics. The total market size in 2025 is estimated at xx Million, poised for significant growth during the forecast period (2025-2033).
Optical Encryption Market Concentration & Innovation
The Optical Encryption Market exhibits a moderately concentrated landscape, with a few key players holding significant market share. Companies like Cisco Systems Inc, Huawei Technologies Co Ltd, and Nokia Corporation are among the leading players, driving innovation and shaping market trends. However, the market also features several smaller, specialized vendors, contributing to a dynamic competitive environment. Market share analysis reveals that the top 5 players collectively account for approximately xx% of the market in 2025. Innovation is driven primarily by the increasing demand for secure high-speed data transmission, particularly in data centers and cloud environments. Regulatory frameworks, such as data privacy regulations (e.g., GDPR), are further pushing the adoption of advanced optical encryption solutions. While there are limited direct substitutes for optical encryption in high-bandwidth applications, alternative security methods exist, and this competition will pressure prices in the future. End-user trends are shifting towards cloud-based solutions and software-defined networking, influencing product development and deployment strategies. M&A activity within the sector has been moderate in recent years, with deal values averaging approximately xx Million per transaction. Notable acquisitions include [insert specific M&A examples if available, otherwise state "no significant recent acquisitions reported"].
Optical Encryption Market Industry Trends & Insights
The Optical Encryption Market is experiencing robust growth, fueled by the surging demand for secure data transmission across various sectors. The market is projected to register a CAGR of xx% during the forecast period (2025-2033). This growth is driven by several key factors: the expanding adoption of cloud computing and data center infrastructure, increased concerns about cybersecurity threats, and the proliferation of high-speed data networks. Technological advancements, such as the development of more efficient and cost-effective encryption algorithms and hardware, are further accelerating market growth. Consumer preferences are shifting towards integrated security solutions that seamlessly integrate into existing network infrastructure. Competitive dynamics are characterized by ongoing innovation, strategic partnerships, and the entry of new players, creating a fiercely competitive market environment. Market penetration of optical encryption technologies is relatively high in developed regions, particularly within the telecommunications and financial sectors, but significant growth opportunities remain in developing economies and emerging applications.
Dominant Markets & Segments in Optical Encryption Market
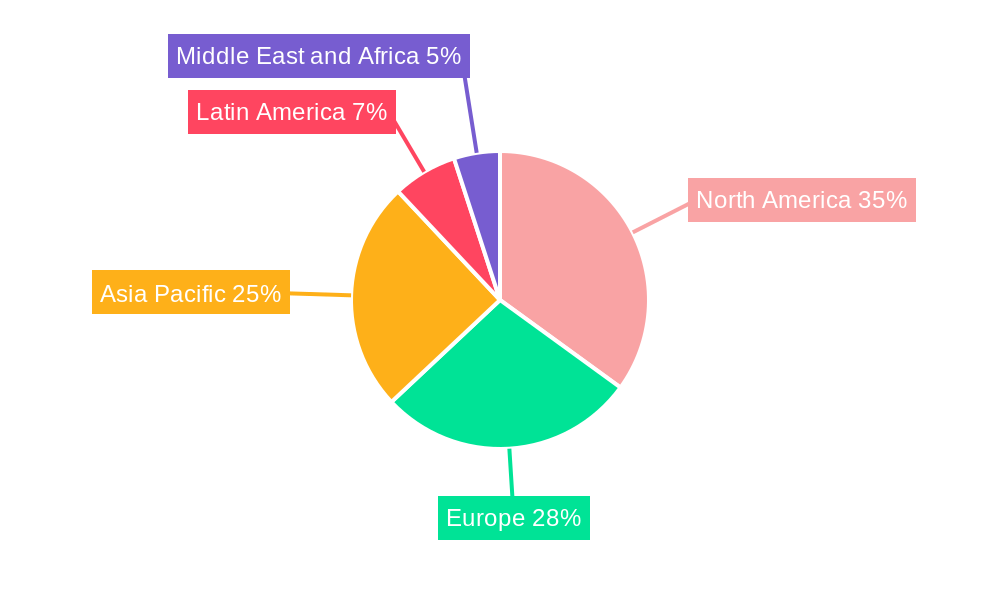
Leading Region/Country: North America currently dominates the Optical Encryption Market, driven by strong adoption across various industries. However, Asia-Pacific is projected to experience the fastest growth rate due to expanding digital infrastructure and robust government investments.
Dominant End-user Verticals: The Datacenter and Cloud sector constitutes the largest segment, followed by BFSI (Banking, Financial Services, and Insurance) and Government and Defence sectors. These verticals are characterized by high data volumes and stringent security requirements, driving demand for optical encryption solutions. The Healthcare sector is emerging as a significant growth area with the increasing adoption of telehealth and electronic health records (EHRs).
Dominant Encryption Type: Layer 2 encryption solutions currently hold the largest market share, owing to their wide compatibility and established industry standards. Layer 3 encryption is witnessing rapid growth due to its enhanced security capabilities for handling complex network topologies.
Dominant Data Rate: The 10G-40G data rate segment currently dominates the market, reflecting the widespread deployment of 10 Gigabit Ethernet and 40 Gigabit Ethernet networks. However, the >100G segment is anticipated to exhibit rapid growth due to the increasing demand for higher bandwidth applications. Key drivers for the dominance of these segments are robust fiber optic infrastructure investment and evolving network requirements.
Optical Encryption Market Product Developments
Recent product innovations focus on enhancing encryption speed, efficiency, and integration with existing network infrastructure. Manufacturers are developing solutions with improved security algorithms, reduced latency, and simplified deployment processes. Products are increasingly incorporating advanced features like automated key management and real-time threat detection. These developments are addressing market needs for cost-effective, scalable, and secure solutions that are easy to manage and deploy. The focus on market fit centers on seamless integration and compatibility with existing networking technologies.
Report Scope & Segmentation Analysis
This report provides a detailed segmentation analysis of the Optical Encryption Market across various parameters:
End-user Verticals: Datacenter and Cloud, BFSI, Government and Defence, Healthcare, Energy and Utilities, Retail and E-commerce, Other End-user Verticals. Each segment's growth trajectory is assessed, taking into account factors like industry-specific regulations and security requirements.
Encryption Types: Layer 1, Layer 2, Layer 3. Market size and growth projections are provided for each layer, along with an assessment of competitive intensity within each layer.
Data Rate: Less than 10 G, 10 G-40 G, 40 G-100 G, Greater than 100 G. This segmentation helps understand the evolving demand for high-speed encrypted communication across different network architectures. Each segment's growth potential is examined based on technology advancements and cost considerations.
Key Drivers of Optical Encryption Market Growth
Several key factors are driving the growth of the Optical Encryption Market. The increasing adoption of cloud computing and data centers necessitates robust security measures, creating a high demand for optical encryption. Moreover, heightened cybersecurity concerns, driven by escalating cyberattacks, are further propelling market growth. Government regulations mandating data security and privacy are also significantly impacting the market, pushing for wider adoption. Advancements in encryption technologies, leading to improved efficiency and performance, are additionally boosting market demand.
Challenges in the Optical Encryption Market Sector
Despite the substantial growth opportunities, the Optical Encryption Market faces several challenges. High initial investment costs associated with implementing optical encryption technologies can be a deterrent for smaller businesses. The complexity of integrating optical encryption solutions with existing network infrastructures can pose difficulties. Moreover, the market is subject to intense competition, with several established players vying for market share. Supply chain disruptions due to geopolitical uncertainties can impact product availability and pricing. The changing regulatory landscape also presents hurdles for manufacturers, as they must ensure continued compliance with evolving security standards.
Emerging Opportunities in Optical Encryption Market
The Optical Encryption Market presents numerous opportunities for growth. The burgeoning Internet of Things (IoT) landscape is expected to create significant demand for secure communication solutions. The rise of 5G and beyond 5G networks will necessitate advanced encryption technologies, offering substantial market opportunities. Furthermore, the increasing adoption of artificial intelligence (AI) and machine learning (ML) in network security is creating new avenues for innovation in optical encryption technologies. Development of quantum-resistant encryption algorithms will also open up new markets.
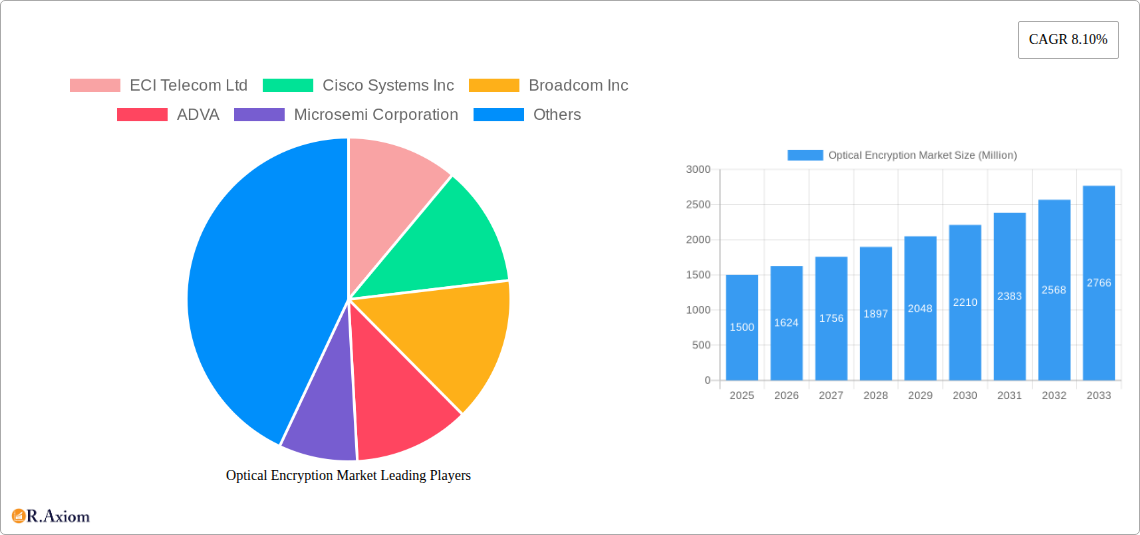
Leading Players in the Optical Encryption Market
- ECI Telecom Ltd
- Cisco Systems Inc
- Broadcom Inc
- ADVA
- Microsemi Corporation
- Arista Networks
- Juniper Networks Inc
- Thales E-Security
- Huawei Technologies Co Ltd
- Nokia Corporation
- Acacia Communications
- Ciena Corporation
Key Developments in Optical Encryption Market Industry
- January 2023: Cisco Systems Inc launched its next-generation optical encryption platform with enhanced security features.
- April 2022: Huawei Technologies Co Ltd announced a strategic partnership with a leading data center provider to deploy optical encryption solutions.
- [Insert other key developments with dates and brief descriptions, if available.]
Strategic Outlook for Optical Encryption Market
The Optical Encryption Market is poised for sustained growth, driven by the aforementioned factors. Continued innovation in encryption technologies, coupled with increasing government regulations and heightened cybersecurity concerns, will fuel market expansion. The adoption of optical encryption will likely accelerate across diverse sectors, presenting lucrative opportunities for existing and new market entrants. The market's strategic focus will likely shift towards developing highly secure, cost-effective, and easily manageable solutions that can seamlessly integrate with emerging network technologies.
Optical Encryption Market Segmentation
-
1. Encryption
- 1.1. Layer1
- 1.2. Layer 2
- 1.3. Layer 3
-
2. Data Rate
- 2.1. Less 10 G
- 2.2. 10 G-40 G
- 2.3. 40 G-100 G
- 2.4. Greater than 10 G
-
3. End-user Vertical
- 3.1. Datacenter and Cloud
- 3.2. BFSI
- 3.3. Government and Defence
- 3.4. Healthcare
- 3.5. Energy and Utilities
- 3.6. Retail and E-commerce
- 3.7. Other End-user Verticals
Optical Encryption Market Segmentation By Geography
-
1. North America
- 1.1. United States
- 1.2. Canada
-
2. Europe
- 2.1. Germany
- 2.2. United Kingdom
- 2.3. France
- 2.4. Rest of Europe
-
3. Asia Pacific
- 3.1. India
- 3.2. China
- 3.3. Japan
- 3.4. Rest of Asia Pacific
-
4. Latin America
- 4.1. Brazil
- 4.2. Argentina
- 4.3. Rest of Latin America
-
5. Middle East and Africa
- 5.1. United Arab Eminates
- 5.2. Saudi Arabia
- 5.3. Rest of Middle East and Africa
Optical Encryption Market REPORT HIGHLIGHTS
| Aspects | Details |
|---|---|
| Study Period | 2019-2033 |
| Base Year | 2024 |
| Estimated Year | 2025 |
| Forecast Period | 2025-2033 |
| Historical Period | 2019-2024 |
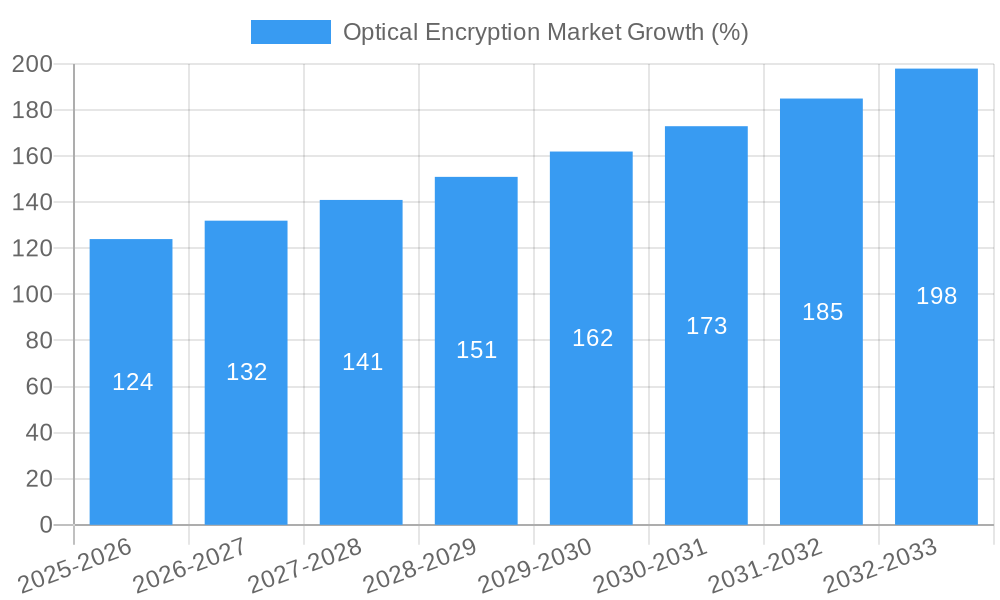
| Growth Rate | CAGR of 8.10% from 2019-2033 |
| Segmentation |
|
Table of Contents
- 1. Introduction
- 1.1. Research Scope
- 1.2. Market Segmentation
- 1.3. Research Methodology
- 1.4. Definitions and Assumptions
- 2. Executive Summary
- 2.1. Introduction
- 3. Market Dynamics
- 3.1. Introduction
- 3.2. Market Drivers
- 3.2.1. Increasing Internet Penetration with Demand for High-speed Internet; Technological Innovations by OTN Solution Providers
- 3.3. Market Restrains
- 3.3.1. Dearth of Skillful Workforce to Add New Solutions in Existing Network
- 3.4. Market Trends
- 3.4.1. Layer 1 Encryption is Expected to Witness High Growth
- 4. Market Factor Analysis
- 4.1. Porters Five Forces
- 4.2. Supply/Value Chain
- 4.3. PESTEL analysis
- 4.4. Market Entropy
- 4.5. Patent/Trademark Analysis
- 5. Global Optical Encryption Market Analysis, Insights and Forecast, 2019-2031
- 5.1. Market Analysis, Insights and Forecast - by Encryption
- 5.1.1. Layer1
- 5.1.2. Layer 2
- 5.1.3. Layer 3
- 5.2. Market Analysis, Insights and Forecast - by Data Rate
- 5.2.1. Less 10 G
- 5.2.2. 10 G-40 G
- 5.2.3. 40 G-100 G
- 5.2.4. Greater than 10 G
- 5.3. Market Analysis, Insights and Forecast - by End-user Vertical
- 5.3.1. Datacenter and Cloud
- 5.3.2. BFSI
- 5.3.3. Government and Defence
- 5.3.4. Healthcare
- 5.3.5. Energy and Utilities
- 5.3.6. Retail and E-commerce
- 5.3.7. Other End-user Verticals
- 5.4. Market Analysis, Insights and Forecast - by Region
- 5.4.1. North America
- 5.4.2. Europe
- 5.4.3. Asia Pacific
- 5.4.4. Latin America
- 5.4.5. Middle East and Africa
- 5.1. Market Analysis, Insights and Forecast - by Encryption
- 6. North America Optical Encryption Market Analysis, Insights and Forecast, 2019-2031
- 6.1. Market Analysis, Insights and Forecast - by Encryption
- 6.1.1. Layer1
- 6.1.2. Layer 2
- 6.1.3. Layer 3
- 6.2. Market Analysis, Insights and Forecast - by Data Rate
- 6.2.1. Less 10 G
- 6.2.2. 10 G-40 G
- 6.2.3. 40 G-100 G
- 6.2.4. Greater than 10 G
- 6.3. Market Analysis, Insights and Forecast - by End-user Vertical
- 6.3.1. Datacenter and Cloud
- 6.3.2. BFSI
- 6.3.3. Government and Defence
- 6.3.4. Healthcare
- 6.3.5. Energy and Utilities
- 6.3.6. Retail and E-commerce
- 6.3.7. Other End-user Verticals
- 6.1. Market Analysis, Insights and Forecast - by Encryption
- 7. Europe Optical Encryption Market Analysis, Insights and Forecast, 2019-2031
- 7.1. Market Analysis, Insights and Forecast - by Encryption
- 7.1.1. Layer1
- 7.1.2. Layer 2
- 7.1.3. Layer 3
- 7.2. Market Analysis, Insights and Forecast - by Data Rate
- 7.2.1. Less 10 G
- 7.2.2. 10 G-40 G
- 7.2.3. 40 G-100 G
- 7.2.4. Greater than 10 G
- 7.3. Market Analysis, Insights and Forecast - by End-user Vertical
- 7.3.1. Datacenter and Cloud
- 7.3.2. BFSI
- 7.3.3. Government and Defence
- 7.3.4. Healthcare
- 7.3.5. Energy and Utilities
- 7.3.6. Retail and E-commerce
- 7.3.7. Other End-user Verticals
- 7.1. Market Analysis, Insights and Forecast - by Encryption
- 8. Asia Pacific Optical Encryption Market Analysis, Insights and Forecast, 2019-2031
- 8.1. Market Analysis, Insights and Forecast - by Encryption
- 8.1.1. Layer1
- 8.1.2. Layer 2
- 8.1.3. Layer 3
- 8.2. Market Analysis, Insights and Forecast - by Data Rate
- 8.2.1. Less 10 G
- 8.2.2. 10 G-40 G
- 8.2.3. 40 G-100 G
- 8.2.4. Greater than 10 G
- 8.3. Market Analysis, Insights and Forecast - by End-user Vertical
- 8.3.1. Datacenter and Cloud
- 8.3.2. BFSI
- 8.3.3. Government and Defence
- 8.3.4. Healthcare
- 8.3.5. Energy and Utilities
- 8.3.6. Retail and E-commerce
- 8.3.7. Other End-user Verticals
- 8.1. Market Analysis, Insights and Forecast - by Encryption
- 9. Latin America Optical Encryption Market Analysis, Insights and Forecast, 2019-2031
- 9.1. Market Analysis, Insights and Forecast - by Encryption
- 9.1.1. Layer1
- 9.1.2. Layer 2
- 9.1.3. Layer 3
- 9.2. Market Analysis, Insights and Forecast - by Data Rate
- 9.2.1. Less 10 G
- 9.2.2. 10 G-40 G
- 9.2.3. 40 G-100 G
- 9.2.4. Greater than 10 G
- 9.3. Market Analysis, Insights and Forecast - by End-user Vertical
- 9.3.1. Datacenter and Cloud
- 9.3.2. BFSI
- 9.3.3. Government and Defence
- 9.3.4. Healthcare
- 9.3.5. Energy and Utilities
- 9.3.6. Retail and E-commerce
- 9.3.7. Other End-user Verticals
- 9.1. Market Analysis, Insights and Forecast - by Encryption
- 10. Middle East and Africa Optical Encryption Market Analysis, Insights and Forecast, 2019-2031
- 10.1. Market Analysis, Insights and Forecast - by Encryption
- 10.1.1. Layer1
- 10.1.2. Layer 2
- 10.1.3. Layer 3
- 10.2. Market Analysis, Insights and Forecast - by Data Rate
- 10.2.1. Less 10 G
- 10.2.2. 10 G-40 G
- 10.2.3. 40 G-100 G
- 10.2.4. Greater than 10 G
- 10.3. Market Analysis, Insights and Forecast - by End-user Vertical
- 10.3.1. Datacenter and Cloud
- 10.3.2. BFSI
- 10.3.3. Government and Defence
- 10.3.4. Healthcare
- 10.3.5. Energy and Utilities
- 10.3.6. Retail and E-commerce
- 10.3.7. Other End-user Verticals
- 10.1. Market Analysis, Insights and Forecast - by Encryption
- 11. North America Optical Encryption Market Analysis, Insights and Forecast, 2019-2031
- 11.1. Market Analysis, Insights and Forecast - By Country/Sub-region
- 11.1.1 United States
- 11.1.2 Canada
- 12. Europe Optical Encryption Market Analysis, Insights and Forecast, 2019-2031
- 12.1. Market Analysis, Insights and Forecast - By Country/Sub-region
- 12.1.1 Germany
- 12.1.2 United Kingdom
- 12.1.3 France
- 12.1.4 Rest of Europe
- 13. Asia Pacific Optical Encryption Market Analysis, Insights and Forecast, 2019-2031
- 13.1. Market Analysis, Insights and Forecast - By Country/Sub-region
- 13.1.1 India
- 13.1.2 China
- 13.1.3 Japan
- 13.1.4 Rest of Asia Pacific
- 14. Latin America Optical Encryption Market Analysis, Insights and Forecast, 2019-2031
- 14.1. Market Analysis, Insights and Forecast - By Country/Sub-region
- 14.1.1 Brazil
- 14.1.2 Argentina
- 14.1.3 Rest of Latin America
- 15. Middle East and Africa Optical Encryption Market Analysis, Insights and Forecast, 2019-2031
- 15.1. Market Analysis, Insights and Forecast - By Country/Sub-region
- 15.1.1 United Arab Eminates
- 15.1.2 Saudi Arabia
- 15.1.3 Rest of Middle East and Africa
- 16. Competitive Analysis
- 16.1. Global Market Share Analysis 2024
- 16.2. Company Profiles
- 16.2.1 ECI Telecom Ltd
- 16.2.1.1. Overview
- 16.2.1.2. Products
- 16.2.1.3. SWOT Analysis
- 16.2.1.4. Recent Developments
- 16.2.1.5. Financials (Based on Availability)
- 16.2.2 Cisco Systems Inc
- 16.2.2.1. Overview
- 16.2.2.2. Products
- 16.2.2.3. SWOT Analysis
- 16.2.2.4. Recent Developments
- 16.2.2.5. Financials (Based on Availability)
- 16.2.3 Broadcom Inc
- 16.2.3.1. Overview
- 16.2.3.2. Products
- 16.2.3.3. SWOT Analysis
- 16.2.3.4. Recent Developments
- 16.2.3.5. Financials (Based on Availability)
- 16.2.4 ADVA
- 16.2.4.1. Overview
- 16.2.4.2. Products
- 16.2.4.3. SWOT Analysis
- 16.2.4.4. Recent Developments
- 16.2.4.5. Financials (Based on Availability)
- 16.2.5 Microsemi Corporation
- 16.2.5.1. Overview
- 16.2.5.2. Products
- 16.2.5.3. SWOT Analysis
- 16.2.5.4. Recent Developments
- 16.2.5.5. Financials (Based on Availability)
- 16.2.6 Arista Networks
- 16.2.6.1. Overview
- 16.2.6.2. Products
- 16.2.6.3. SWOT Analysis
- 16.2.6.4. Recent Developments
- 16.2.6.5. Financials (Based on Availability)
- 16.2.7 Juniper Networks Inc
- 16.2.7.1. Overview
- 16.2.7.2. Products
- 16.2.7.3. SWOT Analysis
- 16.2.7.4. Recent Developments
- 16.2.7.5. Financials (Based on Availability)
- 16.2.8 Thales E-Security*List Not Exhaustive 6 2 Investment Analysi
- 16.2.8.1. Overview
- 16.2.8.2. Products
- 16.2.8.3. SWOT Analysis
- 16.2.8.4. Recent Developments
- 16.2.8.5. Financials (Based on Availability)
- 16.2.9 Huawei Technologies Co Ltd
- 16.2.9.1. Overview
- 16.2.9.2. Products
- 16.2.9.3. SWOT Analysis
- 16.2.9.4. Recent Developments
- 16.2.9.5. Financials (Based on Availability)
- 16.2.10 Nokia Corporation
- 16.2.10.1. Overview
- 16.2.10.2. Products
- 16.2.10.3. SWOT Analysis
- 16.2.10.4. Recent Developments
- 16.2.10.5. Financials (Based on Availability)
- 16.2.11 Acacia Communications
- 16.2.11.1. Overview
- 16.2.11.2. Products
- 16.2.11.3. SWOT Analysis
- 16.2.11.4. Recent Developments
- 16.2.11.5. Financials (Based on Availability)
- 16.2.12 Ciena Corporation
- 16.2.12.1. Overview
- 16.2.12.2. Products
- 16.2.12.3. SWOT Analysis
- 16.2.12.4. Recent Developments
- 16.2.12.5. Financials (Based on Availability)
- 16.2.1 ECI Telecom Ltd
List of Figures
- Figure 1: Global Optical Encryption Market Revenue Breakdown (Million, %) by Region 2024 & 2032
- Figure 2: North America Optical Encryption Market Revenue (Million), by Country 2024 & 2032
- Figure 3: North America Optical Encryption Market Revenue Share (%), by Country 2024 & 2032
- Figure 4: Europe Optical Encryption Market Revenue (Million), by Country 2024 & 2032
- Figure 5: Europe Optical Encryption Market Revenue Share (%), by Country 2024 & 2032
- Figure 6: Asia Pacific Optical Encryption Market Revenue (Million), by Country 2024 & 2032
- Figure 7: Asia Pacific Optical Encryption Market Revenue Share (%), by Country 2024 & 2032
- Figure 8: Latin America Optical Encryption Market Revenue (Million), by Country 2024 & 2032
- Figure 9: Latin America Optical Encryption Market Revenue Share (%), by Country 2024 & 2032
- Figure 10: Middle East and Africa Optical Encryption Market Revenue (Million), by Country 2024 & 2032
- Figure 11: Middle East and Africa Optical Encryption Market Revenue Share (%), by Country 2024 & 2032
- Figure 12: North America Optical Encryption Market Revenue (Million), by Encryption 2024 & 2032
- Figure 13: North America Optical Encryption Market Revenue Share (%), by Encryption 2024 & 2032
- Figure 14: North America Optical Encryption Market Revenue (Million), by Data Rate 2024 & 2032
- Figure 15: North America Optical Encryption Market Revenue Share (%), by Data Rate 2024 & 2032
- Figure 16: North America Optical Encryption Market Revenue (Million), by End-user Vertical 2024 & 2032
- Figure 17: North America Optical Encryption Market Revenue Share (%), by End-user Vertical 2024 & 2032
- Figure 18: North America Optical Encryption Market Revenue (Million), by Country 2024 & 2032
- Figure 19: North America Optical Encryption Market Revenue Share (%), by Country 2024 & 2032
- Figure 20: Europe Optical Encryption Market Revenue (Million), by Encryption 2024 & 2032
- Figure 21: Europe Optical Encryption Market Revenue Share (%), by Encryption 2024 & 2032
- Figure 22: Europe Optical Encryption Market Revenue (Million), by Data Rate 2024 & 2032
- Figure 23: Europe Optical Encryption Market Revenue Share (%), by Data Rate 2024 & 2032
- Figure 24: Europe Optical Encryption Market Revenue (Million), by End-user Vertical 2024 & 2032
- Figure 25: Europe Optical Encryption Market Revenue Share (%), by End-user Vertical 2024 & 2032
- Figure 26: Europe Optical Encryption Market Revenue (Million), by Country 2024 & 2032
- Figure 27: Europe Optical Encryption Market Revenue Share (%), by Country 2024 & 2032
- Figure 28: Asia Pacific Optical Encryption Market Revenue (Million), by Encryption 2024 & 2032
- Figure 29: Asia Pacific Optical Encryption Market Revenue Share (%), by Encryption 2024 & 2032
- Figure 30: Asia Pacific Optical Encryption Market Revenue (Million), by Data Rate 2024 & 2032
- Figure 31: Asia Pacific Optical Encryption Market Revenue Share (%), by Data Rate 2024 & 2032
- Figure 32: Asia Pacific Optical Encryption Market Revenue (Million), by End-user Vertical 2024 & 2032
- Figure 33: Asia Pacific Optical Encryption Market Revenue Share (%), by End-user Vertical 2024 & 2032
- Figure 34: Asia Pacific Optical Encryption Market Revenue (Million), by Country 2024 & 2032
- Figure 35: Asia Pacific Optical Encryption Market Revenue Share (%), by Country 2024 & 2032
- Figure 36: Latin America Optical Encryption Market Revenue (Million), by Encryption 2024 & 2032
- Figure 37: Latin America Optical Encryption Market Revenue Share (%), by Encryption 2024 & 2032
- Figure 38: Latin America Optical Encryption Market Revenue (Million), by Data Rate 2024 & 2032
- Figure 39: Latin America Optical Encryption Market Revenue Share (%), by Data Rate 2024 & 2032
- Figure 40: Latin America Optical Encryption Market Revenue (Million), by End-user Vertical 2024 & 2032
- Figure 41: Latin America Optical Encryption Market Revenue Share (%), by End-user Vertical 2024 & 2032
- Figure 42: Latin America Optical Encryption Market Revenue (Million), by Country 2024 & 2032
- Figure 43: Latin America Optical Encryption Market Revenue Share (%), by Country 2024 & 2032
- Figure 44: Middle East and Africa Optical Encryption Market Revenue (Million), by Encryption 2024 & 2032
- Figure 45: Middle East and Africa Optical Encryption Market Revenue Share (%), by Encryption 2024 & 2032
- Figure 46: Middle East and Africa Optical Encryption Market Revenue (Million), by Data Rate 2024 & 2032
- Figure 47: Middle East and Africa Optical Encryption Market Revenue Share (%), by Data Rate 2024 & 2032
- Figure 48: Middle East and Africa Optical Encryption Market Revenue (Million), by End-user Vertical 2024 & 2032
- Figure 49: Middle East and Africa Optical Encryption Market Revenue Share (%), by End-user Vertical 2024 & 2032
- Figure 50: Middle East and Africa Optical Encryption Market Revenue (Million), by Country 2024 & 2032
- Figure 51: Middle East and Africa Optical Encryption Market Revenue Share (%), by Country 2024 & 2032
List of Tables
- Table 1: Global Optical Encryption Market Revenue Million Forecast, by Region 2019 & 2032
- Table 2: Global Optical Encryption Market Revenue Million Forecast, by Encryption 2019 & 2032
- Table 3: Global Optical Encryption Market Revenue Million Forecast, by Data Rate 2019 & 2032
- Table 4: Global Optical Encryption Market Revenue Million Forecast, by End-user Vertical 2019 & 2032
- Table 5: Global Optical Encryption Market Revenue Million Forecast, by Region 2019 & 2032
- Table 6: Global Optical Encryption Market Revenue Million Forecast, by Country 2019 & 2032
- Table 7: United States Optical Encryption Market Revenue (Million) Forecast, by Application 2019 & 2032
- Table 8: Canada Optical Encryption Market Revenue (Million) Forecast, by Application 2019 & 2032
- Table 9: Global Optical Encryption Market Revenue Million Forecast, by Country 2019 & 2032
- Table 10: Germany Optical Encryption Market Revenue (Million) Forecast, by Application 2019 & 2032
- Table 11: United Kingdom Optical Encryption Market Revenue (Million) Forecast, by Application 2019 & 2032
- Table 12: France Optical Encryption Market Revenue (Million) Forecast, by Application 2019 & 2032
- Table 13: Rest of Europe Optical Encryption Market Revenue (Million) Forecast, by Application 2019 & 2032
- Table 14: Global Optical Encryption Market Revenue Million Forecast, by Country 2019 & 2032
- Table 15: India Optical Encryption Market Revenue (Million) Forecast, by Application 2019 & 2032
- Table 16: China Optical Encryption Market Revenue (Million) Forecast, by Application 2019 & 2032
- Table 17: Japan Optical Encryption Market Revenue (Million) Forecast, by Application 2019 & 2032
- Table 18: Rest of Asia Pacific Optical Encryption Market Revenue (Million) Forecast, by Application 2019 & 2032
- Table 19: Global Optical Encryption Market Revenue Million Forecast, by Country 2019 & 2032
- Table 20: Brazil Optical Encryption Market Revenue (Million) Forecast, by Application 2019 & 2032
- Table 21: Argentina Optical Encryption Market Revenue (Million) Forecast, by Application 2019 & 2032
- Table 22: Rest of Latin America Optical Encryption Market Revenue (Million) Forecast, by Application 2019 & 2032
- Table 23: Global Optical Encryption Market Revenue Million Forecast, by Country 2019 & 2032
- Table 24: United Arab Eminates Optical Encryption Market Revenue (Million) Forecast, by Application 2019 & 2032
- Table 25: Saudi Arabia Optical Encryption Market Revenue (Million) Forecast, by Application 2019 & 2032
- Table 26: Rest of Middle East and Africa Optical Encryption Market Revenue (Million) Forecast, by Application 2019 & 2032
- Table 27: Global Optical Encryption Market Revenue Million Forecast, by Encryption 2019 & 2032
- Table 28: Global Optical Encryption Market Revenue Million Forecast, by Data Rate 2019 & 2032
- Table 29: Global Optical Encryption Market Revenue Million Forecast, by End-user Vertical 2019 & 2032
- Table 30: Global Optical Encryption Market Revenue Million Forecast, by Country 2019 & 2032
- Table 31: United States Optical Encryption Market Revenue (Million) Forecast, by Application 2019 & 2032
- Table 32: Canada Optical Encryption Market Revenue (Million) Forecast, by Application 2019 & 2032
- Table 33: Global Optical Encryption Market Revenue Million Forecast, by Encryption 2019 & 2032
- Table 34: Global Optical Encryption Market Revenue Million Forecast, by Data Rate 2019 & 2032
- Table 35: Global Optical Encryption Market Revenue Million Forecast, by End-user Vertical 2019 & 2032
- Table 36: Global Optical Encryption Market Revenue Million Forecast, by Country 2019 & 2032
- Table 37: Germany Optical Encryption Market Revenue (Million) Forecast, by Application 2019 & 2032
- Table 38: United Kingdom Optical Encryption Market Revenue (Million) Forecast, by Application 2019 & 2032
- Table 39: France Optical Encryption Market Revenue (Million) Forecast, by Application 2019 & 2032
- Table 40: Rest of Europe Optical Encryption Market Revenue (Million) Forecast, by Application 2019 & 2032
- Table 41: Global Optical Encryption Market Revenue Million Forecast, by Encryption 2019 & 2032
- Table 42: Global Optical Encryption Market Revenue Million Forecast, by Data Rate 2019 & 2032
- Table 43: Global Optical Encryption Market Revenue Million Forecast, by End-user Vertical 2019 & 2032
- Table 44: Global Optical Encryption Market Revenue Million Forecast, by Country 2019 & 2032
- Table 45: India Optical Encryption Market Revenue (Million) Forecast, by Application 2019 & 2032
- Table 46: China Optical Encryption Market Revenue (Million) Forecast, by Application 2019 & 2032
- Table 47: Japan Optical Encryption Market Revenue (Million) Forecast, by Application 2019 & 2032
- Table 48: Rest of Asia Pacific Optical Encryption Market Revenue (Million) Forecast, by Application 2019 & 2032
- Table 49: Global Optical Encryption Market Revenue Million Forecast, by Encryption 2019 & 2032
- Table 50: Global Optical Encryption Market Revenue Million Forecast, by Data Rate 2019 & 2032
- Table 51: Global Optical Encryption Market Revenue Million Forecast, by End-user Vertical 2019 & 2032
- Table 52: Global Optical Encryption Market Revenue Million Forecast, by Country 2019 & 2032
- Table 53: Brazil Optical Encryption Market Revenue (Million) Forecast, by Application 2019 & 2032
- Table 54: Argentina Optical Encryption Market Revenue (Million) Forecast, by Application 2019 & 2032
- Table 55: Rest of Latin America Optical Encryption Market Revenue (Million) Forecast, by Application 2019 & 2032
- Table 56: Global Optical Encryption Market Revenue Million Forecast, by Encryption 2019 & 2032
- Table 57: Global Optical Encryption Market Revenue Million Forecast, by Data Rate 2019 & 2032
- Table 58: Global Optical Encryption Market Revenue Million Forecast, by End-user Vertical 2019 & 2032
- Table 59: Global Optical Encryption Market Revenue Million Forecast, by Country 2019 & 2032
- Table 60: United Arab Eminates Optical Encryption Market Revenue (Million) Forecast, by Application 2019 & 2032
- Table 61: Saudi Arabia Optical Encryption Market Revenue (Million) Forecast, by Application 2019 & 2032
- Table 62: Rest of Middle East and Africa Optical Encryption Market Revenue (Million) Forecast, by Application 2019 & 2032
Frequently Asked Questions
1. What is the projected Compound Annual Growth Rate (CAGR) of the Optical Encryption Market?
The projected CAGR is approximately 8.10%.
2. Which companies are prominent players in the Optical Encryption Market?
Key companies in the market include ECI Telecom Ltd, Cisco Systems Inc, Broadcom Inc, ADVA, Microsemi Corporation, Arista Networks, Juniper Networks Inc, Thales E-Security*List Not Exhaustive 6 2 Investment Analysi, Huawei Technologies Co Ltd, Nokia Corporation, Acacia Communications, Ciena Corporation.
3. What are the main segments of the Optical Encryption Market?
The market segments include Encryption, Data Rate, End-user Vertical.
4. Can you provide details about the market size?
The market size is estimated to be USD XX Million as of 2022.
5. What are some drivers contributing to market growth?
Increasing Internet Penetration with Demand for High-speed Internet; Technological Innovations by OTN Solution Providers.
6. What are the notable trends driving market growth?
Layer 1 Encryption is Expected to Witness High Growth.
7. Are there any restraints impacting market growth?
Dearth of Skillful Workforce to Add New Solutions in Existing Network.
8. Can you provide examples of recent developments in the market?
N/A
9. What pricing options are available for accessing the report?
Pricing options include single-user, multi-user, and enterprise licenses priced at USD 4750, USD 5250, and USD 8750 respectively.
10. Is the market size provided in terms of value or volume?
The market size is provided in terms of value, measured in Million.
11. Are there any specific market keywords associated with the report?
Yes, the market keyword associated with the report is "Optical Encryption Market," which aids in identifying and referencing the specific market segment covered.
12. How do I determine which pricing option suits my needs best?
The pricing options vary based on user requirements and access needs. Individual users may opt for single-user licenses, while businesses requiring broader access may choose multi-user or enterprise licenses for cost-effective access to the report.
13. Are there any additional resources or data provided in the Optical Encryption Market report?
While the report offers comprehensive insights, it's advisable to review the specific contents or supplementary materials provided to ascertain if additional resources or data are available.
14. How can I stay updated on further developments or reports in the Optical Encryption Market?
To stay informed about further developments, trends, and reports in the Optical Encryption Market, consider subscribing to industry newsletters, following relevant companies and organizations, or regularly checking reputable industry news sources and publications.
Methodology
Step 1 - Identification of Relevant Samples Size from Population Database


Step 2 - Approaches for Defining Global Market Size (Value, Volume* & Price*)

Note*: In applicable scenarios
Step 3 - Data Sources
Primary Research
- Web Analytics
- Survey Reports
- Research Institute
- Latest Research Reports
- Opinion Leaders
Secondary Research
- Annual Reports
- White Paper
- Latest Press Release
- Industry Association
- Paid Database
- Investor Presentations

Step 4 - Data Triangulation
Involves using different sources of information in order to increase the validity of a study
These sources are likely to be stakeholders in a program - participants, other researchers, program staff, other community members, and so on.
Then we put all data in single framework & apply various statistical tools to find out the dynamic on the market.
During the analysis stage, feedback from the stakeholder groups would be compared to determine areas of agreement as well as areas of divergence


