
Key Insights
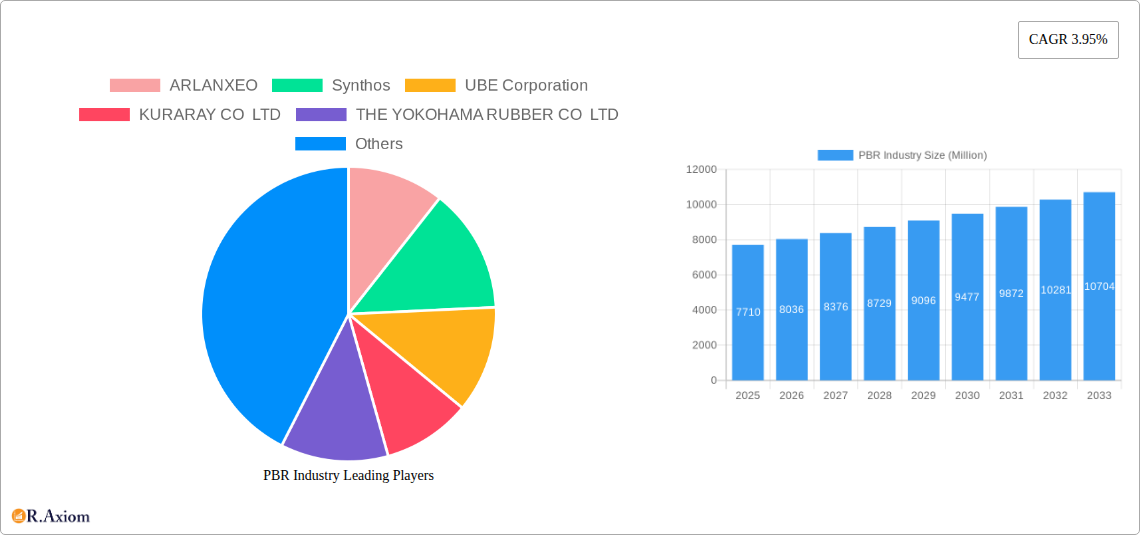
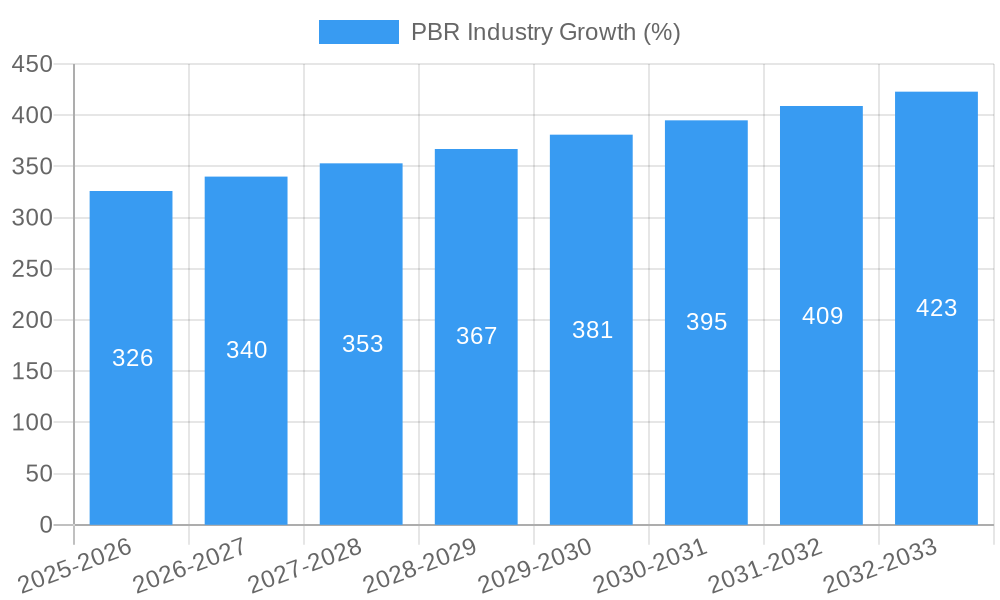
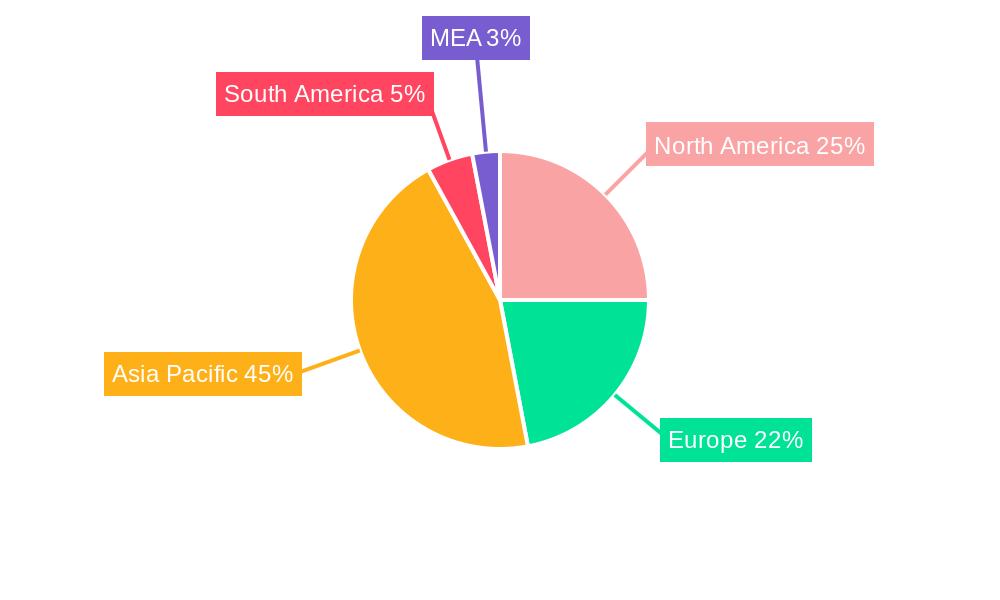
The global Polybutadiene Rubber (PBR) market, valued at $7.71 billion in 2025, is projected to experience steady growth, driven by increasing demand from key applications like tire manufacturing and footwear. A compound annual growth rate (CAGR) of 3.95% from 2025 to 2033 indicates a robust expansion, fueled by the global rise in vehicle production and the burgeoning athletic footwear market. Growth is further supported by advancements in PBR technology, leading to improved product properties like enhanced elasticity and durability. While the market faces constraints such as fluctuating raw material prices and environmental concerns related to production, these challenges are mitigated by ongoing innovations in sustainable manufacturing processes and the increasing adoption of recycled materials within the industry. The Asia-Pacific region, particularly China, India, and Japan, is anticipated to be a major contributor to market growth, owing to substantial manufacturing activities and expanding consumer bases. Significant players like ARLANXEO, Synthos, and Lanxess are actively shaping the market landscape through strategic expansions, mergers, and technological advancements. The segmentation by application (tire manufacturing, footwear, sports accessories, and others) highlights the diverse usage of PBR, promising continuous market expansion across different sectors. The North American and European markets are also expected to witness considerable growth, albeit at a slightly slower pace compared to the Asia-Pacific region, driven by robust automotive and consumer goods industries.
The forecast period (2025-2033) suggests a promising outlook for the PBR market, with continued growth expected across all major geographical segments. The market's resilience is underscored by its strong ties to essential industries like automotive and consumer goods. However, manufacturers must proactively address sustainability concerns and fluctuating raw material costs to ensure long-term profitability and maintain their competitive edge. Future market dynamics will depend heavily on technological innovation, evolving consumer preferences, and regulatory changes concerning environmental impact. The competitive landscape is characterized by both established industry giants and emerging players, leading to a dynamic market with opportunities for strategic partnerships and technological advancements. Careful monitoring of these factors is crucial for predicting the market's trajectory over the coming decade.
Comprehensive Polybutadiene Rubber (PBR) Industry Report: 2019-2033
This in-depth report provides a comprehensive analysis of the global polybutadiene rubber (PBR) industry, covering market trends, competitive landscape, and future growth prospects. The study period spans from 2019 to 2033, with 2025 serving as both the base and estimated year. The report offers invaluable insights for industry stakeholders, investors, and strategic decision-makers seeking to navigate the complexities of this dynamic market. With a focus on actionable intelligence and data-driven analysis, this report is an essential resource for understanding the current state and future trajectory of the PBR industry. The report projects a market value of xx Million by 2033.
PBR Industry Market Concentration & Innovation
The global PBR market exhibits a moderately concentrated structure, with a handful of major players holding significant market share. While precise market share data for each company is proprietary, companies like ARLANXEO, LANXESS, and SIBUR International GmbH are recognized as key players. Innovation in PBR is driven by the need for enhanced performance characteristics (e.g., improved tensile strength, abrasion resistance, and processing efficiency), as well as sustainability concerns related to reduced environmental impact. Regulatory frameworks, particularly those focused on environmental protection and worker safety, heavily influence production methods and product formulations. Product substitutes, such as styrene-butadiene rubber (SBR) and other synthetic rubbers, pose competitive pressure, driving innovation towards differentiated product offerings. End-user trends, such as the increasing demand for high-performance tires and specialized sporting goods, shape PBR market demand. Mergers and acquisitions (M&A) activity has been observed, with deal values varying significantly depending on the size and strategic fit of the companies involved. For example, a recent M&A deal in the industry involved a valuation of xx Million.
- Market Concentration: Moderately concentrated, with key players holding significant shares.
- Innovation Drivers: Enhanced performance, sustainability, regulatory compliance.
- Regulatory Frameworks: Significant influence on production and product formulation.
- Product Substitutes: SBR and other synthetic rubbers.
- M&A Activity: Observed, with varying deal values (xx Million example).
PBR Industry Industry Trends & Insights
The global PBR market is experiencing steady growth, driven by increasing demand from key end-use sectors. The automotive industry, particularly tire manufacturing, remains a dominant driver, fueled by global vehicle production and rising tire consumption. Technological advancements, including the development of specialized PBR grades with enhanced properties, are further fueling market growth. Consumer preferences are shifting towards high-performance and sustainable products, influencing product development and marketing strategies. Competitive dynamics are shaped by factors such as pricing pressures, technological innovation, and regional market variations. The industry is expected to witness a Compound Annual Growth Rate (CAGR) of xx% during the forecast period (2025-2033), with market penetration expected to increase significantly in emerging economies.
Dominant Markets & Segments in PBR Industry
The tire manufacturing segment dominates the PBR market, accounting for the largest share of global consumption. Asia-Pacific is the leading region for PBR consumption, driven primarily by strong automotive production in countries such as China and India.
Key Drivers of Tire Manufacturing Segment Dominance:
- Strong automotive industry growth.
- Increasing tire demand.
- Expanding infrastructure development.
Key Drivers of Asia-Pacific Regional Dominance:
- High automotive production.
- Rising disposable incomes.
- Growing infrastructure projects.
The dominance of the tire manufacturing segment stems from the substantial volume of PBR required in tire production. The Asia-Pacific region's dominance reflects the region's rapid industrialization and economic growth, leading to increased demand for vehicles and, consequently, tires. Other segments like footwear and sports accessories also contribute to PBR demand, but to a lesser extent than tire manufacturing.
PBR Industry Product Developments
Recent product innovations in the PBR industry focus on developing specialized grades with enhanced properties to meet the specific needs of various applications. For example, there's a growing focus on high-performance PBR grades for use in high-performance tires and specialized industrial applications. These developments leverage advancements in polymerization technology and additive incorporation to create customized PBR products with improved characteristics such as increased tensile strength, reduced hysteresis, and better abrasion resistance. This ensures the superior performance demanded by modern industrial and consumer applications.
Report Scope & Segmentation Analysis
This report segments the PBR market by application, including:
- Tire Manufacturing: This segment is expected to witness significant growth driven by the expanding automotive industry and rising tire demand.
- Footwear: The footwear segment demonstrates moderate growth due to the demand for durable and comfortable footwear.
- Sports Accessories: This niche segment exhibits steady growth driven by the expanding sports goods market.
- Other Applications (Chemicals, Polymer Modification, etc.): This segment shows potential for future expansion due to the evolving applications of PBR in various chemical and industrial processes.
Each segment's market size, growth projections, and competitive dynamics are analyzed within the report.
Key Drivers of PBR Industry Growth
Several key factors propel the growth of the PBR industry. Firstly, the expanding automotive sector globally fuels demand for PBR in tire production. Secondly, the increasing demand for high-performance tires necessitates specialized PBR grades with enhanced performance characteristics. Thirdly, the growth of emerging economies and related infrastructure development further boosts PBR consumption.
Challenges in the PBR Industry Sector
The PBR industry faces several challenges, including fluctuating raw material prices (primarily butadiene), stringent environmental regulations that require companies to invest in cleaner production methods, and intense competition from alternative materials and substitutes. Supply chain disruptions can also affect production and pricing, while technological advancements by competitors continuously push for innovation and efficiency improvements. These factors contribute to increased production costs and pressure on profit margins.
Emerging Opportunities in PBR Industry
Significant opportunities exist for the PBR industry. The development of sustainable and biodegradable PBR grades aligns with growing environmental awareness. The expansion into new applications such as bio-based materials and advanced polymer blends offers significant growth potential. Furthermore, exploration of emerging markets in developing economies presents further opportunities for expansion and increased market penetration.
Leading Players in the PBR Industry Market
- ARLANXEO
- Synthos
- UBE Corporation
- KURARAY CO LTD
- THE YOKOHAMA RUBBER CO LTD
- ENEOS Materials Corporation
- Reliance Industries Limited
- ZEON CORPORATION
- KUMHO PETROCHEMICAL
- LANXESS
- SABIC
- Trinseo
- LG Chem
- Versalis S p A
- Indian Oil Corporation Ltd
- SIBUR International GmbH
Key Developments in PBR Industry Industry
- February 2023: Arlanxeo opened a 65 ktpa PBR production plant in southern Brazil, strengthening its Latin American presence.
- March 2022: Indian Oil Corporation Ltd announced plans for a 60 ktpa PBR plant in Panipat, India, with a USD 169 Million investment.
Strategic Outlook for PBR Industry Market
The PBR industry is poised for continued growth, driven by sustained demand from the automotive sector and ongoing technological advancements. The focus on sustainable and high-performance PBR grades will shape future market dynamics. Exploring new applications and expanding into emerging markets presents lucrative opportunities for growth and market leadership in the years to come. The market is projected to reach xx Million by 2033.
PBR Industry Segmentation
-
1. Application
- 1.1. Tire Manufacturing
- 1.2. Footwear
- 1.3. Sports Accessories
- 1.4. Other Ap
PBR Industry Segmentation By Geography
-
1. Asia Pacific
- 1.1. China
- 1.2. India
- 1.3. Japan
- 1.4. South Korea
- 1.5. Indonesia
- 1.6. Malaysia
- 1.7. Thailand
- 1.8. Vietnam
- 1.9. Rest of Asia Pacific
-
2. North America
- 2.1. United States
- 2.2. Canada
- 2.3. Mexico
-
3. Europe
- 3.1. Germany
- 3.2. United Kingdom
- 3.3. Italy
- 3.4. France
- 3.5. Spain
- 3.6. Russia
- 3.7. NORDIC Countries
- 3.8. Turkey
- 3.9. Rest of Europe
-
4. South America
- 4.1. Brazil
- 4.2. Argentina
- 4.3. Colombia
- 4.4. Rest of South America
-
5. Middle East and Africa
- 5.1. Saudi Arabia
- 5.2. South Africa
- 5.3. Qatar
- 5.4. UAE
- 5.5. Nigeria
- 5.6. Egypt
- 5.7. Rest of Middle East and Africa
PBR Industry REPORT HIGHLIGHTS
| Aspects | Details |
|---|---|
| Study Period | 2019-2033 |
| Base Year | 2024 |
| Estimated Year | 2025 |
| Forecast Period | 2025-2033 |
| Historical Period | 2019-2024 |
| Growth Rate | CAGR of 3.95% from 2019-2033 |
| Segmentation |
|
Table of Contents
- 1. Introduction
- 1.1. Research Scope
- 1.2. Market Segmentation
- 1.3. Research Methodology
- 1.4. Definitions and Assumptions
- 2. Executive Summary
- 2.1. Introduction
- 3. Market Dynamics
- 3.1. Introduction
- 3.2. Market Drivers
- 3.2.1. Increasing Demand From the Automobile Industry; Growth in the Synthetic Rubber Industry; Other Drivers
- 3.3. Market Restrains
- 3.3.1. Stringent Enviornmental Regulations; Health Concerns Regarding Exposure to Polybutadiene
- 3.4. Market Trends
- 3.4.1. Tire Manufacturing Application Segment to Dominate The Market
- 4. Market Factor Analysis
- 4.1. Porters Five Forces
- 4.2. Supply/Value Chain
- 4.3. PESTEL analysis
- 4.4. Market Entropy
- 4.5. Patent/Trademark Analysis
- 5. Global PBR Industry Analysis, Insights and Forecast, 2019-2031
- 5.1. Market Analysis, Insights and Forecast - by Application
- 5.1.1. Tire Manufacturing
- 5.1.2. Footwear
- 5.1.3. Sports Accessories
- 5.1.4. Other Ap
- 5.2. Market Analysis, Insights and Forecast - by Region
- 5.2.1. Asia Pacific
- 5.2.2. North America
- 5.2.3. Europe
- 5.2.4. South America
- 5.2.5. Middle East and Africa
- 5.1. Market Analysis, Insights and Forecast - by Application
- 6. Asia Pacific PBR Industry Analysis, Insights and Forecast, 2019-2031
- 6.1. Market Analysis, Insights and Forecast - by Application
- 6.1.1. Tire Manufacturing
- 6.1.2. Footwear
- 6.1.3. Sports Accessories
- 6.1.4. Other Ap
- 6.1. Market Analysis, Insights and Forecast - by Application
- 7. North America PBR Industry Analysis, Insights and Forecast, 2019-2031
- 7.1. Market Analysis, Insights and Forecast - by Application
- 7.1.1. Tire Manufacturing
- 7.1.2. Footwear
- 7.1.3. Sports Accessories
- 7.1.4. Other Ap
- 7.1. Market Analysis, Insights and Forecast - by Application
- 8. Europe PBR Industry Analysis, Insights and Forecast, 2019-2031
- 8.1. Market Analysis, Insights and Forecast - by Application
- 8.1.1. Tire Manufacturing
- 8.1.2. Footwear
- 8.1.3. Sports Accessories
- 8.1.4. Other Ap
- 8.1. Market Analysis, Insights and Forecast - by Application
- 9. South America PBR Industry Analysis, Insights and Forecast, 2019-2031
- 9.1. Market Analysis, Insights and Forecast - by Application
- 9.1.1. Tire Manufacturing
- 9.1.2. Footwear
- 9.1.3. Sports Accessories
- 9.1.4. Other Ap
- 9.1. Market Analysis, Insights and Forecast - by Application
- 10. Middle East and Africa PBR Industry Analysis, Insights and Forecast, 2019-2031
- 10.1. Market Analysis, Insights and Forecast - by Application
- 10.1.1. Tire Manufacturing
- 10.1.2. Footwear
- 10.1.3. Sports Accessories
- 10.1.4. Other Ap
- 10.1. Market Analysis, Insights and Forecast - by Application
- 11. Europe PBR Industry Analysis, Insights and Forecast, 2019-2031
- 11.1. Market Analysis, Insights and Forecast - By Country/Sub-region
- 11.1.1 Germany
- 11.1.2 United Kingdom
- 11.1.3 France
- 11.1.4 Spain
- 11.1.5 Italy
- 11.1.6 Spain
- 11.1.7 Belgium
- 11.1.8 Netherland
- 11.1.9 Nordics
- 11.1.10 Rest of Europe
- 12. Asia Pacific PBR Industry Analysis, Insights and Forecast, 2019-2031
- 12.1. Market Analysis, Insights and Forecast - By Country/Sub-region
- 12.1.1 China
- 12.1.2 Japan
- 12.1.3 India
- 12.1.4 South Korea
- 12.1.5 Southeast Asia
- 12.1.6 Australia
- 12.1.7 Indonesia
- 12.1.8 Phillipes
- 12.1.9 Singapore
- 12.1.10 Thailandc
- 12.1.11 Rest of Asia Pacific
- 13. South America PBR Industry Analysis, Insights and Forecast, 2019-2031
- 13.1. Market Analysis, Insights and Forecast - By Country/Sub-region
- 13.1.1 Brazil
- 13.1.2 Argentina
- 13.1.3 Peru
- 13.1.4 Chile
- 13.1.5 Colombia
- 13.1.6 Ecuador
- 13.1.7 Venezuela
- 13.1.8 Rest of South America
- 14. North America PBR Industry Analysis, Insights and Forecast, 2019-2031
- 14.1. Market Analysis, Insights and Forecast - By Country/Sub-region
- 14.1.1 United States
- 14.1.2 Canada
- 14.1.3 Mexico
- 15. MEA PBR Industry Analysis, Insights and Forecast, 2019-2031
- 15.1. Market Analysis, Insights and Forecast - By Country/Sub-region
- 15.1.1 United Arab Emirates
- 15.1.2 Saudi Arabia
- 15.1.3 South Africa
- 15.1.4 Rest of Middle East and Africa
- 16. Competitive Analysis
- 16.1. Global Market Share Analysis 2024
- 16.2. Company Profiles
- 16.2.1 ARLANXEO
- 16.2.1.1. Overview
- 16.2.1.2. Products
- 16.2.1.3. SWOT Analysis
- 16.2.1.4. Recent Developments
- 16.2.1.5. Financials (Based on Availability)
- 16.2.2 Synthos
- 16.2.2.1. Overview
- 16.2.2.2. Products
- 16.2.2.3. SWOT Analysis
- 16.2.2.4. Recent Developments
- 16.2.2.5. Financials (Based on Availability)
- 16.2.3 UBE Corporation
- 16.2.3.1. Overview
- 16.2.3.2. Products
- 16.2.3.3. SWOT Analysis
- 16.2.3.4. Recent Developments
- 16.2.3.5. Financials (Based on Availability)
- 16.2.4 KURARAY CO LTD
- 16.2.4.1. Overview
- 16.2.4.2. Products
- 16.2.4.3. SWOT Analysis
- 16.2.4.4. Recent Developments
- 16.2.4.5. Financials (Based on Availability)
- 16.2.5 THE YOKOHAMA RUBBER CO LTD
- 16.2.5.1. Overview
- 16.2.5.2. Products
- 16.2.5.3. SWOT Analysis
- 16.2.5.4. Recent Developments
- 16.2.5.5. Financials (Based on Availability)
- 16.2.6 ENEOS Materials Corporation
- 16.2.6.1. Overview
- 16.2.6.2. Products
- 16.2.6.3. SWOT Analysis
- 16.2.6.4. Recent Developments
- 16.2.6.5. Financials (Based on Availability)
- 16.2.7 Reliance Industries Limited
- 16.2.7.1. Overview
- 16.2.7.2. Products
- 16.2.7.3. SWOT Analysis
- 16.2.7.4. Recent Developments
- 16.2.7.5. Financials (Based on Availability)
- 16.2.8 ZEON CORPORATION
- 16.2.8.1. Overview
- 16.2.8.2. Products
- 16.2.8.3. SWOT Analysis
- 16.2.8.4. Recent Developments
- 16.2.8.5. Financials (Based on Availability)
- 16.2.9 KUMHO PETROCHEMICAL
- 16.2.9.1. Overview
- 16.2.9.2. Products
- 16.2.9.3. SWOT Analysis
- 16.2.9.4. Recent Developments
- 16.2.9.5. Financials (Based on Availability)
- 16.2.10 LANXESS
- 16.2.10.1. Overview
- 16.2.10.2. Products
- 16.2.10.3. SWOT Analysis
- 16.2.10.4. Recent Developments
- 16.2.10.5. Financials (Based on Availability)
- 16.2.11 SABIC
- 16.2.11.1. Overview
- 16.2.11.2. Products
- 16.2.11.3. SWOT Analysis
- 16.2.11.4. Recent Developments
- 16.2.11.5. Financials (Based on Availability)
- 16.2.12 Trinseo
- 16.2.12.1. Overview
- 16.2.12.2. Products
- 16.2.12.3. SWOT Analysis
- 16.2.12.4. Recent Developments
- 16.2.12.5. Financials (Based on Availability)
- 16.2.13 LG Chem
- 16.2.13.1. Overview
- 16.2.13.2. Products
- 16.2.13.3. SWOT Analysis
- 16.2.13.4. Recent Developments
- 16.2.13.5. Financials (Based on Availability)
- 16.2.14 Versalis S p A *List Not Exhaustive
- 16.2.14.1. Overview
- 16.2.14.2. Products
- 16.2.14.3. SWOT Analysis
- 16.2.14.4. Recent Developments
- 16.2.14.5. Financials (Based on Availability)
- 16.2.15 Indian Oil Corporation Ltd
- 16.2.15.1. Overview
- 16.2.15.2. Products
- 16.2.15.3. SWOT Analysis
- 16.2.15.4. Recent Developments
- 16.2.15.5. Financials (Based on Availability)
- 16.2.16 SIBUR International GmbH
- 16.2.16.1. Overview
- 16.2.16.2. Products
- 16.2.16.3. SWOT Analysis
- 16.2.16.4. Recent Developments
- 16.2.16.5. Financials (Based on Availability)
- 16.2.1 ARLANXEO
List of Figures
- Figure 1: Global PBR Industry Revenue Breakdown (Million, %) by Region 2024 & 2032
- Figure 2: Europe PBR Industry Revenue (Million), by Country 2024 & 2032
- Figure 3: Europe PBR Industry Revenue Share (%), by Country 2024 & 2032
- Figure 4: Asia Pacific PBR Industry Revenue (Million), by Country 2024 & 2032
- Figure 5: Asia Pacific PBR Industry Revenue Share (%), by Country 2024 & 2032
- Figure 6: South America PBR Industry Revenue (Million), by Country 2024 & 2032
- Figure 7: South America PBR Industry Revenue Share (%), by Country 2024 & 2032
- Figure 8: North America PBR Industry Revenue (Million), by Country 2024 & 2032
- Figure 9: North America PBR Industry Revenue Share (%), by Country 2024 & 2032
- Figure 10: MEA PBR Industry Revenue (Million), by Country 2024 & 2032
- Figure 11: MEA PBR Industry Revenue Share (%), by Country 2024 & 2032
- Figure 12: Asia Pacific PBR Industry Revenue (Million), by Application 2024 & 2032
- Figure 13: Asia Pacific PBR Industry Revenue Share (%), by Application 2024 & 2032
- Figure 14: Asia Pacific PBR Industry Revenue (Million), by Country 2024 & 2032
- Figure 15: Asia Pacific PBR Industry Revenue Share (%), by Country 2024 & 2032
- Figure 16: North America PBR Industry Revenue (Million), by Application 2024 & 2032
- Figure 17: North America PBR Industry Revenue Share (%), by Application 2024 & 2032
- Figure 18: North America PBR Industry Revenue (Million), by Country 2024 & 2032
- Figure 19: North America PBR Industry Revenue Share (%), by Country 2024 & 2032
- Figure 20: Europe PBR Industry Revenue (Million), by Application 2024 & 2032
- Figure 21: Europe PBR Industry Revenue Share (%), by Application 2024 & 2032
- Figure 22: Europe PBR Industry Revenue (Million), by Country 2024 & 2032
- Figure 23: Europe PBR Industry Revenue Share (%), by Country 2024 & 2032
- Figure 24: South America PBR Industry Revenue (Million), by Application 2024 & 2032
- Figure 25: South America PBR Industry Revenue Share (%), by Application 2024 & 2032
- Figure 26: South America PBR Industry Revenue (Million), by Country 2024 & 2032
- Figure 27: South America PBR Industry Revenue Share (%), by Country 2024 & 2032
- Figure 28: Middle East and Africa PBR Industry Revenue (Million), by Application 2024 & 2032
- Figure 29: Middle East and Africa PBR Industry Revenue Share (%), by Application 2024 & 2032
- Figure 30: Middle East and Africa PBR Industry Revenue (Million), by Country 2024 & 2032
- Figure 31: Middle East and Africa PBR Industry Revenue Share (%), by Country 2024 & 2032
List of Tables
- Table 1: Global PBR Industry Revenue Million Forecast, by Region 2019 & 2032
- Table 2: Global PBR Industry Revenue Million Forecast, by Application 2019 & 2032
- Table 3: Global PBR Industry Revenue Million Forecast, by Region 2019 & 2032
- Table 4: Global PBR Industry Revenue Million Forecast, by Country 2019 & 2032
- Table 5: Germany PBR Industry Revenue (Million) Forecast, by Application 2019 & 2032
- Table 6: United Kingdom PBR Industry Revenue (Million) Forecast, by Application 2019 & 2032
- Table 7: France PBR Industry Revenue (Million) Forecast, by Application 2019 & 2032
- Table 8: Spain PBR Industry Revenue (Million) Forecast, by Application 2019 & 2032
- Table 9: Italy PBR Industry Revenue (Million) Forecast, by Application 2019 & 2032
- Table 10: Spain PBR Industry Revenue (Million) Forecast, by Application 2019 & 2032
- Table 11: Belgium PBR Industry Revenue (Million) Forecast, by Application 2019 & 2032
- Table 12: Netherland PBR Industry Revenue (Million) Forecast, by Application 2019 & 2032
- Table 13: Nordics PBR Industry Revenue (Million) Forecast, by Application 2019 & 2032
- Table 14: Rest of Europe PBR Industry Revenue (Million) Forecast, by Application 2019 & 2032
- Table 15: Global PBR Industry Revenue Million Forecast, by Country 2019 & 2032
- Table 16: China PBR Industry Revenue (Million) Forecast, by Application 2019 & 2032
- Table 17: Japan PBR Industry Revenue (Million) Forecast, by Application 2019 & 2032
- Table 18: India PBR Industry Revenue (Million) Forecast, by Application 2019 & 2032
- Table 19: South Korea PBR Industry Revenue (Million) Forecast, by Application 2019 & 2032
- Table 20: Southeast Asia PBR Industry Revenue (Million) Forecast, by Application 2019 & 2032
- Table 21: Australia PBR Industry Revenue (Million) Forecast, by Application 2019 & 2032
- Table 22: Indonesia PBR Industry Revenue (Million) Forecast, by Application 2019 & 2032
- Table 23: Phillipes PBR Industry Revenue (Million) Forecast, by Application 2019 & 2032
- Table 24: Singapore PBR Industry Revenue (Million) Forecast, by Application 2019 & 2032
- Table 25: Thailandc PBR Industry Revenue (Million) Forecast, by Application 2019 & 2032
- Table 26: Rest of Asia Pacific PBR Industry Revenue (Million) Forecast, by Application 2019 & 2032
- Table 27: Global PBR Industry Revenue Million Forecast, by Country 2019 & 2032
- Table 28: Brazil PBR Industry Revenue (Million) Forecast, by Application 2019 & 2032
- Table 29: Argentina PBR Industry Revenue (Million) Forecast, by Application 2019 & 2032
- Table 30: Peru PBR Industry Revenue (Million) Forecast, by Application 2019 & 2032
- Table 31: Chile PBR Industry Revenue (Million) Forecast, by Application 2019 & 2032
- Table 32: Colombia PBR Industry Revenue (Million) Forecast, by Application 2019 & 2032
- Table 33: Ecuador PBR Industry Revenue (Million) Forecast, by Application 2019 & 2032
- Table 34: Venezuela PBR Industry Revenue (Million) Forecast, by Application 2019 & 2032
- Table 35: Rest of South America PBR Industry Revenue (Million) Forecast, by Application 2019 & 2032
- Table 36: Global PBR Industry Revenue Million Forecast, by Country 2019 & 2032
- Table 37: United States PBR Industry Revenue (Million) Forecast, by Application 2019 & 2032
- Table 38: Canada PBR Industry Revenue (Million) Forecast, by Application 2019 & 2032
- Table 39: Mexico PBR Industry Revenue (Million) Forecast, by Application 2019 & 2032
- Table 40: Global PBR Industry Revenue Million Forecast, by Country 2019 & 2032
- Table 41: United Arab Emirates PBR Industry Revenue (Million) Forecast, by Application 2019 & 2032
- Table 42: Saudi Arabia PBR Industry Revenue (Million) Forecast, by Application 2019 & 2032
- Table 43: South Africa PBR Industry Revenue (Million) Forecast, by Application 2019 & 2032
- Table 44: Rest of Middle East and Africa PBR Industry Revenue (Million) Forecast, by Application 2019 & 2032
- Table 45: Global PBR Industry Revenue Million Forecast, by Application 2019 & 2032
- Table 46: Global PBR Industry Revenue Million Forecast, by Country 2019 & 2032
- Table 47: China PBR Industry Revenue (Million) Forecast, by Application 2019 & 2032
- Table 48: India PBR Industry Revenue (Million) Forecast, by Application 2019 & 2032
- Table 49: Japan PBR Industry Revenue (Million) Forecast, by Application 2019 & 2032
- Table 50: South Korea PBR Industry Revenue (Million) Forecast, by Application 2019 & 2032
- Table 51: Indonesia PBR Industry Revenue (Million) Forecast, by Application 2019 & 2032
- Table 52: Malaysia PBR Industry Revenue (Million) Forecast, by Application 2019 & 2032
- Table 53: Thailand PBR Industry Revenue (Million) Forecast, by Application 2019 & 2032
- Table 54: Vietnam PBR Industry Revenue (Million) Forecast, by Application 2019 & 2032
- Table 55: Rest of Asia Pacific PBR Industry Revenue (Million) Forecast, by Application 2019 & 2032
- Table 56: Global PBR Industry Revenue Million Forecast, by Application 2019 & 2032
- Table 57: Global PBR Industry Revenue Million Forecast, by Country 2019 & 2032
- Table 58: United States PBR Industry Revenue (Million) Forecast, by Application 2019 & 2032
- Table 59: Canada PBR Industry Revenue (Million) Forecast, by Application 2019 & 2032
- Table 60: Mexico PBR Industry Revenue (Million) Forecast, by Application 2019 & 2032
- Table 61: Global PBR Industry Revenue Million Forecast, by Application 2019 & 2032
- Table 62: Global PBR Industry Revenue Million Forecast, by Country 2019 & 2032
- Table 63: Germany PBR Industry Revenue (Million) Forecast, by Application 2019 & 2032
- Table 64: United Kingdom PBR Industry Revenue (Million) Forecast, by Application 2019 & 2032
- Table 65: Italy PBR Industry Revenue (Million) Forecast, by Application 2019 & 2032
- Table 66: France PBR Industry Revenue (Million) Forecast, by Application 2019 & 2032
- Table 67: Spain PBR Industry Revenue (Million) Forecast, by Application 2019 & 2032
- Table 68: Russia PBR Industry Revenue (Million) Forecast, by Application 2019 & 2032
- Table 69: NORDIC Countries PBR Industry Revenue (Million) Forecast, by Application 2019 & 2032
- Table 70: Turkey PBR Industry Revenue (Million) Forecast, by Application 2019 & 2032
- Table 71: Rest of Europe PBR Industry Revenue (Million) Forecast, by Application 2019 & 2032
- Table 72: Global PBR Industry Revenue Million Forecast, by Application 2019 & 2032
- Table 73: Global PBR Industry Revenue Million Forecast, by Country 2019 & 2032
- Table 74: Brazil PBR Industry Revenue (Million) Forecast, by Application 2019 & 2032
- Table 75: Argentina PBR Industry Revenue (Million) Forecast, by Application 2019 & 2032
- Table 76: Colombia PBR Industry Revenue (Million) Forecast, by Application 2019 & 2032
- Table 77: Rest of South America PBR Industry Revenue (Million) Forecast, by Application 2019 & 2032
- Table 78: Global PBR Industry Revenue Million Forecast, by Application 2019 & 2032
- Table 79: Global PBR Industry Revenue Million Forecast, by Country 2019 & 2032
- Table 80: Saudi Arabia PBR Industry Revenue (Million) Forecast, by Application 2019 & 2032
- Table 81: South Africa PBR Industry Revenue (Million) Forecast, by Application 2019 & 2032
- Table 82: Qatar PBR Industry Revenue (Million) Forecast, by Application 2019 & 2032
- Table 83: UAE PBR Industry Revenue (Million) Forecast, by Application 2019 & 2032
- Table 84: Nigeria PBR Industry Revenue (Million) Forecast, by Application 2019 & 2032
- Table 85: Egypt PBR Industry Revenue (Million) Forecast, by Application 2019 & 2032
- Table 86: Rest of Middle East and Africa PBR Industry Revenue (Million) Forecast, by Application 2019 & 2032
Frequently Asked Questions
1. What is the projected Compound Annual Growth Rate (CAGR) of the PBR Industry?
The projected CAGR is approximately 3.95%.
2. Which companies are prominent players in the PBR Industry?
Key companies in the market include ARLANXEO, Synthos, UBE Corporation, KURARAY CO LTD, THE YOKOHAMA RUBBER CO LTD, ENEOS Materials Corporation, Reliance Industries Limited, ZEON CORPORATION, KUMHO PETROCHEMICAL, LANXESS, SABIC, Trinseo, LG Chem, Versalis S p A *List Not Exhaustive, Indian Oil Corporation Ltd, SIBUR International GmbH.
3. What are the main segments of the PBR Industry?
The market segments include Application.
4. Can you provide details about the market size?
The market size is estimated to be USD 7.71 Million as of 2022.
5. What are some drivers contributing to market growth?
Increasing Demand From the Automobile Industry; Growth in the Synthetic Rubber Industry; Other Drivers.
6. What are the notable trends driving market growth?
Tire Manufacturing Application Segment to Dominate The Market.
7. Are there any restraints impacting market growth?
Stringent Enviornmental Regulations; Health Concerns Regarding Exposure to Polybutadiene.
8. Can you provide examples of recent developments in the market?
February 2023:Arlanxeo revealed the commencement of a 65 ktpa polybutadiene rubber production plant in southern Brazil. This new facility, situated in the Triunfo petrochemical complex in Rio Grande do Sul, underlines the company's dedication to strengthening its presence in Latin America.
9. What pricing options are available for accessing the report?
Pricing options include single-user, multi-user, and enterprise licenses priced at USD 4750, USD 5250, and USD 8750 respectively.
10. Is the market size provided in terms of value or volume?
The market size is provided in terms of value, measured in Million.
11. Are there any specific market keywords associated with the report?
Yes, the market keyword associated with the report is "PBR Industry," which aids in identifying and referencing the specific market segment covered.
12. How do I determine which pricing option suits my needs best?
The pricing options vary based on user requirements and access needs. Individual users may opt for single-user licenses, while businesses requiring broader access may choose multi-user or enterprise licenses for cost-effective access to the report.
13. Are there any additional resources or data provided in the PBR Industry report?
While the report offers comprehensive insights, it's advisable to review the specific contents or supplementary materials provided to ascertain if additional resources or data are available.
14. How can I stay updated on further developments or reports in the PBR Industry?
To stay informed about further developments, trends, and reports in the PBR Industry, consider subscribing to industry newsletters, following relevant companies and organizations, or regularly checking reputable industry news sources and publications.
Methodology
Step 1 - Identification of Relevant Samples Size from Population Database


Step 2 - Approaches for Defining Global Market Size (Value, Volume* & Price*)

Note*: In applicable scenarios
Step 3 - Data Sources
Primary Research
- Web Analytics
- Survey Reports
- Research Institute
- Latest Research Reports
- Opinion Leaders
Secondary Research
- Annual Reports
- White Paper
- Latest Press Release
- Industry Association
- Paid Database
- Investor Presentations

Step 4 - Data Triangulation
Involves using different sources of information in order to increase the validity of a study
These sources are likely to be stakeholders in a program - participants, other researchers, program staff, other community members, and so on.
Then we put all data in single framework & apply various statistical tools to find out the dynamic on the market.
During the analysis stage, feedback from the stakeholder groups would be compared to determine areas of agreement as well as areas of divergence


