
Key Insights
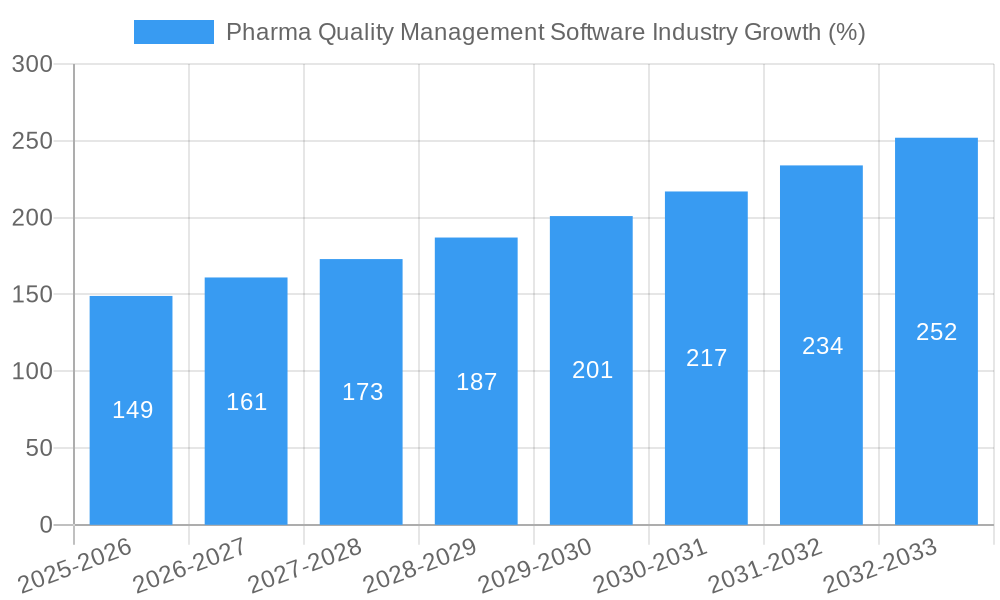
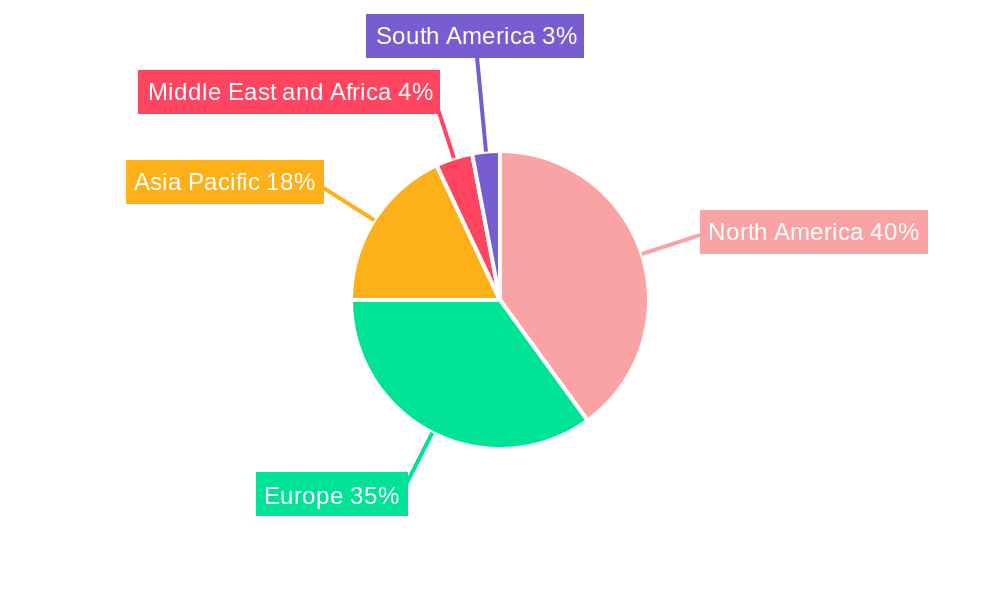
The Pharma Quality Management Software (PQMS) market is experiencing robust growth, driven by increasing regulatory scrutiny, the need for enhanced data management, and a growing emphasis on proactive quality control within the pharmaceutical industry. With a Compound Annual Growth Rate (CAGR) of 9.90% from 2019 to 2024, and a projected continuation of this trend, the market is poised for significant expansion. The market's segmentation reveals key growth areas: Cloud-based solutions are gaining traction due to their scalability and accessibility, while large enterprises represent a significant portion of the market share due to their greater investment capacity in advanced software solutions. Corrective Action Preventive Action (CAPA) management, Audit Management, and Document Management modules remain core components of PQMS systems, contributing significantly to overall market revenue. However, emerging areas such as Complaints Management and Supplier Quality Management are showing rapid growth, reflecting the industry's shift towards a more holistic and integrated approach to quality control. Geographic distribution reveals a strong presence in North America and Europe, driven by established regulatory frameworks and a high concentration of pharmaceutical companies. However, the Asia-Pacific region is also witnessing significant growth, driven by expanding pharmaceutical manufacturing and stricter regulatory requirements in key markets like China and India. The competitive landscape is characterized by a mix of established players and emerging niche providers, suggesting further market consolidation and innovation in the coming years. This dynamic environment presents both opportunities and challenges for existing and new market entrants.
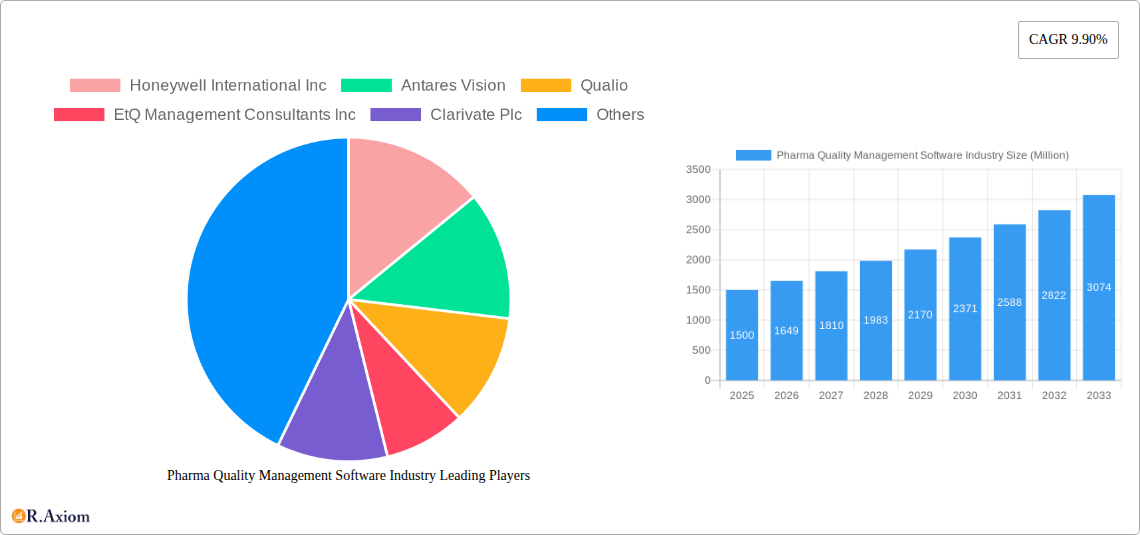
The competitive landscape is highly dynamic, with established players such as Honeywell, Veeva Systems, and Dassault Systèmes competing with specialized firms like Qualio and ComplianceQuest. Successful vendors will need to adapt to evolving industry needs, such as providing integrated solutions, enhanced data analytics capabilities, and seamless integration with other enterprise systems. The market's future growth will be significantly influenced by factors like the pace of technological advancements, the adoption of cloud-based solutions, and the evolving regulatory landscape. The increasing demand for robust and compliant quality management systems will continue to fuel market expansion, leading to the development of even more sophisticated and integrated solutions in the coming years. Furthermore, the increasing focus on patient safety and data security will continue to drive the adoption of PQMS solutions across the industry.
Pharma Quality Management Software Industry Market Report: 2019-2033
This comprehensive report provides an in-depth analysis of the Pharma Quality Management Software industry, offering valuable insights for stakeholders, investors, and industry professionals. Covering the period from 2019 to 2033, with a focus on 2025, this report meticulously examines market dynamics, competitive landscapes, and future growth prospects. The report leverages extensive data analysis and expert insights to present a clear and actionable strategic overview. The total market size in 2025 is estimated at $XX Million.
Pharma Quality Management Software Industry Market Concentration & Innovation
The Pharma Quality Management Software market exhibits a moderately concentrated landscape, with several major players holding significant market share. While precise market share data for each company is proprietary, key players such as Veeva Systems Inc., Honeywell International Inc., and IQVIA are estimated to collectively hold a significant portion (around 40%) of the overall market. This concentration is primarily driven by their extensive product portfolios, strong brand recognition, and established customer bases. However, smaller, specialized companies are also gaining traction by focusing on niche segments and offering innovative solutions.
Several factors drive innovation within this sector:
- Stringent Regulatory Compliance: The pharmaceutical industry operates under strict regulatory frameworks (e.g., FDA, EMA), necessitating continuous improvement in quality management systems. This drives the need for advanced software solutions.
- Technological Advancements: The emergence of AI, machine learning, and cloud computing technologies is revolutionizing quality management processes, improving efficiency, and enhancing data analytics capabilities.
- Growing Data Volumes: The increasing complexity of pharmaceutical products and manufacturing processes results in a massive surge in data, requiring robust software for effective management and analysis.
Mergers and Acquisitions (M&A) activity is relatively frequent, with deal values ranging from $XX Million to $XX Million in recent years. These acquisitions often involve larger companies acquiring smaller, specialized firms to expand their product offerings or enter new markets. For example, the acquisition of [Company X] by [Company Y] in [Year] expanded [Company Y]'s capabilities in [Specific Area].
Pharma Quality Management Software Industry Industry Trends & Insights
The Pharma Quality Management Software market is experiencing robust growth, with a projected Compound Annual Growth Rate (CAGR) of XX% during the forecast period (2025-2033). This growth is fueled by several key factors:
- Increasing Adoption of Cloud-Based Solutions: The shift towards cloud deployment models is accelerating, driven by scalability, cost-effectiveness, and enhanced accessibility. Cloud-based solutions now account for approximately XX% of the market and are projected to grow to XX% by 2033.
- Rising Demand for Integrated Solutions: Pharma companies are increasingly seeking integrated platforms that seamlessly manage various aspects of quality management, streamlining operations and enhancing data visibility. Market penetration of these integrated systems is expected to reach XX% by 2033.
- Growing Focus on Data Analytics and Business Intelligence: Advanced analytics are enabling pharmaceutical companies to extract valuable insights from quality data, improving decision-making and proactively mitigating risks.
- Increased Regulatory Scrutiny: The intensified regulatory pressure compels companies to invest in sophisticated quality management systems, driving market expansion.
Consumer preferences are shifting towards solutions that offer greater user-friendliness, intuitive interfaces, and seamless integration with existing enterprise systems. Competitive dynamics are intense, characterized by product differentiation, strategic partnerships, and continuous innovation.
Dominant Markets & Segments in Pharma Quality Management Software Industry
The North American region currently dominates the Pharma Quality Management Software market, driven by strong regulatory compliance requirements, high technological adoption rates, and a large pharmaceutical industry presence. Within this region, the United States holds the largest market share.
Key segment dominance is observed in:
- Solution Type: CAPA Management and Audit Management solutions currently hold the largest market share, due to their critical role in ensuring regulatory compliance.
- Deployment: Cloud-based deployments are witnessing rapid growth and are expected to surpass on-premise solutions in market share by 2030.
- Enterprise Size: Large enterprises dominate the market, owing to their higher budgets and greater need for sophisticated quality management systems. However, SME adoption is also increasing, driven by the availability of cost-effective cloud-based solutions.
Key Drivers of Regional/Segment Dominance:
- North America: Stringent regulatory frameworks, high technological adoption, and a large pharmaceutical industry.
- CAPA & Audit Management: Critical role in regulatory compliance.
- Cloud Deployment: Cost-effectiveness, scalability, and accessibility.
- Large Enterprises: Higher budgets and complex quality management needs.
Pharma Quality Management Software Industry Product Developments
Recent product innovations focus on enhancing user experience, improving data analytics capabilities, and integrating advanced technologies such as AI and machine learning. Solutions are increasingly incorporating features such as predictive analytics, real-time dashboards, and automated workflows to streamline quality management processes. The emphasis is on providing solutions that are highly configurable, scalable, and adaptable to meet the evolving needs of pharmaceutical companies across different segments and geographies. These innovations are driving competitive advantage by improving operational efficiency, reducing costs, and enhancing regulatory compliance.
Report Scope & Segmentation Analysis
This report provides a detailed analysis of the Pharma Quality Management Software market across various segments, including:
Solution Type: CAPA Management, Audit Management, Document Management, Change Management, Training Management, Complaints Management, Regulatory and Compliance Management, Non-Conformances Handling, Supplier Quality Management, Inspection Management, and Other solution Types. Each segment's growth projections, market size, and competitive dynamics are analyzed.
Deployment: On-Cloud and On-Premise. Growth projections, market sizes, and competitive dynamics within each deployment model are assessed.
Enterprise Size: Small and Medium Enterprise (SME) and Large Enterprise. The report investigates the unique requirements and preferences of each enterprise size and analyzes their impact on market growth.
Key Drivers of Pharma Quality Management Software Industry Growth
Several factors are driving the growth of the Pharma Quality Management Software market:
- Stringent Regulatory Compliance: Increased regulatory scrutiny is pushing pharmaceutical companies to adopt robust quality management systems.
- Growing Data Volumes and Complexity: The increasing volume and complexity of data necessitate advanced software solutions for efficient management and analysis.
- Technological Advancements: Innovations in AI, machine learning, and cloud computing are enhancing quality management processes.
- Improved Operational Efficiency: Software solutions automate tasks, reduce manual errors, and streamline workflows.
Challenges in the Pharma Quality Management Software Industry Sector
The Pharma Quality Management Software industry faces certain challenges:
- High Implementation Costs: The initial investment required for implementing software can be substantial, particularly for large enterprises.
- Integration Challenges: Integrating new software with existing systems can be complex and time-consuming.
- Data Security and Privacy Concerns: Protecting sensitive patient data and maintaining regulatory compliance related to data security are crucial challenges.
- Competition: The market is highly competitive, with numerous players offering similar solutions.
Emerging Opportunities in Pharma Quality Management Software Industry
The industry presents several promising opportunities:
- Expansion into Emerging Markets: Developing countries are experiencing growing demand for quality management solutions, presenting substantial growth potential.
- Integration with IoT Devices: Integrating software with IoT devices for real-time data monitoring can improve efficiency and enhance decision-making.
- AI-Powered Predictive Analytics: The application of AI in predictive analytics can help identify potential quality issues proactively.
- Focus on User Experience: User-friendly interfaces and intuitive designs will become increasingly important in attracting and retaining customers.
Leading Players in the Pharma Quality Management Software Industry Market
- Honeywell International Inc
- Antares Vision
- Qualio
- EtQ Management Consultants Inc
- Clarivate Plc
- AssurX Inc
- Veeva Systems Inc
- AXSource
- IQVIA
- Ideagen PLC
- ComplianceQuest
- Dassault Systemes
Key Developments in Pharma Quality Management Software Industry Industry
- August 2022: The National Pharmaceutical Pricing Authority (NPPA) launched Integrated Pharmaceutical Database Management System 2.0 and Pharma Sahi Daam 2.0 apps, enhancing business ease. This influenced software demand for data integration and reporting.
- December 2022: FILTEC launched a new Remote Vision Inspection (RVI) system, impacting the inspection management software segment by providing enhanced automation capabilities.
- January 2023: Palantir Technologies Inc. launched a Quality Management System for life sciences customers, focusing on GxP compliance, leading to increased competition in the regulatory compliance software space.
Strategic Outlook for Pharma Quality Management Software Industry Market
The Pharma Quality Management Software market is poised for sustained growth, driven by ongoing technological advancements, increasing regulatory pressure, and the growing need for efficient quality management solutions. Companies that can leverage AI, machine learning, and cloud technologies to provide innovative, user-friendly, and integrated solutions will be well-positioned to capture significant market share. The focus on data analytics, predictive capabilities, and seamless integration with other enterprise systems will continue to be key differentiators. Expansion into emerging markets and catering to the specific needs of SMEs represent further growth opportunities.
Pharma Quality Management Software Industry Segmentation
-
1. Solution Type
- 1.1. Correcti
- 1.2. Audit Management
- 1.3. Document Management
- 1.4. Change Management
- 1.5. Training Management
- 1.6. Complaints Management
- 1.7. Regulatory and Compliance Management
- 1.8. Non-Conformances Handling
- 1.9. Supplier Quality Management
- 1.10. Inspection Management
- 1.11. Other solution Types
-
2. Deployment
- 2.1. On Cloud
- 2.2. On-premise
-
3. Enterprize Size
- 3.1. Small and Medium Enterprise (SME)
- 3.2. Large Enterprise
Pharma Quality Management Software Industry Segmentation By Geography
-
1. North America
- 1.1. United States
- 1.2. Canada
- 1.3. Mexico
-
2. Europe
- 2.1. Germany
- 2.2. United Kingdom
- 2.3. France
- 2.4. Italy
- 2.5. Spain
- 2.6. Rest of Europe
-
3. Asia Pacific
- 3.1. China
- 3.2. Japan
- 3.3. India
- 3.4. Australia
- 3.5. South Korea
- 3.6. Rest of Asia Pacific
-
4. Middle East and Africa
- 4.1. GCC
- 4.2. South Africa
- 4.3. Rest of Middle East and Africa
-
5. South America
- 5.1. Brazil
- 5.2. Argentina
- 5.3. Rest of South America
Pharma Quality Management Software Industry REPORT HIGHLIGHTS
| Aspects | Details |
|---|---|
| Study Period | 2019-2033 |
| Base Year | 2024 |
| Estimated Year | 2025 |
| Forecast Period | 2025-2033 |
| Historical Period | 2019-2024 |
| Growth Rate | CAGR of 9.90% from 2019-2033 |
| Segmentation |
|
Table of Contents
- 1. Introduction
- 1.1. Research Scope
- 1.2. Market Segmentation
- 1.3. Research Methodology
- 1.4. Definitions and Assumptions
- 2. Executive Summary
- 2.1. Introduction
- 3. Market Dynamics
- 3.1. Introduction
- 3.2. Market Drivers
- 3.2.1. Increasing Cost of Drugs Manufacturing; Growing Technology Adoption in Pharmaceutical Industry
- 3.3. Market Restrains
- 3.3.1. Security Concerns Pertaining to On-Cloud Deployment; Lack of Regulations for Pharmaceutical Quality Management Software
- 3.4. Market Trends
- 3.4.1. Regulatory and Compliance Management Segment is Expected to Hold Significant Market Share Over the Forecast Period
- 4. Market Factor Analysis
- 4.1. Porters Five Forces
- 4.2. Supply/Value Chain
- 4.3. PESTEL analysis
- 4.4. Market Entropy
- 4.5. Patent/Trademark Analysis
- 5. Global Pharma Quality Management Software Industry Analysis, Insights and Forecast, 2019-2031
- 5.1. Market Analysis, Insights and Forecast - by Solution Type
- 5.1.1. Correcti
- 5.1.2. Audit Management
- 5.1.3. Document Management
- 5.1.4. Change Management
- 5.1.5. Training Management
- 5.1.6. Complaints Management
- 5.1.7. Regulatory and Compliance Management
- 5.1.8. Non-Conformances Handling
- 5.1.9. Supplier Quality Management
- 5.1.10. Inspection Management
- 5.1.11. Other solution Types
- 5.2. Market Analysis, Insights and Forecast - by Deployment
- 5.2.1. On Cloud
- 5.2.2. On-premise
- 5.3. Market Analysis, Insights and Forecast - by Enterprize Size
- 5.3.1. Small and Medium Enterprise (SME)
- 5.3.2. Large Enterprise
- 5.4. Market Analysis, Insights and Forecast - by Region
- 5.4.1. North America
- 5.4.2. Europe
- 5.4.3. Asia Pacific
- 5.4.4. Middle East and Africa
- 5.4.5. South America
- 5.1. Market Analysis, Insights and Forecast - by Solution Type
- 6. North America Pharma Quality Management Software Industry Analysis, Insights and Forecast, 2019-2031
- 6.1. Market Analysis, Insights and Forecast - by Solution Type
- 6.1.1. Correcti
- 6.1.2. Audit Management
- 6.1.3. Document Management
- 6.1.4. Change Management
- 6.1.5. Training Management
- 6.1.6. Complaints Management
- 6.1.7. Regulatory and Compliance Management
- 6.1.8. Non-Conformances Handling
- 6.1.9. Supplier Quality Management
- 6.1.10. Inspection Management
- 6.1.11. Other solution Types
- 6.2. Market Analysis, Insights and Forecast - by Deployment
- 6.2.1. On Cloud
- 6.2.2. On-premise
- 6.3. Market Analysis, Insights and Forecast - by Enterprize Size
- 6.3.1. Small and Medium Enterprise (SME)
- 6.3.2. Large Enterprise
- 6.1. Market Analysis, Insights and Forecast - by Solution Type
- 7. Europe Pharma Quality Management Software Industry Analysis, Insights and Forecast, 2019-2031
- 7.1. Market Analysis, Insights and Forecast - by Solution Type
- 7.1.1. Correcti
- 7.1.2. Audit Management
- 7.1.3. Document Management
- 7.1.4. Change Management
- 7.1.5. Training Management
- 7.1.6. Complaints Management
- 7.1.7. Regulatory and Compliance Management
- 7.1.8. Non-Conformances Handling
- 7.1.9. Supplier Quality Management
- 7.1.10. Inspection Management
- 7.1.11. Other solution Types
- 7.2. Market Analysis, Insights and Forecast - by Deployment
- 7.2.1. On Cloud
- 7.2.2. On-premise
- 7.3. Market Analysis, Insights and Forecast - by Enterprize Size
- 7.3.1. Small and Medium Enterprise (SME)
- 7.3.2. Large Enterprise
- 7.1. Market Analysis, Insights and Forecast - by Solution Type
- 8. Asia Pacific Pharma Quality Management Software Industry Analysis, Insights and Forecast, 2019-2031
- 8.1. Market Analysis, Insights and Forecast - by Solution Type
- 8.1.1. Correcti
- 8.1.2. Audit Management
- 8.1.3. Document Management
- 8.1.4. Change Management
- 8.1.5. Training Management
- 8.1.6. Complaints Management
- 8.1.7. Regulatory and Compliance Management
- 8.1.8. Non-Conformances Handling
- 8.1.9. Supplier Quality Management
- 8.1.10. Inspection Management
- 8.1.11. Other solution Types
- 8.2. Market Analysis, Insights and Forecast - by Deployment
- 8.2.1. On Cloud
- 8.2.2. On-premise
- 8.3. Market Analysis, Insights and Forecast - by Enterprize Size
- 8.3.1. Small and Medium Enterprise (SME)
- 8.3.2. Large Enterprise
- 8.1. Market Analysis, Insights and Forecast - by Solution Type
- 9. Middle East and Africa Pharma Quality Management Software Industry Analysis, Insights and Forecast, 2019-2031
- 9.1. Market Analysis, Insights and Forecast - by Solution Type
- 9.1.1. Correcti
- 9.1.2. Audit Management
- 9.1.3. Document Management
- 9.1.4. Change Management
- 9.1.5. Training Management
- 9.1.6. Complaints Management
- 9.1.7. Regulatory and Compliance Management
- 9.1.8. Non-Conformances Handling
- 9.1.9. Supplier Quality Management
- 9.1.10. Inspection Management
- 9.1.11. Other solution Types
- 9.2. Market Analysis, Insights and Forecast - by Deployment
- 9.2.1. On Cloud
- 9.2.2. On-premise
- 9.3. Market Analysis, Insights and Forecast - by Enterprize Size
- 9.3.1. Small and Medium Enterprise (SME)
- 9.3.2. Large Enterprise
- 9.1. Market Analysis, Insights and Forecast - by Solution Type
- 10. South America Pharma Quality Management Software Industry Analysis, Insights and Forecast, 2019-2031
- 10.1. Market Analysis, Insights and Forecast - by Solution Type
- 10.1.1. Correcti
- 10.1.2. Audit Management
- 10.1.3. Document Management
- 10.1.4. Change Management
- 10.1.5. Training Management
- 10.1.6. Complaints Management
- 10.1.7. Regulatory and Compliance Management
- 10.1.8. Non-Conformances Handling
- 10.1.9. Supplier Quality Management
- 10.1.10. Inspection Management
- 10.1.11. Other solution Types
- 10.2. Market Analysis, Insights and Forecast - by Deployment
- 10.2.1. On Cloud
- 10.2.2. On-premise
- 10.3. Market Analysis, Insights and Forecast - by Enterprize Size
- 10.3.1. Small and Medium Enterprise (SME)
- 10.3.2. Large Enterprise
- 10.1. Market Analysis, Insights and Forecast - by Solution Type
- 11. North America Pharma Quality Management Software Industry Analysis, Insights and Forecast, 2019-2031
- 11.1. Market Analysis, Insights and Forecast - By Country/Sub-region
- 11.1.1 United States
- 11.1.2 Canada
- 11.1.3 Mexico
- 12. Europe Pharma Quality Management Software Industry Analysis, Insights and Forecast, 2019-2031
- 12.1. Market Analysis, Insights and Forecast - By Country/Sub-region
- 12.1.1 Germany
- 12.1.2 United Kingdom
- 12.1.3 France
- 12.1.4 Italy
- 12.1.5 Spain
- 12.1.6 Rest of Europe
- 13. Asia Pacific Pharma Quality Management Software Industry Analysis, Insights and Forecast, 2019-2031
- 13.1. Market Analysis, Insights and Forecast - By Country/Sub-region
- 13.1.1 China
- 13.1.2 Japan
- 13.1.3 India
- 13.1.4 Australia
- 13.1.5 South Korea
- 13.1.6 Rest of Asia Pacific
- 14. Middle East and Africa Pharma Quality Management Software Industry Analysis, Insights and Forecast, 2019-2031
- 14.1. Market Analysis, Insights and Forecast - By Country/Sub-region
- 14.1.1 GCC
- 14.1.2 South Africa
- 14.1.3 Rest of Middle East and Africa
- 15. South America Pharma Quality Management Software Industry Analysis, Insights and Forecast, 2019-2031
- 15.1. Market Analysis, Insights and Forecast - By Country/Sub-region
- 15.1.1 Brazil
- 15.1.2 Argentina
- 15.1.3 Rest of South America
- 16. Competitive Analysis
- 16.1. Global Market Share Analysis 2024
- 16.2. Company Profiles
- 16.2.1 Honeywell International Inc
- 16.2.1.1. Overview
- 16.2.1.2. Products
- 16.2.1.3. SWOT Analysis
- 16.2.1.4. Recent Developments
- 16.2.1.5. Financials (Based on Availability)
- 16.2.2 Antares Vision
- 16.2.2.1. Overview
- 16.2.2.2. Products
- 16.2.2.3. SWOT Analysis
- 16.2.2.4. Recent Developments
- 16.2.2.5. Financials (Based on Availability)
- 16.2.3 Qualio
- 16.2.3.1. Overview
- 16.2.3.2. Products
- 16.2.3.3. SWOT Analysis
- 16.2.3.4. Recent Developments
- 16.2.3.5. Financials (Based on Availability)
- 16.2.4 EtQ Management Consultants Inc
- 16.2.4.1. Overview
- 16.2.4.2. Products
- 16.2.4.3. SWOT Analysis
- 16.2.4.4. Recent Developments
- 16.2.4.5. Financials (Based on Availability)
- 16.2.5 Clarivate Plc
- 16.2.5.1. Overview
- 16.2.5.2. Products
- 16.2.5.3. SWOT Analysis
- 16.2.5.4. Recent Developments
- 16.2.5.5. Financials (Based on Availability)
- 16.2.6 AssurX Inc
- 16.2.6.1. Overview
- 16.2.6.2. Products
- 16.2.6.3. SWOT Analysis
- 16.2.6.4. Recent Developments
- 16.2.6.5. Financials (Based on Availability)
- 16.2.7 Veeva Systems Inc
- 16.2.7.1. Overview
- 16.2.7.2. Products
- 16.2.7.3. SWOT Analysis
- 16.2.7.4. Recent Developments
- 16.2.7.5. Financials (Based on Availability)
- 16.2.8 AXSource
- 16.2.8.1. Overview
- 16.2.8.2. Products
- 16.2.8.3. SWOT Analysis
- 16.2.8.4. Recent Developments
- 16.2.8.5. Financials (Based on Availability)
- 16.2.9 IQVIA
- 16.2.9.1. Overview
- 16.2.9.2. Products
- 16.2.9.3. SWOT Analysis
- 16.2.9.4. Recent Developments
- 16.2.9.5. Financials (Based on Availability)
- 16.2.10 Ideagen PLC
- 16.2.10.1. Overview
- 16.2.10.2. Products
- 16.2.10.3. SWOT Analysis
- 16.2.10.4. Recent Developments
- 16.2.10.5. Financials (Based on Availability)
- 16.2.11 ComplianceQuest
- 16.2.11.1. Overview
- 16.2.11.2. Products
- 16.2.11.3. SWOT Analysis
- 16.2.11.4. Recent Developments
- 16.2.11.5. Financials (Based on Availability)
- 16.2.12 Dassault Systemes
- 16.2.12.1. Overview
- 16.2.12.2. Products
- 16.2.12.3. SWOT Analysis
- 16.2.12.4. Recent Developments
- 16.2.12.5. Financials (Based on Availability)
- 16.2.1 Honeywell International Inc
List of Figures
- Figure 1: Global Pharma Quality Management Software Industry Revenue Breakdown (Million, %) by Region 2024 & 2032
- Figure 2: Global Pharma Quality Management Software Industry Volume Breakdown (K Unit, %) by Region 2024 & 2032
- Figure 3: North America Pharma Quality Management Software Industry Revenue (Million), by Country 2024 & 2032
- Figure 4: North America Pharma Quality Management Software Industry Volume (K Unit), by Country 2024 & 2032
- Figure 5: North America Pharma Quality Management Software Industry Revenue Share (%), by Country 2024 & 2032
- Figure 6: North America Pharma Quality Management Software Industry Volume Share (%), by Country 2024 & 2032
- Figure 7: Europe Pharma Quality Management Software Industry Revenue (Million), by Country 2024 & 2032
- Figure 8: Europe Pharma Quality Management Software Industry Volume (K Unit), by Country 2024 & 2032
- Figure 9: Europe Pharma Quality Management Software Industry Revenue Share (%), by Country 2024 & 2032
- Figure 10: Europe Pharma Quality Management Software Industry Volume Share (%), by Country 2024 & 2032
- Figure 11: Asia Pacific Pharma Quality Management Software Industry Revenue (Million), by Country 2024 & 2032
- Figure 12: Asia Pacific Pharma Quality Management Software Industry Volume (K Unit), by Country 2024 & 2032
- Figure 13: Asia Pacific Pharma Quality Management Software Industry Revenue Share (%), by Country 2024 & 2032
- Figure 14: Asia Pacific Pharma Quality Management Software Industry Volume Share (%), by Country 2024 & 2032
- Figure 15: Middle East and Africa Pharma Quality Management Software Industry Revenue (Million), by Country 2024 & 2032
- Figure 16: Middle East and Africa Pharma Quality Management Software Industry Volume (K Unit), by Country 2024 & 2032
- Figure 17: Middle East and Africa Pharma Quality Management Software Industry Revenue Share (%), by Country 2024 & 2032
- Figure 18: Middle East and Africa Pharma Quality Management Software Industry Volume Share (%), by Country 2024 & 2032
- Figure 19: South America Pharma Quality Management Software Industry Revenue (Million), by Country 2024 & 2032
- Figure 20: South America Pharma Quality Management Software Industry Volume (K Unit), by Country 2024 & 2032
- Figure 21: South America Pharma Quality Management Software Industry Revenue Share (%), by Country 2024 & 2032
- Figure 22: South America Pharma Quality Management Software Industry Volume Share (%), by Country 2024 & 2032
- Figure 23: North America Pharma Quality Management Software Industry Revenue (Million), by Solution Type 2024 & 2032
- Figure 24: North America Pharma Quality Management Software Industry Volume (K Unit), by Solution Type 2024 & 2032
- Figure 25: North America Pharma Quality Management Software Industry Revenue Share (%), by Solution Type 2024 & 2032
- Figure 26: North America Pharma Quality Management Software Industry Volume Share (%), by Solution Type 2024 & 2032
- Figure 27: North America Pharma Quality Management Software Industry Revenue (Million), by Deployment 2024 & 2032
- Figure 28: North America Pharma Quality Management Software Industry Volume (K Unit), by Deployment 2024 & 2032
- Figure 29: North America Pharma Quality Management Software Industry Revenue Share (%), by Deployment 2024 & 2032
- Figure 30: North America Pharma Quality Management Software Industry Volume Share (%), by Deployment 2024 & 2032
- Figure 31: North America Pharma Quality Management Software Industry Revenue (Million), by Enterprize Size 2024 & 2032
- Figure 32: North America Pharma Quality Management Software Industry Volume (K Unit), by Enterprize Size 2024 & 2032
- Figure 33: North America Pharma Quality Management Software Industry Revenue Share (%), by Enterprize Size 2024 & 2032
- Figure 34: North America Pharma Quality Management Software Industry Volume Share (%), by Enterprize Size 2024 & 2032
- Figure 35: North America Pharma Quality Management Software Industry Revenue (Million), by Country 2024 & 2032
- Figure 36: North America Pharma Quality Management Software Industry Volume (K Unit), by Country 2024 & 2032
- Figure 37: North America Pharma Quality Management Software Industry Revenue Share (%), by Country 2024 & 2032
- Figure 38: North America Pharma Quality Management Software Industry Volume Share (%), by Country 2024 & 2032
- Figure 39: Europe Pharma Quality Management Software Industry Revenue (Million), by Solution Type 2024 & 2032
- Figure 40: Europe Pharma Quality Management Software Industry Volume (K Unit), by Solution Type 2024 & 2032
- Figure 41: Europe Pharma Quality Management Software Industry Revenue Share (%), by Solution Type 2024 & 2032
- Figure 42: Europe Pharma Quality Management Software Industry Volume Share (%), by Solution Type 2024 & 2032
- Figure 43: Europe Pharma Quality Management Software Industry Revenue (Million), by Deployment 2024 & 2032
- Figure 44: Europe Pharma Quality Management Software Industry Volume (K Unit), by Deployment 2024 & 2032
- Figure 45: Europe Pharma Quality Management Software Industry Revenue Share (%), by Deployment 2024 & 2032
- Figure 46: Europe Pharma Quality Management Software Industry Volume Share (%), by Deployment 2024 & 2032
- Figure 47: Europe Pharma Quality Management Software Industry Revenue (Million), by Enterprize Size 2024 & 2032
- Figure 48: Europe Pharma Quality Management Software Industry Volume (K Unit), by Enterprize Size 2024 & 2032
- Figure 49: Europe Pharma Quality Management Software Industry Revenue Share (%), by Enterprize Size 2024 & 2032
- Figure 50: Europe Pharma Quality Management Software Industry Volume Share (%), by Enterprize Size 2024 & 2032
- Figure 51: Europe Pharma Quality Management Software Industry Revenue (Million), by Country 2024 & 2032
- Figure 52: Europe Pharma Quality Management Software Industry Volume (K Unit), by Country 2024 & 2032
- Figure 53: Europe Pharma Quality Management Software Industry Revenue Share (%), by Country 2024 & 2032
- Figure 54: Europe Pharma Quality Management Software Industry Volume Share (%), by Country 2024 & 2032
- Figure 55: Asia Pacific Pharma Quality Management Software Industry Revenue (Million), by Solution Type 2024 & 2032
- Figure 56: Asia Pacific Pharma Quality Management Software Industry Volume (K Unit), by Solution Type 2024 & 2032
- Figure 57: Asia Pacific Pharma Quality Management Software Industry Revenue Share (%), by Solution Type 2024 & 2032
- Figure 58: Asia Pacific Pharma Quality Management Software Industry Volume Share (%), by Solution Type 2024 & 2032
- Figure 59: Asia Pacific Pharma Quality Management Software Industry Revenue (Million), by Deployment 2024 & 2032
- Figure 60: Asia Pacific Pharma Quality Management Software Industry Volume (K Unit), by Deployment 2024 & 2032
- Figure 61: Asia Pacific Pharma Quality Management Software Industry Revenue Share (%), by Deployment 2024 & 2032
- Figure 62: Asia Pacific Pharma Quality Management Software Industry Volume Share (%), by Deployment 2024 & 2032
- Figure 63: Asia Pacific Pharma Quality Management Software Industry Revenue (Million), by Enterprize Size 2024 & 2032
- Figure 64: Asia Pacific Pharma Quality Management Software Industry Volume (K Unit), by Enterprize Size 2024 & 2032
- Figure 65: Asia Pacific Pharma Quality Management Software Industry Revenue Share (%), by Enterprize Size 2024 & 2032
- Figure 66: Asia Pacific Pharma Quality Management Software Industry Volume Share (%), by Enterprize Size 2024 & 2032
- Figure 67: Asia Pacific Pharma Quality Management Software Industry Revenue (Million), by Country 2024 & 2032
- Figure 68: Asia Pacific Pharma Quality Management Software Industry Volume (K Unit), by Country 2024 & 2032
- Figure 69: Asia Pacific Pharma Quality Management Software Industry Revenue Share (%), by Country 2024 & 2032
- Figure 70: Asia Pacific Pharma Quality Management Software Industry Volume Share (%), by Country 2024 & 2032
- Figure 71: Middle East and Africa Pharma Quality Management Software Industry Revenue (Million), by Solution Type 2024 & 2032
- Figure 72: Middle East and Africa Pharma Quality Management Software Industry Volume (K Unit), by Solution Type 2024 & 2032
- Figure 73: Middle East and Africa Pharma Quality Management Software Industry Revenue Share (%), by Solution Type 2024 & 2032
- Figure 74: Middle East and Africa Pharma Quality Management Software Industry Volume Share (%), by Solution Type 2024 & 2032
- Figure 75: Middle East and Africa Pharma Quality Management Software Industry Revenue (Million), by Deployment 2024 & 2032
- Figure 76: Middle East and Africa Pharma Quality Management Software Industry Volume (K Unit), by Deployment 2024 & 2032
- Figure 77: Middle East and Africa Pharma Quality Management Software Industry Revenue Share (%), by Deployment 2024 & 2032
- Figure 78: Middle East and Africa Pharma Quality Management Software Industry Volume Share (%), by Deployment 2024 & 2032
- Figure 79: Middle East and Africa Pharma Quality Management Software Industry Revenue (Million), by Enterprize Size 2024 & 2032
- Figure 80: Middle East and Africa Pharma Quality Management Software Industry Volume (K Unit), by Enterprize Size 2024 & 2032
- Figure 81: Middle East and Africa Pharma Quality Management Software Industry Revenue Share (%), by Enterprize Size 2024 & 2032
- Figure 82: Middle East and Africa Pharma Quality Management Software Industry Volume Share (%), by Enterprize Size 2024 & 2032
- Figure 83: Middle East and Africa Pharma Quality Management Software Industry Revenue (Million), by Country 2024 & 2032
- Figure 84: Middle East and Africa Pharma Quality Management Software Industry Volume (K Unit), by Country 2024 & 2032
- Figure 85: Middle East and Africa Pharma Quality Management Software Industry Revenue Share (%), by Country 2024 & 2032
- Figure 86: Middle East and Africa Pharma Quality Management Software Industry Volume Share (%), by Country 2024 & 2032
- Figure 87: South America Pharma Quality Management Software Industry Revenue (Million), by Solution Type 2024 & 2032
- Figure 88: South America Pharma Quality Management Software Industry Volume (K Unit), by Solution Type 2024 & 2032
- Figure 89: South America Pharma Quality Management Software Industry Revenue Share (%), by Solution Type 2024 & 2032
- Figure 90: South America Pharma Quality Management Software Industry Volume Share (%), by Solution Type 2024 & 2032
- Figure 91: South America Pharma Quality Management Software Industry Revenue (Million), by Deployment 2024 & 2032
- Figure 92: South America Pharma Quality Management Software Industry Volume (K Unit), by Deployment 2024 & 2032
- Figure 93: South America Pharma Quality Management Software Industry Revenue Share (%), by Deployment 2024 & 2032
- Figure 94: South America Pharma Quality Management Software Industry Volume Share (%), by Deployment 2024 & 2032
- Figure 95: South America Pharma Quality Management Software Industry Revenue (Million), by Enterprize Size 2024 & 2032
- Figure 96: South America Pharma Quality Management Software Industry Volume (K Unit), by Enterprize Size 2024 & 2032
- Figure 97: South America Pharma Quality Management Software Industry Revenue Share (%), by Enterprize Size 2024 & 2032
- Figure 98: South America Pharma Quality Management Software Industry Volume Share (%), by Enterprize Size 2024 & 2032
- Figure 99: South America Pharma Quality Management Software Industry Revenue (Million), by Country 2024 & 2032
- Figure 100: South America Pharma Quality Management Software Industry Volume (K Unit), by Country 2024 & 2032
- Figure 101: South America Pharma Quality Management Software Industry Revenue Share (%), by Country 2024 & 2032
- Figure 102: South America Pharma Quality Management Software Industry Volume Share (%), by Country 2024 & 2032
List of Tables
- Table 1: Global Pharma Quality Management Software Industry Revenue Million Forecast, by Region 2019 & 2032
- Table 2: Global Pharma Quality Management Software Industry Volume K Unit Forecast, by Region 2019 & 2032
- Table 3: Global Pharma Quality Management Software Industry Revenue Million Forecast, by Solution Type 2019 & 2032
- Table 4: Global Pharma Quality Management Software Industry Volume K Unit Forecast, by Solution Type 2019 & 2032
- Table 5: Global Pharma Quality Management Software Industry Revenue Million Forecast, by Deployment 2019 & 2032
- Table 6: Global Pharma Quality Management Software Industry Volume K Unit Forecast, by Deployment 2019 & 2032
- Table 7: Global Pharma Quality Management Software Industry Revenue Million Forecast, by Enterprize Size 2019 & 2032
- Table 8: Global Pharma Quality Management Software Industry Volume K Unit Forecast, by Enterprize Size 2019 & 2032
- Table 9: Global Pharma Quality Management Software Industry Revenue Million Forecast, by Region 2019 & 2032
- Table 10: Global Pharma Quality Management Software Industry Volume K Unit Forecast, by Region 2019 & 2032
- Table 11: Global Pharma Quality Management Software Industry Revenue Million Forecast, by Country 2019 & 2032
- Table 12: Global Pharma Quality Management Software Industry Volume K Unit Forecast, by Country 2019 & 2032
- Table 13: United States Pharma Quality Management Software Industry Revenue (Million) Forecast, by Application 2019 & 2032
- Table 14: United States Pharma Quality Management Software Industry Volume (K Unit) Forecast, by Application 2019 & 2032
- Table 15: Canada Pharma Quality Management Software Industry Revenue (Million) Forecast, by Application 2019 & 2032
- Table 16: Canada Pharma Quality Management Software Industry Volume (K Unit) Forecast, by Application 2019 & 2032
- Table 17: Mexico Pharma Quality Management Software Industry Revenue (Million) Forecast, by Application 2019 & 2032
- Table 18: Mexico Pharma Quality Management Software Industry Volume (K Unit) Forecast, by Application 2019 & 2032
- Table 19: Global Pharma Quality Management Software Industry Revenue Million Forecast, by Country 2019 & 2032
- Table 20: Global Pharma Quality Management Software Industry Volume K Unit Forecast, by Country 2019 & 2032
- Table 21: Germany Pharma Quality Management Software Industry Revenue (Million) Forecast, by Application 2019 & 2032
- Table 22: Germany Pharma Quality Management Software Industry Volume (K Unit) Forecast, by Application 2019 & 2032
- Table 23: United Kingdom Pharma Quality Management Software Industry Revenue (Million) Forecast, by Application 2019 & 2032
- Table 24: United Kingdom Pharma Quality Management Software Industry Volume (K Unit) Forecast, by Application 2019 & 2032
- Table 25: France Pharma Quality Management Software Industry Revenue (Million) Forecast, by Application 2019 & 2032
- Table 26: France Pharma Quality Management Software Industry Volume (K Unit) Forecast, by Application 2019 & 2032
- Table 27: Italy Pharma Quality Management Software Industry Revenue (Million) Forecast, by Application 2019 & 2032
- Table 28: Italy Pharma Quality Management Software Industry Volume (K Unit) Forecast, by Application 2019 & 2032
- Table 29: Spain Pharma Quality Management Software Industry Revenue (Million) Forecast, by Application 2019 & 2032
- Table 30: Spain Pharma Quality Management Software Industry Volume (K Unit) Forecast, by Application 2019 & 2032
- Table 31: Rest of Europe Pharma Quality Management Software Industry Revenue (Million) Forecast, by Application 2019 & 2032
- Table 32: Rest of Europe Pharma Quality Management Software Industry Volume (K Unit) Forecast, by Application 2019 & 2032
- Table 33: Global Pharma Quality Management Software Industry Revenue Million Forecast, by Country 2019 & 2032
- Table 34: Global Pharma Quality Management Software Industry Volume K Unit Forecast, by Country 2019 & 2032
- Table 35: China Pharma Quality Management Software Industry Revenue (Million) Forecast, by Application 2019 & 2032
- Table 36: China Pharma Quality Management Software Industry Volume (K Unit) Forecast, by Application 2019 & 2032
- Table 37: Japan Pharma Quality Management Software Industry Revenue (Million) Forecast, by Application 2019 & 2032
- Table 38: Japan Pharma Quality Management Software Industry Volume (K Unit) Forecast, by Application 2019 & 2032
- Table 39: India Pharma Quality Management Software Industry Revenue (Million) Forecast, by Application 2019 & 2032
- Table 40: India Pharma Quality Management Software Industry Volume (K Unit) Forecast, by Application 2019 & 2032
- Table 41: Australia Pharma Quality Management Software Industry Revenue (Million) Forecast, by Application 2019 & 2032
- Table 42: Australia Pharma Quality Management Software Industry Volume (K Unit) Forecast, by Application 2019 & 2032
- Table 43: South Korea Pharma Quality Management Software Industry Revenue (Million) Forecast, by Application 2019 & 2032
- Table 44: South Korea Pharma Quality Management Software Industry Volume (K Unit) Forecast, by Application 2019 & 2032
- Table 45: Rest of Asia Pacific Pharma Quality Management Software Industry Revenue (Million) Forecast, by Application 2019 & 2032
- Table 46: Rest of Asia Pacific Pharma Quality Management Software Industry Volume (K Unit) Forecast, by Application 2019 & 2032
- Table 47: Global Pharma Quality Management Software Industry Revenue Million Forecast, by Country 2019 & 2032
- Table 48: Global Pharma Quality Management Software Industry Volume K Unit Forecast, by Country 2019 & 2032
- Table 49: GCC Pharma Quality Management Software Industry Revenue (Million) Forecast, by Application 2019 & 2032
- Table 50: GCC Pharma Quality Management Software Industry Volume (K Unit) Forecast, by Application 2019 & 2032
- Table 51: South Africa Pharma Quality Management Software Industry Revenue (Million) Forecast, by Application 2019 & 2032
- Table 52: South Africa Pharma Quality Management Software Industry Volume (K Unit) Forecast, by Application 2019 & 2032
- Table 53: Rest of Middle East and Africa Pharma Quality Management Software Industry Revenue (Million) Forecast, by Application 2019 & 2032
- Table 54: Rest of Middle East and Africa Pharma Quality Management Software Industry Volume (K Unit) Forecast, by Application 2019 & 2032
- Table 55: Global Pharma Quality Management Software Industry Revenue Million Forecast, by Country 2019 & 2032
- Table 56: Global Pharma Quality Management Software Industry Volume K Unit Forecast, by Country 2019 & 2032
- Table 57: Brazil Pharma Quality Management Software Industry Revenue (Million) Forecast, by Application 2019 & 2032
- Table 58: Brazil Pharma Quality Management Software Industry Volume (K Unit) Forecast, by Application 2019 & 2032
- Table 59: Argentina Pharma Quality Management Software Industry Revenue (Million) Forecast, by Application 2019 & 2032
- Table 60: Argentina Pharma Quality Management Software Industry Volume (K Unit) Forecast, by Application 2019 & 2032
- Table 61: Rest of South America Pharma Quality Management Software Industry Revenue (Million) Forecast, by Application 2019 & 2032
- Table 62: Rest of South America Pharma Quality Management Software Industry Volume (K Unit) Forecast, by Application 2019 & 2032
- Table 63: Global Pharma Quality Management Software Industry Revenue Million Forecast, by Solution Type 2019 & 2032
- Table 64: Global Pharma Quality Management Software Industry Volume K Unit Forecast, by Solution Type 2019 & 2032
- Table 65: Global Pharma Quality Management Software Industry Revenue Million Forecast, by Deployment 2019 & 2032
- Table 66: Global Pharma Quality Management Software Industry Volume K Unit Forecast, by Deployment 2019 & 2032
- Table 67: Global Pharma Quality Management Software Industry Revenue Million Forecast, by Enterprize Size 2019 & 2032
- Table 68: Global Pharma Quality Management Software Industry Volume K Unit Forecast, by Enterprize Size 2019 & 2032
- Table 69: Global Pharma Quality Management Software Industry Revenue Million Forecast, by Country 2019 & 2032
- Table 70: Global Pharma Quality Management Software Industry Volume K Unit Forecast, by Country 2019 & 2032
- Table 71: United States Pharma Quality Management Software Industry Revenue (Million) Forecast, by Application 2019 & 2032
- Table 72: United States Pharma Quality Management Software Industry Volume (K Unit) Forecast, by Application 2019 & 2032
- Table 73: Canada Pharma Quality Management Software Industry Revenue (Million) Forecast, by Application 2019 & 2032
- Table 74: Canada Pharma Quality Management Software Industry Volume (K Unit) Forecast, by Application 2019 & 2032
- Table 75: Mexico Pharma Quality Management Software Industry Revenue (Million) Forecast, by Application 2019 & 2032
- Table 76: Mexico Pharma Quality Management Software Industry Volume (K Unit) Forecast, by Application 2019 & 2032
- Table 77: Global Pharma Quality Management Software Industry Revenue Million Forecast, by Solution Type 2019 & 2032
- Table 78: Global Pharma Quality Management Software Industry Volume K Unit Forecast, by Solution Type 2019 & 2032
- Table 79: Global Pharma Quality Management Software Industry Revenue Million Forecast, by Deployment 2019 & 2032
- Table 80: Global Pharma Quality Management Software Industry Volume K Unit Forecast, by Deployment 2019 & 2032
- Table 81: Global Pharma Quality Management Software Industry Revenue Million Forecast, by Enterprize Size 2019 & 2032
- Table 82: Global Pharma Quality Management Software Industry Volume K Unit Forecast, by Enterprize Size 2019 & 2032
- Table 83: Global Pharma Quality Management Software Industry Revenue Million Forecast, by Country 2019 & 2032
- Table 84: Global Pharma Quality Management Software Industry Volume K Unit Forecast, by Country 2019 & 2032
- Table 85: Germany Pharma Quality Management Software Industry Revenue (Million) Forecast, by Application 2019 & 2032
- Table 86: Germany Pharma Quality Management Software Industry Volume (K Unit) Forecast, by Application 2019 & 2032
- Table 87: United Kingdom Pharma Quality Management Software Industry Revenue (Million) Forecast, by Application 2019 & 2032
- Table 88: United Kingdom Pharma Quality Management Software Industry Volume (K Unit) Forecast, by Application 2019 & 2032
- Table 89: France Pharma Quality Management Software Industry Revenue (Million) Forecast, by Application 2019 & 2032
- Table 90: France Pharma Quality Management Software Industry Volume (K Unit) Forecast, by Application 2019 & 2032
- Table 91: Italy Pharma Quality Management Software Industry Revenue (Million) Forecast, by Application 2019 & 2032
- Table 92: Italy Pharma Quality Management Software Industry Volume (K Unit) Forecast, by Application 2019 & 2032
- Table 93: Spain Pharma Quality Management Software Industry Revenue (Million) Forecast, by Application 2019 & 2032
- Table 94: Spain Pharma Quality Management Software Industry Volume (K Unit) Forecast, by Application 2019 & 2032
- Table 95: Rest of Europe Pharma Quality Management Software Industry Revenue (Million) Forecast, by Application 2019 & 2032
- Table 96: Rest of Europe Pharma Quality Management Software Industry Volume (K Unit) Forecast, by Application 2019 & 2032
- Table 97: Global Pharma Quality Management Software Industry Revenue Million Forecast, by Solution Type 2019 & 2032
- Table 98: Global Pharma Quality Management Software Industry Volume K Unit Forecast, by Solution Type 2019 & 2032
- Table 99: Global Pharma Quality Management Software Industry Revenue Million Forecast, by Deployment 2019 & 2032
- Table 100: Global Pharma Quality Management Software Industry Volume K Unit Forecast, by Deployment 2019 & 2032
- Table 101: Global Pharma Quality Management Software Industry Revenue Million Forecast, by Enterprize Size 2019 & 2032
- Table 102: Global Pharma Quality Management Software Industry Volume K Unit Forecast, by Enterprize Size 2019 & 2032
- Table 103: Global Pharma Quality Management Software Industry Revenue Million Forecast, by Country 2019 & 2032
- Table 104: Global Pharma Quality Management Software Industry Volume K Unit Forecast, by Country 2019 & 2032
- Table 105: China Pharma Quality Management Software Industry Revenue (Million) Forecast, by Application 2019 & 2032
- Table 106: China Pharma Quality Management Software Industry Volume (K Unit) Forecast, by Application 2019 & 2032
- Table 107: Japan Pharma Quality Management Software Industry Revenue (Million) Forecast, by Application 2019 & 2032
- Table 108: Japan Pharma Quality Management Software Industry Volume (K Unit) Forecast, by Application 2019 & 2032
- Table 109: India Pharma Quality Management Software Industry Revenue (Million) Forecast, by Application 2019 & 2032
- Table 110: India Pharma Quality Management Software Industry Volume (K Unit) Forecast, by Application 2019 & 2032
- Table 111: Australia Pharma Quality Management Software Industry Revenue (Million) Forecast, by Application 2019 & 2032
- Table 112: Australia Pharma Quality Management Software Industry Volume (K Unit) Forecast, by Application 2019 & 2032
- Table 113: South Korea Pharma Quality Management Software Industry Revenue (Million) Forecast, by Application 2019 & 2032
- Table 114: South Korea Pharma Quality Management Software Industry Volume (K Unit) Forecast, by Application 2019 & 2032
- Table 115: Rest of Asia Pacific Pharma Quality Management Software Industry Revenue (Million) Forecast, by Application 2019 & 2032
- Table 116: Rest of Asia Pacific Pharma Quality Management Software Industry Volume (K Unit) Forecast, by Application 2019 & 2032
- Table 117: Global Pharma Quality Management Software Industry Revenue Million Forecast, by Solution Type 2019 & 2032
- Table 118: Global Pharma Quality Management Software Industry Volume K Unit Forecast, by Solution Type 2019 & 2032
- Table 119: Global Pharma Quality Management Software Industry Revenue Million Forecast, by Deployment 2019 & 2032
- Table 120: Global Pharma Quality Management Software Industry Volume K Unit Forecast, by Deployment 2019 & 2032
- Table 121: Global Pharma Quality Management Software Industry Revenue Million Forecast, by Enterprize Size 2019 & 2032
- Table 122: Global Pharma Quality Management Software Industry Volume K Unit Forecast, by Enterprize Size 2019 & 2032
- Table 123: Global Pharma Quality Management Software Industry Revenue Million Forecast, by Country 2019 & 2032
- Table 124: Global Pharma Quality Management Software Industry Volume K Unit Forecast, by Country 2019 & 2032
- Table 125: GCC Pharma Quality Management Software Industry Revenue (Million) Forecast, by Application 2019 & 2032
- Table 126: GCC Pharma Quality Management Software Industry Volume (K Unit) Forecast, by Application 2019 & 2032
- Table 127: South Africa Pharma Quality Management Software Industry Revenue (Million) Forecast, by Application 2019 & 2032
- Table 128: South Africa Pharma Quality Management Software Industry Volume (K Unit) Forecast, by Application 2019 & 2032
- Table 129: Rest of Middle East and Africa Pharma Quality Management Software Industry Revenue (Million) Forecast, by Application 2019 & 2032
- Table 130: Rest of Middle East and Africa Pharma Quality Management Software Industry Volume (K Unit) Forecast, by Application 2019 & 2032
- Table 131: Global Pharma Quality Management Software Industry Revenue Million Forecast, by Solution Type 2019 & 2032
- Table 132: Global Pharma Quality Management Software Industry Volume K Unit Forecast, by Solution Type 2019 & 2032
- Table 133: Global Pharma Quality Management Software Industry Revenue Million Forecast, by Deployment 2019 & 2032
- Table 134: Global Pharma Quality Management Software Industry Volume K Unit Forecast, by Deployment 2019 & 2032
- Table 135: Global Pharma Quality Management Software Industry Revenue Million Forecast, by Enterprize Size 2019 & 2032
- Table 136: Global Pharma Quality Management Software Industry Volume K Unit Forecast, by Enterprize Size 2019 & 2032
- Table 137: Global Pharma Quality Management Software Industry Revenue Million Forecast, by Country 2019 & 2032
- Table 138: Global Pharma Quality Management Software Industry Volume K Unit Forecast, by Country 2019 & 2032
- Table 139: Brazil Pharma Quality Management Software Industry Revenue (Million) Forecast, by Application 2019 & 2032
- Table 140: Brazil Pharma Quality Management Software Industry Volume (K Unit) Forecast, by Application 2019 & 2032
- Table 141: Argentina Pharma Quality Management Software Industry Revenue (Million) Forecast, by Application 2019 & 2032
- Table 142: Argentina Pharma Quality Management Software Industry Volume (K Unit) Forecast, by Application 2019 & 2032
- Table 143: Rest of South America Pharma Quality Management Software Industry Revenue (Million) Forecast, by Application 2019 & 2032
- Table 144: Rest of South America Pharma Quality Management Software Industry Volume (K Unit) Forecast, by Application 2019 & 2032
Frequently Asked Questions
1. What is the projected Compound Annual Growth Rate (CAGR) of the Pharma Quality Management Software Industry?
The projected CAGR is approximately 9.90%.
2. Which companies are prominent players in the Pharma Quality Management Software Industry?
Key companies in the market include Honeywell International Inc, Antares Vision, Qualio, EtQ Management Consultants Inc, Clarivate Plc, AssurX Inc, Veeva Systems Inc, AXSource, IQVIA, Ideagen PLC, ComplianceQuest, Dassault Systemes.
3. What are the main segments of the Pharma Quality Management Software Industry?
The market segments include Solution Type, Deployment, Enterprize Size.
4. Can you provide details about the market size?
The market size is estimated to be USD XX Million as of 2022.
5. What are some drivers contributing to market growth?
Increasing Cost of Drugs Manufacturing; Growing Technology Adoption in Pharmaceutical Industry.
6. What are the notable trends driving market growth?
Regulatory and Compliance Management Segment is Expected to Hold Significant Market Share Over the Forecast Period.
7. Are there any restraints impacting market growth?
Security Concerns Pertaining to On-Cloud Deployment; Lack of Regulations for Pharmaceutical Quality Management Software.
8. Can you provide examples of recent developments in the market?
January 2023: Palantir Technologies Inc. launched a fit-for-purpose Quality Management System to help its life sciences customers using the Foundry platform meet GxP requirements.
9. What pricing options are available for accessing the report?
Pricing options include single-user, multi-user, and enterprise licenses priced at USD 4750, USD 5250, and USD 8750 respectively.
10. Is the market size provided in terms of value or volume?
The market size is provided in terms of value, measured in Million and volume, measured in K Unit.
11. Are there any specific market keywords associated with the report?
Yes, the market keyword associated with the report is "Pharma Quality Management Software Industry," which aids in identifying and referencing the specific market segment covered.
12. How do I determine which pricing option suits my needs best?
The pricing options vary based on user requirements and access needs. Individual users may opt for single-user licenses, while businesses requiring broader access may choose multi-user or enterprise licenses for cost-effective access to the report.
13. Are there any additional resources or data provided in the Pharma Quality Management Software Industry report?
While the report offers comprehensive insights, it's advisable to review the specific contents or supplementary materials provided to ascertain if additional resources or data are available.
14. How can I stay updated on further developments or reports in the Pharma Quality Management Software Industry?
To stay informed about further developments, trends, and reports in the Pharma Quality Management Software Industry, consider subscribing to industry newsletters, following relevant companies and organizations, or regularly checking reputable industry news sources and publications.
Methodology
Step 1 - Identification of Relevant Samples Size from Population Database


Step 2 - Approaches for Defining Global Market Size (Value, Volume* & Price*)

Note*: In applicable scenarios
Step 3 - Data Sources
Primary Research
- Web Analytics
- Survey Reports
- Research Institute
- Latest Research Reports
- Opinion Leaders
Secondary Research
- Annual Reports
- White Paper
- Latest Press Release
- Industry Association
- Paid Database
- Investor Presentations

Step 4 - Data Triangulation
Involves using different sources of information in order to increase the validity of a study
These sources are likely to be stakeholders in a program - participants, other researchers, program staff, other community members, and so on.
Then we put all data in single framework & apply various statistical tools to find out the dynamic on the market.
During the analysis stage, feedback from the stakeholder groups would be compared to determine areas of agreement as well as areas of divergence


