
Key Insights
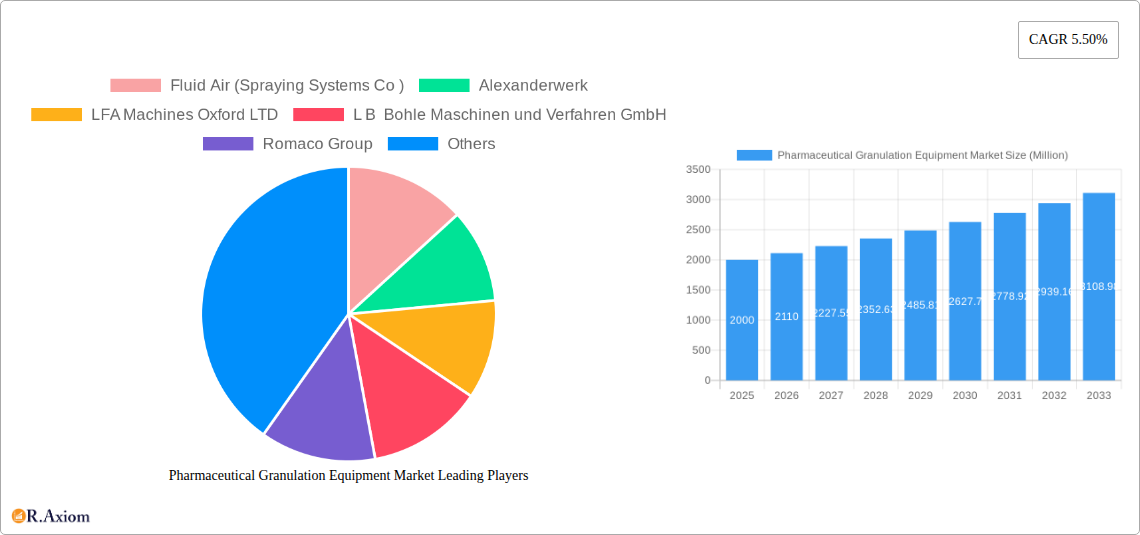
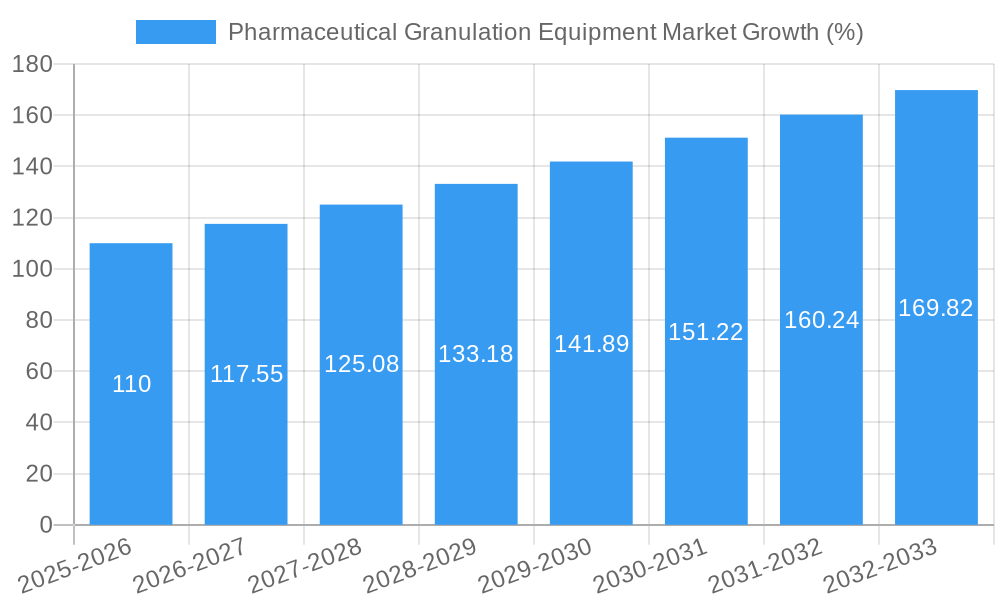
The pharmaceutical granulation equipment market, valued at approximately $XX million in 2025, is projected to experience robust growth, exhibiting a compound annual growth rate (CAGR) of 5.50% from 2025 to 2033. This expansion is driven by several key factors. The increasing demand for oral solid dosage forms, coupled with the rising prevalence of chronic diseases globally, fuels the need for efficient and high-quality granulation equipment. Advancements in technology, such as the development of high-shear granulators offering improved processing efficiency and reduced production time, are further stimulating market growth. Furthermore, the growing adoption of contract manufacturing organizations (CMOs) by pharmaceutical companies is contributing to the market's expansion, as CMOs often require advanced granulation equipment to meet stringent quality standards. While regulatory hurdles and the high initial investment costs associated with sophisticated equipment might pose some restraints, the overall market outlook remains positive, supported by continuous innovation and increasing investments in pharmaceutical manufacturing capacity.
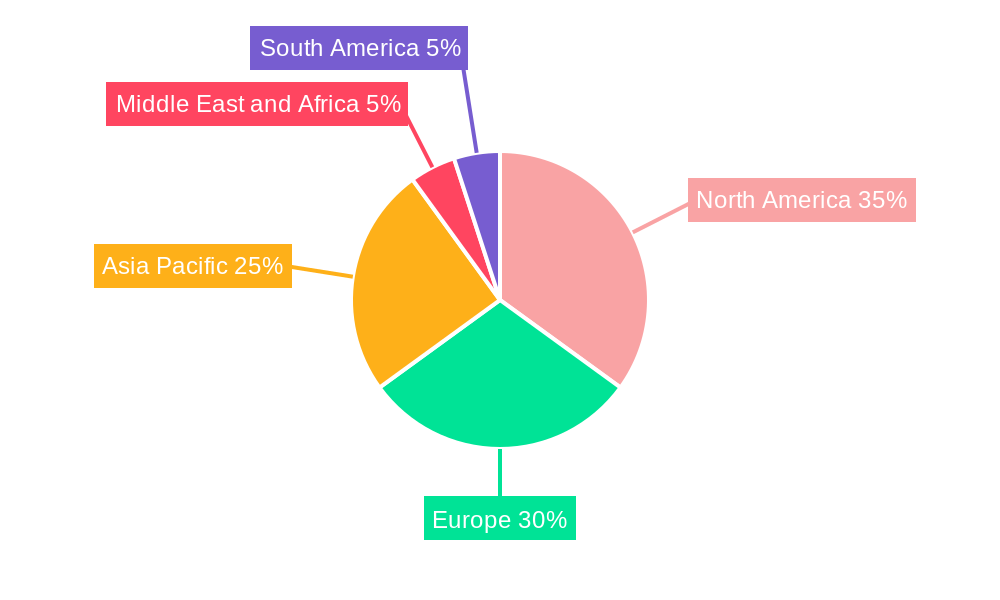
The market segmentation reveals a diverse landscape. Single pot granulators remain a significant segment due to their simplicity and cost-effectiveness, but high-shear granulators are gaining traction due to their superior performance in processing diverse materials. Wet granulation processes are more prevalent than dry granulation, owing to their ability to improve the flowability and compressibility of powders. Pharmaceutical manufacturing companies constitute the largest end-user segment, followed by contract manufacturers. Geographically, North America and Europe currently hold substantial market shares, but the Asia-Pacific region is expected to witness significant growth in the coming years, driven by increasing pharmaceutical production in countries like India and China. Key players like Fluid Air, Alexanderwerk, and Romaco Group are leveraging their technological expertise and established market presence to capitalize on the burgeoning opportunities. The market is characterized by competitive intensity, with companies focusing on innovation, strategic partnerships, and geographical expansion to gain a competitive edge.
This comprehensive report provides a detailed analysis of the Pharmaceutical Granulation Equipment market, offering valuable insights for industry stakeholders, investors, and researchers. The study covers the period from 2019 to 2033, with 2025 as the base year and a forecast period extending to 2033. The market is segmented by type (Single Pot Granulators, High Sheer Granulators, Oscillating Granulators, Others), mechanism (Dry Granulators, Wet Granulators, Mixture Granulators), and end-user (Pharmaceutical Manufacturing Companies, Contract Manufacturing, Others). The report analyzes market size, growth drivers, challenges, opportunities, and key players, providing a 360-degree view of this dynamic sector. The report’s projected market value in 2025 is xx Million, with a CAGR of xx% during the forecast period.
Pharmaceutical Granulation Equipment Market Concentration & Innovation
The Pharmaceutical Granulation Equipment market exhibits a moderately concentrated structure, with a few major players holding significant market share. The top five companies collectively account for approximately xx% of the market, while numerous smaller players compete for the remaining share. This concentration is driven by significant capital investment requirements, stringent regulatory approvals, and the need for specialized expertise. Innovation is a key differentiator, with companies constantly investing in R&D to improve equipment efficiency, scalability, and automation. Recent innovations include the integration of advanced process analytical technology (PAT) for real-time process monitoring and control, as well as the development of more efficient and sustainable granulation technologies.
The regulatory landscape plays a crucial role in shaping market dynamics. Stringent regulatory compliance requirements for pharmaceutical manufacturing drive the adoption of advanced equipment that meets GMP (Good Manufacturing Practices) standards. Product substitution, while present, is limited due to the specialized nature of granulation equipment. End-user trends are focused on improved efficiency, reduced operational costs, and enhanced product quality.
Mergers and acquisitions (M&A) activity has been moderate in recent years. Notable deals include the acquisition of Tapasya by Prochem (March 2023), which demonstrates the consolidation trend within the industry. The overall value of M&A deals in the Pharmaceutical Granulation Equipment market is estimated at xx Million in the past 5 years.
Pharmaceutical Granulation Equipment Market Industry Trends & Insights
The Pharmaceutical Granulation Equipment market is witnessing robust growth, driven by several factors. The increasing demand for oral solid dosage forms fuels the market's expansion. The rising prevalence of chronic diseases and the growing geriatric population contribute significantly to the demand for pharmaceuticals, and consequently, the need for efficient granulation equipment. Technological advancements such as improved automation, advanced process control systems, and the integration of PAT are enhancing the efficiency and productivity of granulation processes.
Consumer preferences for improved drug efficacy and safety are pushing the adoption of advanced granulation technologies that ensure consistent product quality. The competitive landscape is intense, with both established players and new entrants vying for market share. This competition fosters innovation and drives the development of more sophisticated and cost-effective equipment. The market is experiencing a shift towards sustainable and environmentally friendly granulation processes, driven by environmental regulations and growing corporate social responsibility initiatives. The overall market growth is projected to reach xx Million by 2033, indicating a strong upward trajectory.
Dominant Markets & Segments in Pharmaceutical Granulation Equipment Market
Leading Region: North America currently dominates the Pharmaceutical Granulation Equipment market, driven by strong pharmaceutical manufacturing capabilities and stringent regulatory frameworks. Europe is another significant market.
Dominant Segment by Type: High-shear granulators constitute the largest segment, driven by their ability to produce high-quality granules with consistent particle size distribution.
Dominant Segment by Mechanism: Wet granulators hold the largest market share due to their versatility and suitability for a wide range of materials.
Dominant Segment by End-user: Pharmaceutical manufacturing companies are the primary end-users, owing to their significant production volume requirements.
Key Drivers for Regional Dominance:
- North America: Robust pharmaceutical industry, high R&D spending, and advanced manufacturing technologies.
- Europe: Well-established pharmaceutical sector, stringent regulatory compliance, and focus on innovation.
Pharmaceutical Granulation Equipment Market Product Developments
Recent product innovations have focused on enhancing equipment efficiency, improving process control, and reducing operational costs. Advanced features include automated cleaning systems, real-time process monitoring using PAT, and improved material handling capabilities. These innovations provide enhanced product quality and improved overall efficiency, aligning with the demands of modern pharmaceutical manufacturing. The market is also witnessing a growing trend towards modular and flexible equipment designs that can be easily adapted to changing production needs. This trend enhances the overall flexibility of the pharmaceutical production process.
Report Scope & Segmentation Analysis
Type: The market is segmented into Single Pot Granulators, High Sheer Granulators, Oscillating Granulators, and Others. High-shear granulators are expected to witness the fastest growth due to their superior performance.
Mechanism: The market is categorized into Dry Granulators, Wet Granulators, and Mixture Granulators. Wet granulators are currently the dominant segment.
End-User: The market is segmented by Pharmaceutical Manufacturing Companies, Contract Manufacturing organizations, and Others. Pharmaceutical manufacturing companies dominate the market due to their large-scale operations. Each segment shows varied growth projections based on specific market drivers and dynamics.
Key Drivers of Pharmaceutical Granulation Equipment Market Growth
Several factors propel the Pharmaceutical Granulation Equipment market's expansion. The increasing demand for oral solid dosage forms, driven by the growing prevalence of chronic diseases, is a primary driver. Technological advancements, such as improved automation and process control, enhance efficiency and productivity. Stringent regulatory requirements for pharmaceutical manufacturing necessitate compliance-adherent equipment. Furthermore, the rising focus on cost optimization and reduced environmental impact within the pharmaceutical industry also fuels demand for advanced granulation equipment.
Challenges in the Pharmaceutical Granulation Equipment Market Sector
The market faces challenges such as stringent regulatory compliance requirements, leading to high initial investment and ongoing operational costs. Supply chain disruptions can impact equipment availability and increase costs. Intense competition from established players and new entrants puts pressure on pricing and profitability. Finally, the need for skilled operators and technicians to maintain and operate the complex equipment poses an ongoing challenge.
Emerging Opportunities in Pharmaceutical Granulation Equipment Market
Emerging opportunities lie in the development of more sustainable and environmentally friendly granulation technologies. The integration of advanced automation and digital technologies, including AI and machine learning, presents significant growth potential. Expansion into emerging markets with growing pharmaceutical sectors offers substantial opportunities. Lastly, customized equipment solutions tailored to specific customer needs and product formulations present a promising avenue for growth.
Leading Players in the Pharmaceutical Granulation Equipment Market
- Fluid Air (Spraying Systems Co)
- Alexanderwerk
- LFA Machines Oxford LTD
- L B Bohle Maschinen und Verfahren GmbH
- Romaco Group
- I M A INDUSTRIA MACCHINE AUTOMATICHE S P A
- Syntegon Technology GmbH
- GEA Group
- HOSOKAWA MICRON B V
- Anchor Mark Pvt Ltd
- PTK-GB Limited
Key Developments in Pharmaceutical Granulation Equipment Industry
April 2023: Gerteis is expected to exhibit its advanced dry granulation roller compaction at the COPHEX pharmaceutical and cosmetic trade show in Seoul, South Korea. This highlights the ongoing innovation in dry granulation technology.
March 2023: Prochem acquired Tapasya, expanding its presence in the granulation equipment market and strengthening its position in solid dosage formulation solutions. This signifies consolidation within the industry.
Strategic Outlook for Pharmaceutical Granulation Equipment Market
The Pharmaceutical Granulation Equipment market is poised for continued growth, driven by the factors discussed previously. Emerging technologies, such as continuous manufacturing and advanced process analytics, will shape the future of the market. Companies that successfully adapt to these technological advancements and meet the evolving needs of the pharmaceutical industry will be best positioned for future success. The expansion into emerging markets and the development of customized solutions will be critical for long-term growth and market leadership.
Pharmaceutical Granulation Equipment Market Segmentation
-
1. Type
- 1.1. Single Pot Granulators
- 1.2. High Sheer Granulators
- 1.3. Oscillating Granulators
- 1.4. Others
-
2. Mechanism
- 2.1. Dry Granulators
- 2.2. Wet Granulators
- 2.3. Mixture Granulators
-
3. End User
- 3.1. Pharmaceutical Manufacturing Companies
- 3.2. Contract Manufacturing
- 3.3. Others
Pharmaceutical Granulation Equipment Market Segmentation By Geography
-
1. North America
- 1.1. United States
- 1.2. Canada
- 1.3. Mexico
-
2. Europe
- 2.1. Germany
- 2.2. United Kingdom
- 2.3. France
- 2.4. Italy
- 2.5. Spain
- 2.6. Rest of Europe
-
3. Asia Pacific
- 3.1. China
- 3.2. Japan
- 3.3. India
- 3.4. Australia
- 3.5. South Korea
- 3.6. Rest of Asia Pacific
-
4. Middle East and Africa
- 4.1. GCC
- 4.2. South Africa
- 4.3. Rest of Middle East and Africa
-
5. South America
- 5.1. Brazil
- 5.2. Argentina
- 5.3. Rest of South America
Pharmaceutical Granulation Equipment Market REPORT HIGHLIGHTS
| Aspects | Details |
|---|---|
| Study Period | 2019-2033 |
| Base Year | 2024 |
| Estimated Year | 2025 |
| Forecast Period | 2025-2033 |
| Historical Period | 2019-2024 |
| Growth Rate | CAGR of 5.50% from 2019-2033 |
| Segmentation |
|
Table of Contents
- 1. Introduction
- 1.1. Research Scope
- 1.2. Market Segmentation
- 1.3. Research Methodology
- 1.4. Definitions and Assumptions
- 2. Executive Summary
- 2.1. Introduction
- 3. Market Dynamics
- 3.1. Introduction
- 3.2. Market Drivers
- 3.2.1. Increasing Number of Research Laboratories; Growing Healthcare R&D Expenditure
- 3.3. Market Restrains
- 3.3.1. High Cost of Equipment
- 3.4. Market Trends
- 3.4.1. Pharmaceutical Manufacturing Companies Segment is Expected to Hold a Significant Market Share Over the Forecast Period
- 4. Market Factor Analysis
- 4.1. Porters Five Forces
- 4.2. Supply/Value Chain
- 4.3. PESTEL analysis
- 4.4. Market Entropy
- 4.5. Patent/Trademark Analysis
- 5. Global Pharmaceutical Granulation Equipment Market Analysis, Insights and Forecast, 2019-2031
- 5.1. Market Analysis, Insights and Forecast - by Type
- 5.1.1. Single Pot Granulators
- 5.1.2. High Sheer Granulators
- 5.1.3. Oscillating Granulators
- 5.1.4. Others
- 5.2. Market Analysis, Insights and Forecast - by Mechanism
- 5.2.1. Dry Granulators
- 5.2.2. Wet Granulators
- 5.2.3. Mixture Granulators
- 5.3. Market Analysis, Insights and Forecast - by End User
- 5.3.1. Pharmaceutical Manufacturing Companies
- 5.3.2. Contract Manufacturing
- 5.3.3. Others
- 5.4. Market Analysis, Insights and Forecast - by Region
- 5.4.1. North America
- 5.4.2. Europe
- 5.4.3. Asia Pacific
- 5.4.4. Middle East and Africa
- 5.4.5. South America
- 5.1. Market Analysis, Insights and Forecast - by Type
- 6. North America Pharmaceutical Granulation Equipment Market Analysis, Insights and Forecast, 2019-2031
- 6.1. Market Analysis, Insights and Forecast - by Type
- 6.1.1. Single Pot Granulators
- 6.1.2. High Sheer Granulators
- 6.1.3. Oscillating Granulators
- 6.1.4. Others
- 6.2. Market Analysis, Insights and Forecast - by Mechanism
- 6.2.1. Dry Granulators
- 6.2.2. Wet Granulators
- 6.2.3. Mixture Granulators
- 6.3. Market Analysis, Insights and Forecast - by End User
- 6.3.1. Pharmaceutical Manufacturing Companies
- 6.3.2. Contract Manufacturing
- 6.3.3. Others
- 6.1. Market Analysis, Insights and Forecast - by Type
- 7. Europe Pharmaceutical Granulation Equipment Market Analysis, Insights and Forecast, 2019-2031
- 7.1. Market Analysis, Insights and Forecast - by Type
- 7.1.1. Single Pot Granulators
- 7.1.2. High Sheer Granulators
- 7.1.3. Oscillating Granulators
- 7.1.4. Others
- 7.2. Market Analysis, Insights and Forecast - by Mechanism
- 7.2.1. Dry Granulators
- 7.2.2. Wet Granulators
- 7.2.3. Mixture Granulators
- 7.3. Market Analysis, Insights and Forecast - by End User
- 7.3.1. Pharmaceutical Manufacturing Companies
- 7.3.2. Contract Manufacturing
- 7.3.3. Others
- 7.1. Market Analysis, Insights and Forecast - by Type
- 8. Asia Pacific Pharmaceutical Granulation Equipment Market Analysis, Insights and Forecast, 2019-2031
- 8.1. Market Analysis, Insights and Forecast - by Type
- 8.1.1. Single Pot Granulators
- 8.1.2. High Sheer Granulators
- 8.1.3. Oscillating Granulators
- 8.1.4. Others
- 8.2. Market Analysis, Insights and Forecast - by Mechanism
- 8.2.1. Dry Granulators
- 8.2.2. Wet Granulators
- 8.2.3. Mixture Granulators
- 8.3. Market Analysis, Insights and Forecast - by End User
- 8.3.1. Pharmaceutical Manufacturing Companies
- 8.3.2. Contract Manufacturing
- 8.3.3. Others
- 8.1. Market Analysis, Insights and Forecast - by Type
- 9. Middle East and Africa Pharmaceutical Granulation Equipment Market Analysis, Insights and Forecast, 2019-2031
- 9.1. Market Analysis, Insights and Forecast - by Type
- 9.1.1. Single Pot Granulators
- 9.1.2. High Sheer Granulators
- 9.1.3. Oscillating Granulators
- 9.1.4. Others
- 9.2. Market Analysis, Insights and Forecast - by Mechanism
- 9.2.1. Dry Granulators
- 9.2.2. Wet Granulators
- 9.2.3. Mixture Granulators
- 9.3. Market Analysis, Insights and Forecast - by End User
- 9.3.1. Pharmaceutical Manufacturing Companies
- 9.3.2. Contract Manufacturing
- 9.3.3. Others
- 9.1. Market Analysis, Insights and Forecast - by Type
- 10. South America Pharmaceutical Granulation Equipment Market Analysis, Insights and Forecast, 2019-2031
- 10.1. Market Analysis, Insights and Forecast - by Type
- 10.1.1. Single Pot Granulators
- 10.1.2. High Sheer Granulators
- 10.1.3. Oscillating Granulators
- 10.1.4. Others
- 10.2. Market Analysis, Insights and Forecast - by Mechanism
- 10.2.1. Dry Granulators
- 10.2.2. Wet Granulators
- 10.2.3. Mixture Granulators
- 10.3. Market Analysis, Insights and Forecast - by End User
- 10.3.1. Pharmaceutical Manufacturing Companies
- 10.3.2. Contract Manufacturing
- 10.3.3. Others
- 10.1. Market Analysis, Insights and Forecast - by Type
- 11. North America Pharmaceutical Granulation Equipment Market Analysis, Insights and Forecast, 2019-2031
- 11.1. Market Analysis, Insights and Forecast - By Country/Sub-region
- 11.1.1 United States
- 11.1.2 Canada
- 11.1.3 Mexico
- 12. Europe Pharmaceutical Granulation Equipment Market Analysis, Insights and Forecast, 2019-2031
- 12.1. Market Analysis, Insights and Forecast - By Country/Sub-region
- 12.1.1 Germany
- 12.1.2 United Kingdom
- 12.1.3 France
- 12.1.4 Italy
- 12.1.5 Spain
- 12.1.6 Rest of Europe
- 13. Asia Pacific Pharmaceutical Granulation Equipment Market Analysis, Insights and Forecast, 2019-2031
- 13.1. Market Analysis, Insights and Forecast - By Country/Sub-region
- 13.1.1 China
- 13.1.2 Japan
- 13.1.3 India
- 13.1.4 Australia
- 13.1.5 South Korea
- 13.1.6 Rest of Asia Pacific
- 14. Middle East and Africa Pharmaceutical Granulation Equipment Market Analysis, Insights and Forecast, 2019-2031
- 14.1. Market Analysis, Insights and Forecast - By Country/Sub-region
- 14.1.1 GCC
- 14.1.2 South Africa
- 14.1.3 Rest of Middle East and Africa
- 15. South America Pharmaceutical Granulation Equipment Market Analysis, Insights and Forecast, 2019-2031
- 15.1. Market Analysis, Insights and Forecast - By Country/Sub-region
- 15.1.1 Brazil
- 15.1.2 Argentina
- 15.1.3 Rest of South America
- 16. Competitive Analysis
- 16.1. Global Market Share Analysis 2024
- 16.2. Company Profiles
- 16.2.1 Fluid Air (Spraying Systems Co )
- 16.2.1.1. Overview
- 16.2.1.2. Products
- 16.2.1.3. SWOT Analysis
- 16.2.1.4. Recent Developments
- 16.2.1.5. Financials (Based on Availability)
- 16.2.2 Alexanderwerk
- 16.2.2.1. Overview
- 16.2.2.2. Products
- 16.2.2.3. SWOT Analysis
- 16.2.2.4. Recent Developments
- 16.2.2.5. Financials (Based on Availability)
- 16.2.3 LFA Machines Oxford LTD
- 16.2.3.1. Overview
- 16.2.3.2. Products
- 16.2.3.3. SWOT Analysis
- 16.2.3.4. Recent Developments
- 16.2.3.5. Financials (Based on Availability)
- 16.2.4 L B Bohle Maschinen und Verfahren GmbH
- 16.2.4.1. Overview
- 16.2.4.2. Products
- 16.2.4.3. SWOT Analysis
- 16.2.4.4. Recent Developments
- 16.2.4.5. Financials (Based on Availability)
- 16.2.5 Romaco Group
- 16.2.5.1. Overview
- 16.2.5.2. Products
- 16.2.5.3. SWOT Analysis
- 16.2.5.4. Recent Developments
- 16.2.5.5. Financials (Based on Availability)
- 16.2.6 I M A INDUSTRIA MACCHINE AUTOMATICHE S P A
- 16.2.6.1. Overview
- 16.2.6.2. Products
- 16.2.6.3. SWOT Analysis
- 16.2.6.4. Recent Developments
- 16.2.6.5. Financials (Based on Availability)
- 16.2.7 Syntegon Technology GmbH
- 16.2.7.1. Overview
- 16.2.7.2. Products
- 16.2.7.3. SWOT Analysis
- 16.2.7.4. Recent Developments
- 16.2.7.5. Financials (Based on Availability)
- 16.2.8 GEA Group
- 16.2.8.1. Overview
- 16.2.8.2. Products
- 16.2.8.3. SWOT Analysis
- 16.2.8.4. Recent Developments
- 16.2.8.5. Financials (Based on Availability)
- 16.2.9 HOSOKAWA MICRON B V
- 16.2.9.1. Overview
- 16.2.9.2. Products
- 16.2.9.3. SWOT Analysis
- 16.2.9.4. Recent Developments
- 16.2.9.5. Financials (Based on Availability)
- 16.2.10 Anchor Mark Pvt Ltd
- 16.2.10.1. Overview
- 16.2.10.2. Products
- 16.2.10.3. SWOT Analysis
- 16.2.10.4. Recent Developments
- 16.2.10.5. Financials (Based on Availability)
- 16.2.11 PTK-GB Limited
- 16.2.11.1. Overview
- 16.2.11.2. Products
- 16.2.11.3. SWOT Analysis
- 16.2.11.4. Recent Developments
- 16.2.11.5. Financials (Based on Availability)
- 16.2.1 Fluid Air (Spraying Systems Co )
List of Figures
- Figure 1: Global Pharmaceutical Granulation Equipment Market Revenue Breakdown (Million, %) by Region 2024 & 2032
- Figure 2: Global Pharmaceutical Granulation Equipment Market Volume Breakdown (K Unit, %) by Region 2024 & 2032
- Figure 3: North America Pharmaceutical Granulation Equipment Market Revenue (Million), by Country 2024 & 2032
- Figure 4: North America Pharmaceutical Granulation Equipment Market Volume (K Unit), by Country 2024 & 2032
- Figure 5: North America Pharmaceutical Granulation Equipment Market Revenue Share (%), by Country 2024 & 2032
- Figure 6: North America Pharmaceutical Granulation Equipment Market Volume Share (%), by Country 2024 & 2032
- Figure 7: Europe Pharmaceutical Granulation Equipment Market Revenue (Million), by Country 2024 & 2032
- Figure 8: Europe Pharmaceutical Granulation Equipment Market Volume (K Unit), by Country 2024 & 2032
- Figure 9: Europe Pharmaceutical Granulation Equipment Market Revenue Share (%), by Country 2024 & 2032
- Figure 10: Europe Pharmaceutical Granulation Equipment Market Volume Share (%), by Country 2024 & 2032
- Figure 11: Asia Pacific Pharmaceutical Granulation Equipment Market Revenue (Million), by Country 2024 & 2032
- Figure 12: Asia Pacific Pharmaceutical Granulation Equipment Market Volume (K Unit), by Country 2024 & 2032
- Figure 13: Asia Pacific Pharmaceutical Granulation Equipment Market Revenue Share (%), by Country 2024 & 2032
- Figure 14: Asia Pacific Pharmaceutical Granulation Equipment Market Volume Share (%), by Country 2024 & 2032
- Figure 15: Middle East and Africa Pharmaceutical Granulation Equipment Market Revenue (Million), by Country 2024 & 2032
- Figure 16: Middle East and Africa Pharmaceutical Granulation Equipment Market Volume (K Unit), by Country 2024 & 2032
- Figure 17: Middle East and Africa Pharmaceutical Granulation Equipment Market Revenue Share (%), by Country 2024 & 2032
- Figure 18: Middle East and Africa Pharmaceutical Granulation Equipment Market Volume Share (%), by Country 2024 & 2032
- Figure 19: South America Pharmaceutical Granulation Equipment Market Revenue (Million), by Country 2024 & 2032
- Figure 20: South America Pharmaceutical Granulation Equipment Market Volume (K Unit), by Country 2024 & 2032
- Figure 21: South America Pharmaceutical Granulation Equipment Market Revenue Share (%), by Country 2024 & 2032
- Figure 22: South America Pharmaceutical Granulation Equipment Market Volume Share (%), by Country 2024 & 2032
- Figure 23: North America Pharmaceutical Granulation Equipment Market Revenue (Million), by Type 2024 & 2032
- Figure 24: North America Pharmaceutical Granulation Equipment Market Volume (K Unit), by Type 2024 & 2032
- Figure 25: North America Pharmaceutical Granulation Equipment Market Revenue Share (%), by Type 2024 & 2032
- Figure 26: North America Pharmaceutical Granulation Equipment Market Volume Share (%), by Type 2024 & 2032
- Figure 27: North America Pharmaceutical Granulation Equipment Market Revenue (Million), by Mechanism 2024 & 2032
- Figure 28: North America Pharmaceutical Granulation Equipment Market Volume (K Unit), by Mechanism 2024 & 2032
- Figure 29: North America Pharmaceutical Granulation Equipment Market Revenue Share (%), by Mechanism 2024 & 2032
- Figure 30: North America Pharmaceutical Granulation Equipment Market Volume Share (%), by Mechanism 2024 & 2032
- Figure 31: North America Pharmaceutical Granulation Equipment Market Revenue (Million), by End User 2024 & 2032
- Figure 32: North America Pharmaceutical Granulation Equipment Market Volume (K Unit), by End User 2024 & 2032
- Figure 33: North America Pharmaceutical Granulation Equipment Market Revenue Share (%), by End User 2024 & 2032
- Figure 34: North America Pharmaceutical Granulation Equipment Market Volume Share (%), by End User 2024 & 2032
- Figure 35: North America Pharmaceutical Granulation Equipment Market Revenue (Million), by Country 2024 & 2032
- Figure 36: North America Pharmaceutical Granulation Equipment Market Volume (K Unit), by Country 2024 & 2032
- Figure 37: North America Pharmaceutical Granulation Equipment Market Revenue Share (%), by Country 2024 & 2032
- Figure 38: North America Pharmaceutical Granulation Equipment Market Volume Share (%), by Country 2024 & 2032
- Figure 39: Europe Pharmaceutical Granulation Equipment Market Revenue (Million), by Type 2024 & 2032
- Figure 40: Europe Pharmaceutical Granulation Equipment Market Volume (K Unit), by Type 2024 & 2032
- Figure 41: Europe Pharmaceutical Granulation Equipment Market Revenue Share (%), by Type 2024 & 2032
- Figure 42: Europe Pharmaceutical Granulation Equipment Market Volume Share (%), by Type 2024 & 2032
- Figure 43: Europe Pharmaceutical Granulation Equipment Market Revenue (Million), by Mechanism 2024 & 2032
- Figure 44: Europe Pharmaceutical Granulation Equipment Market Volume (K Unit), by Mechanism 2024 & 2032
- Figure 45: Europe Pharmaceutical Granulation Equipment Market Revenue Share (%), by Mechanism 2024 & 2032
- Figure 46: Europe Pharmaceutical Granulation Equipment Market Volume Share (%), by Mechanism 2024 & 2032
- Figure 47: Europe Pharmaceutical Granulation Equipment Market Revenue (Million), by End User 2024 & 2032
- Figure 48: Europe Pharmaceutical Granulation Equipment Market Volume (K Unit), by End User 2024 & 2032
- Figure 49: Europe Pharmaceutical Granulation Equipment Market Revenue Share (%), by End User 2024 & 2032
- Figure 50: Europe Pharmaceutical Granulation Equipment Market Volume Share (%), by End User 2024 & 2032
- Figure 51: Europe Pharmaceutical Granulation Equipment Market Revenue (Million), by Country 2024 & 2032
- Figure 52: Europe Pharmaceutical Granulation Equipment Market Volume (K Unit), by Country 2024 & 2032
- Figure 53: Europe Pharmaceutical Granulation Equipment Market Revenue Share (%), by Country 2024 & 2032
- Figure 54: Europe Pharmaceutical Granulation Equipment Market Volume Share (%), by Country 2024 & 2032
- Figure 55: Asia Pacific Pharmaceutical Granulation Equipment Market Revenue (Million), by Type 2024 & 2032
- Figure 56: Asia Pacific Pharmaceutical Granulation Equipment Market Volume (K Unit), by Type 2024 & 2032
- Figure 57: Asia Pacific Pharmaceutical Granulation Equipment Market Revenue Share (%), by Type 2024 & 2032
- Figure 58: Asia Pacific Pharmaceutical Granulation Equipment Market Volume Share (%), by Type 2024 & 2032
- Figure 59: Asia Pacific Pharmaceutical Granulation Equipment Market Revenue (Million), by Mechanism 2024 & 2032
- Figure 60: Asia Pacific Pharmaceutical Granulation Equipment Market Volume (K Unit), by Mechanism 2024 & 2032
- Figure 61: Asia Pacific Pharmaceutical Granulation Equipment Market Revenue Share (%), by Mechanism 2024 & 2032
- Figure 62: Asia Pacific Pharmaceutical Granulation Equipment Market Volume Share (%), by Mechanism 2024 & 2032
- Figure 63: Asia Pacific Pharmaceutical Granulation Equipment Market Revenue (Million), by End User 2024 & 2032
- Figure 64: Asia Pacific Pharmaceutical Granulation Equipment Market Volume (K Unit), by End User 2024 & 2032
- Figure 65: Asia Pacific Pharmaceutical Granulation Equipment Market Revenue Share (%), by End User 2024 & 2032
- Figure 66: Asia Pacific Pharmaceutical Granulation Equipment Market Volume Share (%), by End User 2024 & 2032
- Figure 67: Asia Pacific Pharmaceutical Granulation Equipment Market Revenue (Million), by Country 2024 & 2032
- Figure 68: Asia Pacific Pharmaceutical Granulation Equipment Market Volume (K Unit), by Country 2024 & 2032
- Figure 69: Asia Pacific Pharmaceutical Granulation Equipment Market Revenue Share (%), by Country 2024 & 2032
- Figure 70: Asia Pacific Pharmaceutical Granulation Equipment Market Volume Share (%), by Country 2024 & 2032
- Figure 71: Middle East and Africa Pharmaceutical Granulation Equipment Market Revenue (Million), by Type 2024 & 2032
- Figure 72: Middle East and Africa Pharmaceutical Granulation Equipment Market Volume (K Unit), by Type 2024 & 2032
- Figure 73: Middle East and Africa Pharmaceutical Granulation Equipment Market Revenue Share (%), by Type 2024 & 2032
- Figure 74: Middle East and Africa Pharmaceutical Granulation Equipment Market Volume Share (%), by Type 2024 & 2032
- Figure 75: Middle East and Africa Pharmaceutical Granulation Equipment Market Revenue (Million), by Mechanism 2024 & 2032
- Figure 76: Middle East and Africa Pharmaceutical Granulation Equipment Market Volume (K Unit), by Mechanism 2024 & 2032
- Figure 77: Middle East and Africa Pharmaceutical Granulation Equipment Market Revenue Share (%), by Mechanism 2024 & 2032
- Figure 78: Middle East and Africa Pharmaceutical Granulation Equipment Market Volume Share (%), by Mechanism 2024 & 2032
- Figure 79: Middle East and Africa Pharmaceutical Granulation Equipment Market Revenue (Million), by End User 2024 & 2032
- Figure 80: Middle East and Africa Pharmaceutical Granulation Equipment Market Volume (K Unit), by End User 2024 & 2032
- Figure 81: Middle East and Africa Pharmaceutical Granulation Equipment Market Revenue Share (%), by End User 2024 & 2032
- Figure 82: Middle East and Africa Pharmaceutical Granulation Equipment Market Volume Share (%), by End User 2024 & 2032
- Figure 83: Middle East and Africa Pharmaceutical Granulation Equipment Market Revenue (Million), by Country 2024 & 2032
- Figure 84: Middle East and Africa Pharmaceutical Granulation Equipment Market Volume (K Unit), by Country 2024 & 2032
- Figure 85: Middle East and Africa Pharmaceutical Granulation Equipment Market Revenue Share (%), by Country 2024 & 2032
- Figure 86: Middle East and Africa Pharmaceutical Granulation Equipment Market Volume Share (%), by Country 2024 & 2032
- Figure 87: South America Pharmaceutical Granulation Equipment Market Revenue (Million), by Type 2024 & 2032
- Figure 88: South America Pharmaceutical Granulation Equipment Market Volume (K Unit), by Type 2024 & 2032
- Figure 89: South America Pharmaceutical Granulation Equipment Market Revenue Share (%), by Type 2024 & 2032
- Figure 90: South America Pharmaceutical Granulation Equipment Market Volume Share (%), by Type 2024 & 2032
- Figure 91: South America Pharmaceutical Granulation Equipment Market Revenue (Million), by Mechanism 2024 & 2032
- Figure 92: South America Pharmaceutical Granulation Equipment Market Volume (K Unit), by Mechanism 2024 & 2032
- Figure 93: South America Pharmaceutical Granulation Equipment Market Revenue Share (%), by Mechanism 2024 & 2032
- Figure 94: South America Pharmaceutical Granulation Equipment Market Volume Share (%), by Mechanism 2024 & 2032
- Figure 95: South America Pharmaceutical Granulation Equipment Market Revenue (Million), by End User 2024 & 2032
- Figure 96: South America Pharmaceutical Granulation Equipment Market Volume (K Unit), by End User 2024 & 2032
- Figure 97: South America Pharmaceutical Granulation Equipment Market Revenue Share (%), by End User 2024 & 2032
- Figure 98: South America Pharmaceutical Granulation Equipment Market Volume Share (%), by End User 2024 & 2032
- Figure 99: South America Pharmaceutical Granulation Equipment Market Revenue (Million), by Country 2024 & 2032
- Figure 100: South America Pharmaceutical Granulation Equipment Market Volume (K Unit), by Country 2024 & 2032
- Figure 101: South America Pharmaceutical Granulation Equipment Market Revenue Share (%), by Country 2024 & 2032
- Figure 102: South America Pharmaceutical Granulation Equipment Market Volume Share (%), by Country 2024 & 2032
List of Tables
- Table 1: Global Pharmaceutical Granulation Equipment Market Revenue Million Forecast, by Region 2019 & 2032
- Table 2: Global Pharmaceutical Granulation Equipment Market Volume K Unit Forecast, by Region 2019 & 2032
- Table 3: Global Pharmaceutical Granulation Equipment Market Revenue Million Forecast, by Type 2019 & 2032
- Table 4: Global Pharmaceutical Granulation Equipment Market Volume K Unit Forecast, by Type 2019 & 2032
- Table 5: Global Pharmaceutical Granulation Equipment Market Revenue Million Forecast, by Mechanism 2019 & 2032
- Table 6: Global Pharmaceutical Granulation Equipment Market Volume K Unit Forecast, by Mechanism 2019 & 2032
- Table 7: Global Pharmaceutical Granulation Equipment Market Revenue Million Forecast, by End User 2019 & 2032
- Table 8: Global Pharmaceutical Granulation Equipment Market Volume K Unit Forecast, by End User 2019 & 2032
- Table 9: Global Pharmaceutical Granulation Equipment Market Revenue Million Forecast, by Region 2019 & 2032
- Table 10: Global Pharmaceutical Granulation Equipment Market Volume K Unit Forecast, by Region 2019 & 2032
- Table 11: Global Pharmaceutical Granulation Equipment Market Revenue Million Forecast, by Country 2019 & 2032
- Table 12: Global Pharmaceutical Granulation Equipment Market Volume K Unit Forecast, by Country 2019 & 2032
- Table 13: United States Pharmaceutical Granulation Equipment Market Revenue (Million) Forecast, by Application 2019 & 2032
- Table 14: United States Pharmaceutical Granulation Equipment Market Volume (K Unit) Forecast, by Application 2019 & 2032
- Table 15: Canada Pharmaceutical Granulation Equipment Market Revenue (Million) Forecast, by Application 2019 & 2032
- Table 16: Canada Pharmaceutical Granulation Equipment Market Volume (K Unit) Forecast, by Application 2019 & 2032
- Table 17: Mexico Pharmaceutical Granulation Equipment Market Revenue (Million) Forecast, by Application 2019 & 2032
- Table 18: Mexico Pharmaceutical Granulation Equipment Market Volume (K Unit) Forecast, by Application 2019 & 2032
- Table 19: Global Pharmaceutical Granulation Equipment Market Revenue Million Forecast, by Country 2019 & 2032
- Table 20: Global Pharmaceutical Granulation Equipment Market Volume K Unit Forecast, by Country 2019 & 2032
- Table 21: Germany Pharmaceutical Granulation Equipment Market Revenue (Million) Forecast, by Application 2019 & 2032
- Table 22: Germany Pharmaceutical Granulation Equipment Market Volume (K Unit) Forecast, by Application 2019 & 2032
- Table 23: United Kingdom Pharmaceutical Granulation Equipment Market Revenue (Million) Forecast, by Application 2019 & 2032
- Table 24: United Kingdom Pharmaceutical Granulation Equipment Market Volume (K Unit) Forecast, by Application 2019 & 2032
- Table 25: France Pharmaceutical Granulation Equipment Market Revenue (Million) Forecast, by Application 2019 & 2032
- Table 26: France Pharmaceutical Granulation Equipment Market Volume (K Unit) Forecast, by Application 2019 & 2032
- Table 27: Italy Pharmaceutical Granulation Equipment Market Revenue (Million) Forecast, by Application 2019 & 2032
- Table 28: Italy Pharmaceutical Granulation Equipment Market Volume (K Unit) Forecast, by Application 2019 & 2032
- Table 29: Spain Pharmaceutical Granulation Equipment Market Revenue (Million) Forecast, by Application 2019 & 2032
- Table 30: Spain Pharmaceutical Granulation Equipment Market Volume (K Unit) Forecast, by Application 2019 & 2032
- Table 31: Rest of Europe Pharmaceutical Granulation Equipment Market Revenue (Million) Forecast, by Application 2019 & 2032
- Table 32: Rest of Europe Pharmaceutical Granulation Equipment Market Volume (K Unit) Forecast, by Application 2019 & 2032
- Table 33: Global Pharmaceutical Granulation Equipment Market Revenue Million Forecast, by Country 2019 & 2032
- Table 34: Global Pharmaceutical Granulation Equipment Market Volume K Unit Forecast, by Country 2019 & 2032
- Table 35: China Pharmaceutical Granulation Equipment Market Revenue (Million) Forecast, by Application 2019 & 2032
- Table 36: China Pharmaceutical Granulation Equipment Market Volume (K Unit) Forecast, by Application 2019 & 2032
- Table 37: Japan Pharmaceutical Granulation Equipment Market Revenue (Million) Forecast, by Application 2019 & 2032
- Table 38: Japan Pharmaceutical Granulation Equipment Market Volume (K Unit) Forecast, by Application 2019 & 2032
- Table 39: India Pharmaceutical Granulation Equipment Market Revenue (Million) Forecast, by Application 2019 & 2032
- Table 40: India Pharmaceutical Granulation Equipment Market Volume (K Unit) Forecast, by Application 2019 & 2032
- Table 41: Australia Pharmaceutical Granulation Equipment Market Revenue (Million) Forecast, by Application 2019 & 2032
- Table 42: Australia Pharmaceutical Granulation Equipment Market Volume (K Unit) Forecast, by Application 2019 & 2032
- Table 43: South Korea Pharmaceutical Granulation Equipment Market Revenue (Million) Forecast, by Application 2019 & 2032
- Table 44: South Korea Pharmaceutical Granulation Equipment Market Volume (K Unit) Forecast, by Application 2019 & 2032
- Table 45: Rest of Asia Pacific Pharmaceutical Granulation Equipment Market Revenue (Million) Forecast, by Application 2019 & 2032
- Table 46: Rest of Asia Pacific Pharmaceutical Granulation Equipment Market Volume (K Unit) Forecast, by Application 2019 & 2032
- Table 47: Global Pharmaceutical Granulation Equipment Market Revenue Million Forecast, by Country 2019 & 2032
- Table 48: Global Pharmaceutical Granulation Equipment Market Volume K Unit Forecast, by Country 2019 & 2032
- Table 49: GCC Pharmaceutical Granulation Equipment Market Revenue (Million) Forecast, by Application 2019 & 2032
- Table 50: GCC Pharmaceutical Granulation Equipment Market Volume (K Unit) Forecast, by Application 2019 & 2032
- Table 51: South Africa Pharmaceutical Granulation Equipment Market Revenue (Million) Forecast, by Application 2019 & 2032
- Table 52: South Africa Pharmaceutical Granulation Equipment Market Volume (K Unit) Forecast, by Application 2019 & 2032
- Table 53: Rest of Middle East and Africa Pharmaceutical Granulation Equipment Market Revenue (Million) Forecast, by Application 2019 & 2032
- Table 54: Rest of Middle East and Africa Pharmaceutical Granulation Equipment Market Volume (K Unit) Forecast, by Application 2019 & 2032
- Table 55: Global Pharmaceutical Granulation Equipment Market Revenue Million Forecast, by Country 2019 & 2032
- Table 56: Global Pharmaceutical Granulation Equipment Market Volume K Unit Forecast, by Country 2019 & 2032
- Table 57: Brazil Pharmaceutical Granulation Equipment Market Revenue (Million) Forecast, by Application 2019 & 2032
- Table 58: Brazil Pharmaceutical Granulation Equipment Market Volume (K Unit) Forecast, by Application 2019 & 2032
- Table 59: Argentina Pharmaceutical Granulation Equipment Market Revenue (Million) Forecast, by Application 2019 & 2032
- Table 60: Argentina Pharmaceutical Granulation Equipment Market Volume (K Unit) Forecast, by Application 2019 & 2032
- Table 61: Rest of South America Pharmaceutical Granulation Equipment Market Revenue (Million) Forecast, by Application 2019 & 2032
- Table 62: Rest of South America Pharmaceutical Granulation Equipment Market Volume (K Unit) Forecast, by Application 2019 & 2032
- Table 63: Global Pharmaceutical Granulation Equipment Market Revenue Million Forecast, by Type 2019 & 2032
- Table 64: Global Pharmaceutical Granulation Equipment Market Volume K Unit Forecast, by Type 2019 & 2032
- Table 65: Global Pharmaceutical Granulation Equipment Market Revenue Million Forecast, by Mechanism 2019 & 2032
- Table 66: Global Pharmaceutical Granulation Equipment Market Volume K Unit Forecast, by Mechanism 2019 & 2032
- Table 67: Global Pharmaceutical Granulation Equipment Market Revenue Million Forecast, by End User 2019 & 2032
- Table 68: Global Pharmaceutical Granulation Equipment Market Volume K Unit Forecast, by End User 2019 & 2032
- Table 69: Global Pharmaceutical Granulation Equipment Market Revenue Million Forecast, by Country 2019 & 2032
- Table 70: Global Pharmaceutical Granulation Equipment Market Volume K Unit Forecast, by Country 2019 & 2032
- Table 71: United States Pharmaceutical Granulation Equipment Market Revenue (Million) Forecast, by Application 2019 & 2032
- Table 72: United States Pharmaceutical Granulation Equipment Market Volume (K Unit) Forecast, by Application 2019 & 2032
- Table 73: Canada Pharmaceutical Granulation Equipment Market Revenue (Million) Forecast, by Application 2019 & 2032
- Table 74: Canada Pharmaceutical Granulation Equipment Market Volume (K Unit) Forecast, by Application 2019 & 2032
- Table 75: Mexico Pharmaceutical Granulation Equipment Market Revenue (Million) Forecast, by Application 2019 & 2032
- Table 76: Mexico Pharmaceutical Granulation Equipment Market Volume (K Unit) Forecast, by Application 2019 & 2032
- Table 77: Global Pharmaceutical Granulation Equipment Market Revenue Million Forecast, by Type 2019 & 2032
- Table 78: Global Pharmaceutical Granulation Equipment Market Volume K Unit Forecast, by Type 2019 & 2032
- Table 79: Global Pharmaceutical Granulation Equipment Market Revenue Million Forecast, by Mechanism 2019 & 2032
- Table 80: Global Pharmaceutical Granulation Equipment Market Volume K Unit Forecast, by Mechanism 2019 & 2032
- Table 81: Global Pharmaceutical Granulation Equipment Market Revenue Million Forecast, by End User 2019 & 2032
- Table 82: Global Pharmaceutical Granulation Equipment Market Volume K Unit Forecast, by End User 2019 & 2032
- Table 83: Global Pharmaceutical Granulation Equipment Market Revenue Million Forecast, by Country 2019 & 2032
- Table 84: Global Pharmaceutical Granulation Equipment Market Volume K Unit Forecast, by Country 2019 & 2032
- Table 85: Germany Pharmaceutical Granulation Equipment Market Revenue (Million) Forecast, by Application 2019 & 2032
- Table 86: Germany Pharmaceutical Granulation Equipment Market Volume (K Unit) Forecast, by Application 2019 & 2032
- Table 87: United Kingdom Pharmaceutical Granulation Equipment Market Revenue (Million) Forecast, by Application 2019 & 2032
- Table 88: United Kingdom Pharmaceutical Granulation Equipment Market Volume (K Unit) Forecast, by Application 2019 & 2032
- Table 89: France Pharmaceutical Granulation Equipment Market Revenue (Million) Forecast, by Application 2019 & 2032
- Table 90: France Pharmaceutical Granulation Equipment Market Volume (K Unit) Forecast, by Application 2019 & 2032
- Table 91: Italy Pharmaceutical Granulation Equipment Market Revenue (Million) Forecast, by Application 2019 & 2032
- Table 92: Italy Pharmaceutical Granulation Equipment Market Volume (K Unit) Forecast, by Application 2019 & 2032
- Table 93: Spain Pharmaceutical Granulation Equipment Market Revenue (Million) Forecast, by Application 2019 & 2032
- Table 94: Spain Pharmaceutical Granulation Equipment Market Volume (K Unit) Forecast, by Application 2019 & 2032
- Table 95: Rest of Europe Pharmaceutical Granulation Equipment Market Revenue (Million) Forecast, by Application 2019 & 2032
- Table 96: Rest of Europe Pharmaceutical Granulation Equipment Market Volume (K Unit) Forecast, by Application 2019 & 2032
- Table 97: Global Pharmaceutical Granulation Equipment Market Revenue Million Forecast, by Type 2019 & 2032
- Table 98: Global Pharmaceutical Granulation Equipment Market Volume K Unit Forecast, by Type 2019 & 2032
- Table 99: Global Pharmaceutical Granulation Equipment Market Revenue Million Forecast, by Mechanism 2019 & 2032
- Table 100: Global Pharmaceutical Granulation Equipment Market Volume K Unit Forecast, by Mechanism 2019 & 2032
- Table 101: Global Pharmaceutical Granulation Equipment Market Revenue Million Forecast, by End User 2019 & 2032
- Table 102: Global Pharmaceutical Granulation Equipment Market Volume K Unit Forecast, by End User 2019 & 2032
- Table 103: Global Pharmaceutical Granulation Equipment Market Revenue Million Forecast, by Country 2019 & 2032
- Table 104: Global Pharmaceutical Granulation Equipment Market Volume K Unit Forecast, by Country 2019 & 2032
- Table 105: China Pharmaceutical Granulation Equipment Market Revenue (Million) Forecast, by Application 2019 & 2032
- Table 106: China Pharmaceutical Granulation Equipment Market Volume (K Unit) Forecast, by Application 2019 & 2032
- Table 107: Japan Pharmaceutical Granulation Equipment Market Revenue (Million) Forecast, by Application 2019 & 2032
- Table 108: Japan Pharmaceutical Granulation Equipment Market Volume (K Unit) Forecast, by Application 2019 & 2032
- Table 109: India Pharmaceutical Granulation Equipment Market Revenue (Million) Forecast, by Application 2019 & 2032
- Table 110: India Pharmaceutical Granulation Equipment Market Volume (K Unit) Forecast, by Application 2019 & 2032
- Table 111: Australia Pharmaceutical Granulation Equipment Market Revenue (Million) Forecast, by Application 2019 & 2032
- Table 112: Australia Pharmaceutical Granulation Equipment Market Volume (K Unit) Forecast, by Application 2019 & 2032
- Table 113: South Korea Pharmaceutical Granulation Equipment Market Revenue (Million) Forecast, by Application 2019 & 2032
- Table 114: South Korea Pharmaceutical Granulation Equipment Market Volume (K Unit) Forecast, by Application 2019 & 2032
- Table 115: Rest of Asia Pacific Pharmaceutical Granulation Equipment Market Revenue (Million) Forecast, by Application 2019 & 2032
- Table 116: Rest of Asia Pacific Pharmaceutical Granulation Equipment Market Volume (K Unit) Forecast, by Application 2019 & 2032
- Table 117: Global Pharmaceutical Granulation Equipment Market Revenue Million Forecast, by Type 2019 & 2032
- Table 118: Global Pharmaceutical Granulation Equipment Market Volume K Unit Forecast, by Type 2019 & 2032
- Table 119: Global Pharmaceutical Granulation Equipment Market Revenue Million Forecast, by Mechanism 2019 & 2032
- Table 120: Global Pharmaceutical Granulation Equipment Market Volume K Unit Forecast, by Mechanism 2019 & 2032
- Table 121: Global Pharmaceutical Granulation Equipment Market Revenue Million Forecast, by End User 2019 & 2032
- Table 122: Global Pharmaceutical Granulation Equipment Market Volume K Unit Forecast, by End User 2019 & 2032
- Table 123: Global Pharmaceutical Granulation Equipment Market Revenue Million Forecast, by Country 2019 & 2032
- Table 124: Global Pharmaceutical Granulation Equipment Market Volume K Unit Forecast, by Country 2019 & 2032
- Table 125: GCC Pharmaceutical Granulation Equipment Market Revenue (Million) Forecast, by Application 2019 & 2032
- Table 126: GCC Pharmaceutical Granulation Equipment Market Volume (K Unit) Forecast, by Application 2019 & 2032
- Table 127: South Africa Pharmaceutical Granulation Equipment Market Revenue (Million) Forecast, by Application 2019 & 2032
- Table 128: South Africa Pharmaceutical Granulation Equipment Market Volume (K Unit) Forecast, by Application 2019 & 2032
- Table 129: Rest of Middle East and Africa Pharmaceutical Granulation Equipment Market Revenue (Million) Forecast, by Application 2019 & 2032
- Table 130: Rest of Middle East and Africa Pharmaceutical Granulation Equipment Market Volume (K Unit) Forecast, by Application 2019 & 2032
- Table 131: Global Pharmaceutical Granulation Equipment Market Revenue Million Forecast, by Type 2019 & 2032
- Table 132: Global Pharmaceutical Granulation Equipment Market Volume K Unit Forecast, by Type 2019 & 2032
- Table 133: Global Pharmaceutical Granulation Equipment Market Revenue Million Forecast, by Mechanism 2019 & 2032
- Table 134: Global Pharmaceutical Granulation Equipment Market Volume K Unit Forecast, by Mechanism 2019 & 2032
- Table 135: Global Pharmaceutical Granulation Equipment Market Revenue Million Forecast, by End User 2019 & 2032
- Table 136: Global Pharmaceutical Granulation Equipment Market Volume K Unit Forecast, by End User 2019 & 2032
- Table 137: Global Pharmaceutical Granulation Equipment Market Revenue Million Forecast, by Country 2019 & 2032
- Table 138: Global Pharmaceutical Granulation Equipment Market Volume K Unit Forecast, by Country 2019 & 2032
- Table 139: Brazil Pharmaceutical Granulation Equipment Market Revenue (Million) Forecast, by Application 2019 & 2032
- Table 140: Brazil Pharmaceutical Granulation Equipment Market Volume (K Unit) Forecast, by Application 2019 & 2032
- Table 141: Argentina Pharmaceutical Granulation Equipment Market Revenue (Million) Forecast, by Application 2019 & 2032
- Table 142: Argentina Pharmaceutical Granulation Equipment Market Volume (K Unit) Forecast, by Application 2019 & 2032
- Table 143: Rest of South America Pharmaceutical Granulation Equipment Market Revenue (Million) Forecast, by Application 2019 & 2032
- Table 144: Rest of South America Pharmaceutical Granulation Equipment Market Volume (K Unit) Forecast, by Application 2019 & 2032
Frequently Asked Questions
1. What is the projected Compound Annual Growth Rate (CAGR) of the Pharmaceutical Granulation Equipment Market?
The projected CAGR is approximately 5.50%.
2. Which companies are prominent players in the Pharmaceutical Granulation Equipment Market?
Key companies in the market include Fluid Air (Spraying Systems Co ), Alexanderwerk, LFA Machines Oxford LTD, L B Bohle Maschinen und Verfahren GmbH, Romaco Group, I M A INDUSTRIA MACCHINE AUTOMATICHE S P A, Syntegon Technology GmbH, GEA Group, HOSOKAWA MICRON B V, Anchor Mark Pvt Ltd, PTK-GB Limited.
3. What are the main segments of the Pharmaceutical Granulation Equipment Market?
The market segments include Type, Mechanism, End User.
4. Can you provide details about the market size?
The market size is estimated to be USD XX Million as of 2022.
5. What are some drivers contributing to market growth?
Increasing Number of Research Laboratories; Growing Healthcare R&D Expenditure.
6. What are the notable trends driving market growth?
Pharmaceutical Manufacturing Companies Segment is Expected to Hold a Significant Market Share Over the Forecast Period.
7. Are there any restraints impacting market growth?
High Cost of Equipment.
8. Can you provide examples of recent developments in the market?
April 2023: Gerteis is expected to exhibit its advanced dry granulation roller compaction at the COPHEX pharmaceutical and cosmetic trade show in Seoul, South Korea.
9. What pricing options are available for accessing the report?
Pricing options include single-user, multi-user, and enterprise licenses priced at USD 4750, USD 5250, and USD 8750 respectively.
10. Is the market size provided in terms of value or volume?
The market size is provided in terms of value, measured in Million and volume, measured in K Unit.
11. Are there any specific market keywords associated with the report?
Yes, the market keyword associated with the report is "Pharmaceutical Granulation Equipment Market," which aids in identifying and referencing the specific market segment covered.
12. How do I determine which pricing option suits my needs best?
The pricing options vary based on user requirements and access needs. Individual users may opt for single-user licenses, while businesses requiring broader access may choose multi-user or enterprise licenses for cost-effective access to the report.
13. Are there any additional resources or data provided in the Pharmaceutical Granulation Equipment Market report?
While the report offers comprehensive insights, it's advisable to review the specific contents or supplementary materials provided to ascertain if additional resources or data are available.
14. How can I stay updated on further developments or reports in the Pharmaceutical Granulation Equipment Market?
To stay informed about further developments, trends, and reports in the Pharmaceutical Granulation Equipment Market, consider subscribing to industry newsletters, following relevant companies and organizations, or regularly checking reputable industry news sources and publications.
Methodology
Step 1 - Identification of Relevant Samples Size from Population Database


Step 2 - Approaches for Defining Global Market Size (Value, Volume* & Price*)

Note*: In applicable scenarios
Step 3 - Data Sources
Primary Research
- Web Analytics
- Survey Reports
- Research Institute
- Latest Research Reports
- Opinion Leaders
Secondary Research
- Annual Reports
- White Paper
- Latest Press Release
- Industry Association
- Paid Database
- Investor Presentations

Step 4 - Data Triangulation
Involves using different sources of information in order to increase the validity of a study
These sources are likely to be stakeholders in a program - participants, other researchers, program staff, other community members, and so on.
Then we put all data in single framework & apply various statistical tools to find out the dynamic on the market.
During the analysis stage, feedback from the stakeholder groups would be compared to determine areas of agreement as well as areas of divergence


