
Key Insights
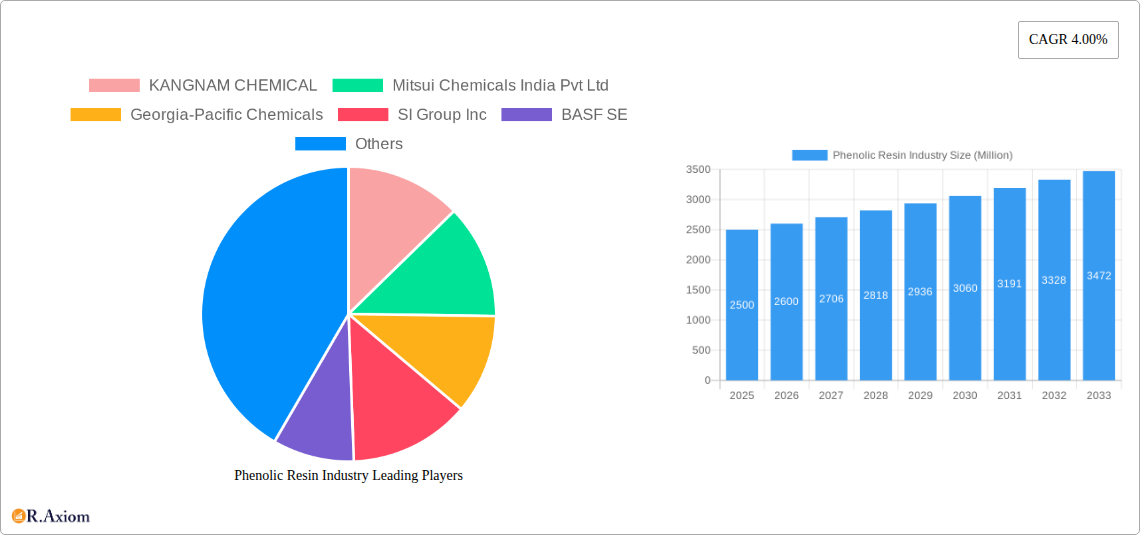
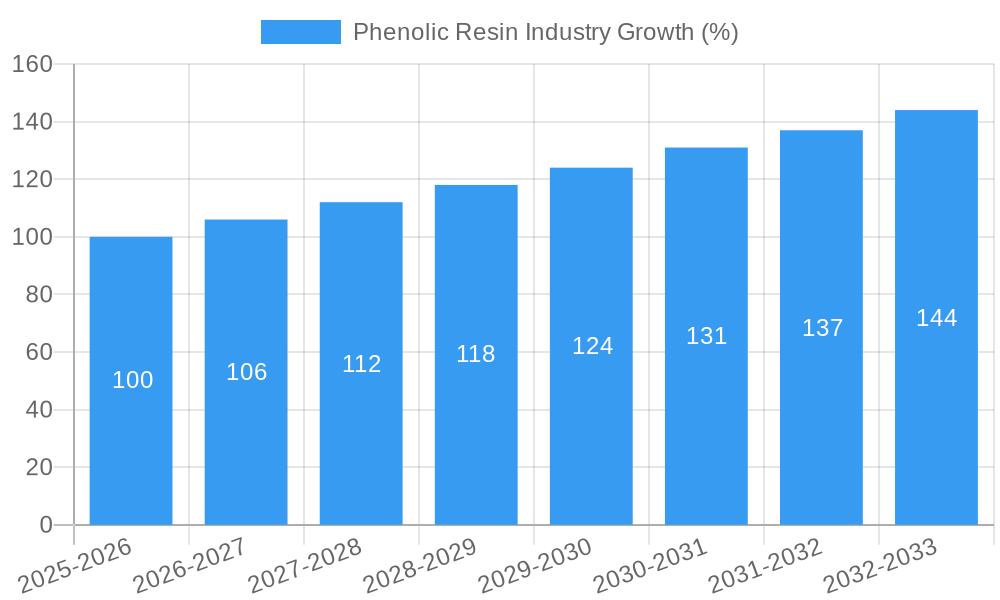
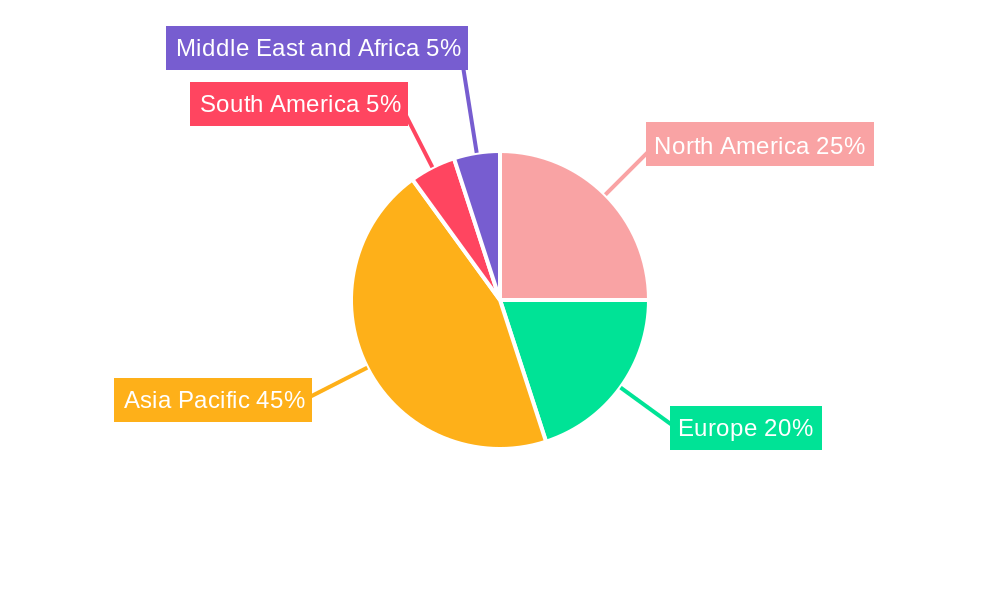
The global phenolic resin market, valued at approximately $XX million in 2025, is projected to experience steady growth with a compound annual growth rate (CAGR) of 4.00% from 2025 to 2033. This growth is driven by the increasing demand for phenolic resins across various end-use industries, particularly automotive and transportation, building and construction, and consumer electronics. The automotive sector's reliance on phenolic resins for lightweighting components and improved fuel efficiency is a significant factor. Furthermore, the construction industry's demand for durable and cost-effective insulation materials fuels market expansion. The rising popularity of sustainable and eco-friendly materials is also influencing the market, leading to innovation in resin formulations and processing techniques. However, the market faces challenges from fluctuating raw material prices and the emergence of alternative materials. The market is segmented by product type (novolac, resol), application (molding, adhesive, insulation, others), and end-user industry, providing a nuanced view of market dynamics. Leading players, including BASF SE, Mitsui Chemicals, and others, are investing in research and development to enhance product performance and expand applications, fostering further market growth. Regional variations exist, with Asia Pacific, particularly China and India, expected to dominate market share due to robust industrial growth and increasing infrastructure development.
The market segmentation highlights specific opportunities and challenges within each segment. The novolac segment, often preferred for its high-performance characteristics, is expected to witness higher growth compared to the resol segment. Within applications, the molding and adhesive segments maintain significant market share, but growth is also observed in insulation and other applications, driven by innovation and diversification in material applications. North America and Europe are expected to maintain their position as established markets, while emerging economies in Asia Pacific and other regions are likely to exhibit higher growth rates, offering considerable future market potential. Competition within the industry is intense, with established players facing competition from regional manufacturers, leading to price pressures and a drive for innovation. Overall, the global phenolic resin market presents a stable growth trajectory driven by diverse application demands and ongoing technological developments, though it remains sensitive to raw material fluctuations and evolving industry trends.
Phenolic Resin Industry: A Comprehensive Market Report (2019-2033)
This in-depth report provides a comprehensive analysis of the global Phenolic Resin industry, covering market size, segmentation, growth drivers, challenges, and key players. The report utilizes data from the historical period (2019-2024), base year (2025), and estimated year (2025) to forecast market trends through 2033. The study period spans 2019-2033, offering a robust understanding of past performance and future potential. This report is essential for industry stakeholders, investors, and researchers seeking actionable insights into this dynamic market.
Phenolic Resin Industry Market Concentration & Innovation
The global phenolic resin market exhibits a moderately concentrated structure, with several major players holding significant market share. While precise market share figures for each company are proprietary, KANGNAM CHEMICAL, Mitsui Chemicals India Pvt Ltd, Georgia-Pacific Chemicals, SI Group Inc, BASF SE, SHANDONG LAIWU RUNDA NEW MATERIAL CO LTD, Hexcel Corporation, DIC CORPORATION, Prefere Resins Holding GmbH, Changshu South-East Plastic Co Ltd, Sumitomo Bakelite Co Ltd, and Kolon Industries Inc are some of the key players. The market's competitive landscape is influenced by factors such as product innovation, pricing strategies, and geographical reach.
- Innovation Drivers: Sustainability concerns are driving innovation towards bio-based phenolic resins and improved recycling capabilities. Technological advancements focus on enhancing resin properties like heat resistance and chemical stability for diverse applications.
- Regulatory Framework: Environmental regulations regarding volatile organic compounds (VOCs) and sustainability certifications (like ISCC PLUS) are influencing manufacturing processes and product formulations.
- Product Substitutes: Competition exists from alternative materials like epoxy resins and polyurethane, depending on the specific application.
- End-User Trends: Growth in automotive, construction, and electronics sectors fuels demand, while shifts in consumer preferences towards sustainable products are impacting market trends.
- M&A Activities: Recent mergers and acquisitions, such as ASK Chemicals' acquisition of SI Group's industrial resins business in November 2022, indicate consolidation and strategic expansion within the industry. While precise deal values are often confidential, such transactions significantly reshape market dynamics and competitive landscapes.
Phenolic Resin Industry Industry Trends & Insights
The global phenolic resin market is expected to witness a robust Compound Annual Growth Rate (CAGR) of xx% during the forecast period (2025-2033). Several factors contribute to this growth. Increasing demand from the automotive and construction sectors, driven by infrastructure development and urbanization, significantly contributes to market expansion. The rising adoption of phenolic resins in high-performance applications, such as electronics and aerospace, further boosts market growth. Market penetration of phenolic resins in niche applications like wind energy is steadily increasing. However, fluctuations in raw material prices and the emergence of substitute materials pose challenges. Technological disruptions in resin manufacturing processes, such as the development of more sustainable and efficient production methods, are influencing industry competitiveness. Consumer preferences are increasingly shifting towards eco-friendly products, prompting manufacturers to develop sustainable and bio-based phenolic resins. This trend is creating new opportunities for innovative players with sustainable production capabilities. Competitive dynamics are characterized by ongoing innovation, cost optimization strategies, and strategic partnerships.
Dominant Markets & Segments in Phenolic Resin Industry
The Asian region, particularly China and India, dominates the global phenolic resin market, driven by rapid industrialization and infrastructure development. Within product types, resol resins hold a larger market share compared to novolac resins due to their versatility and suitability in various applications. The molding application segment commands a significant market share across various end-user industries due to the high demand for molded components in automotive, electronics, and construction.
Key Drivers for Asia's Dominance:
- Rapid economic growth and industrialization
- Significant investments in infrastructure projects
- Growing automotive and electronics sectors
- Favorable government policies promoting manufacturing
Dominant Segments:
- Product Type: Resol resins hold a larger market share due to their broader applications.
- Application: Molding applications dominate owing to high demand in various end-user industries.
- End-user Industry: The automotive and transportation sector is a key driver of growth, followed by the building and construction sector.
Phenolic Resin Industry Product Developments
Recent product innovations focus on enhancing the performance characteristics of phenolic resins, such as improving heat resistance, chemical stability, and flame retardancy. New applications are emerging in areas like advanced composites and specialized adhesives. The competitive advantage lies in developing sustainable, high-performance resins that meet evolving industry standards and consumer demands for eco-friendly materials. Technological trends emphasize the development of bio-based resins and the integration of advanced manufacturing processes to enhance efficiency and reduce environmental impact. These advancements are driving market fit by providing solutions that address sustainability concerns and performance requirements.
Report Scope & Segmentation Analysis
This report provides a detailed segmentation analysis of the phenolic resin market across various parameters:
- Product Type: Novolac and Resol, with growth projections and market size for each segment. The competitive dynamics vary depending on the specific type, with certain companies specializing in either Novolac or Resol.
- Application: Molding, Adhesive, Insulation, and Other Applications. Each application segment exhibits different growth rates and competitive landscapes. For example, the molding application is expected to maintain robust growth, driven by automotive and electronics demands.
- End-user Industry: Automotive and Transportation, Consumer Electronics, Building and Construction, Oil and Gas, Furniture, and Other End-user Industries. Each end-user sector shows specific growth trends and demands, influencing overall market dynamics. For instance, the automotive industry's drive for lightweight materials is fueling demand for high-performance phenolic resins.
Key Drivers of Phenolic Resin Industry Growth
The phenolic resin market is propelled by several factors:
- Technological advancements: Innovation in resin formulations, leading to improved properties like heat resistance and flame retardancy.
- Economic growth: Expansion of key end-user industries such as automotive, construction, and electronics.
- Favorable government policies: Support for infrastructure development and sustainable manufacturing practices.
- Rising demand for sustainable materials: Increasing adoption of bio-based and recycled phenolic resins.
Challenges in the Phenolic Resin Industry Sector
The industry faces significant challenges:
- Fluctuating raw material prices: Impacting production costs and profitability.
- Stringent environmental regulations: Requiring companies to adopt sustainable manufacturing practices.
- Competition from substitute materials: Epoxy resins and other alternatives pose competitive pressure.
- Supply chain disruptions: Global events can impact the availability of raw materials and the production process. These disruptions can lead to production delays and increased costs, potentially impacting market share. The estimated impact of these disruptions is valued at xx Million annually.
Emerging Opportunities in Phenolic Resin Industry
Emerging opportunities include:
- Growth in renewable energy sectors: Demand for phenolic resins in wind turbine components and solar panels.
- Development of high-performance composites: Utilizing phenolic resins in aerospace and defense applications.
- Expansion in emerging markets: Untapped potential in developing economies with growing industrial sectors.
- Focus on sustainability: Opportunities for manufacturers who develop eco-friendly and bio-based phenolic resins.
Leading Players in the Phenolic Resin Industry Market
- KANGNAM CHEMICAL
- Mitsui Chemicals India Pvt Ltd
- Georgia-Pacific Chemicals
- SI Group Inc
- BASF SE
- SHANDONG LAIWU RUNDA NEW MATERIAL CO LTD
- Hexcel Corporation
- DIC CORPORATION
- Prefere Resins Holding GmbH
- Changshu South-East Plastic Co Ltd
- Sumitomo Bakelite Co Ltd
- Kolon Industries Inc
Key Developments in Phenolic Resin Industry Industry
- November 2022: ASK Chemicals Group acquired the industrial resins business of SI Group, expanding its presence in the foundry market and establishing a phenolic industrial resin business.
- December 2022: Sumitomo Bakelite Europe NV secured ISCC PLUS certification for its phenolic resins, highlighting its commitment to sustainability.
- January 2023: BASF SE invested in expanding polymer dispersions capacity in Indonesia, catering to the growing high-quality packaging demand in ASEAN.
Strategic Outlook for Phenolic Resin Industry Market
The phenolic resin market is poised for continued growth, driven by technological advancements, expanding end-user industries, and increasing demand for sustainable materials. Opportunities exist in developing innovative resin formulations, expanding into emerging markets, and focusing on sustainable manufacturing practices. Companies that successfully integrate sustainability initiatives and embrace technological advancements are likely to gain a competitive edge in the long term. The market's future potential is significant, particularly in applications requiring high-performance and environmentally friendly materials.
Phenolic Resin Industry Segmentation
-
1. Product Type
- 1.1. Novolac
- 1.2. Resol
-
2. Application
- 2.1. Molding
- 2.2. Adhesive
- 2.3. Insulation
- 2.4. Other Applications
-
3. End-user Industry
- 3.1. Automotive and Transportation
- 3.2. Consumer Electronics
- 3.3. Building and Construction
- 3.4. Oil and Gas
- 3.5. Furniture
- 3.6. Other End-user Industries
Phenolic Resin Industry Segmentation By Geography
-
1. Asia Pacific
- 1.1. China
- 1.2. India
- 1.3. Japan
- 1.4. South Korea
- 1.5. Rest of Asia Pacific
-
2. North America
- 2.1. United States
- 2.2. Canada
- 2.3. Mexico
-
3. Europe
- 3.1. Germany
- 3.2. United Kingdom
- 3.3. France
- 3.4. Italy
- 3.5. Rest of Europe
-
4. South America
- 4.1. Brazil
- 4.2. Argentina
- 4.3. Rest of South America
-
5. Middle East and Africa
- 5.1. Saudi Arabia
- 5.2. South Africa
- 5.3. Rest of Middle East and Africa
Phenolic Resin Industry REPORT HIGHLIGHTS
| Aspects | Details |
|---|---|
| Study Period | 2019-2033 |
| Base Year | 2024 |
| Estimated Year | 2025 |
| Forecast Period | 2025-2033 |
| Historical Period | 2019-2024 |
| Growth Rate | CAGR of 4.00% from 2019-2033 |
| Segmentation |
|
Table of Contents
- 1. Introduction
- 1.1. Research Scope
- 1.2. Market Segmentation
- 1.3. Research Methodology
- 1.4. Definitions and Assumptions
- 2. Executive Summary
- 2.1. Introduction
- 3. Market Dynamics
- 3.1. Introduction
- 3.2. Market Drivers
- 3.2.1. Increasing Demand from the Construction and Transportation Industries; Other Drivers
- 3.3. Market Restrains
- 3.3.1. Unfavorable Conditions Arising Due to the COVID-19 Outbreak; Other Restraints
- 3.4. Market Trends
- 3.4.1. Increasing Demand for Molding Applications is Driving the Phenolic Resin Market
- 4. Market Factor Analysis
- 4.1. Porters Five Forces
- 4.2. Supply/Value Chain
- 4.3. PESTEL analysis
- 4.4. Market Entropy
- 4.5. Patent/Trademark Analysis
- 5. Global Phenolic Resin Industry Analysis, Insights and Forecast, 2019-2031
- 5.1. Market Analysis, Insights and Forecast - by Product Type
- 5.1.1. Novolac
- 5.1.2. Resol
- 5.2. Market Analysis, Insights and Forecast - by Application
- 5.2.1. Molding
- 5.2.2. Adhesive
- 5.2.3. Insulation
- 5.2.4. Other Applications
- 5.3. Market Analysis, Insights and Forecast - by End-user Industry
- 5.3.1. Automotive and Transportation
- 5.3.2. Consumer Electronics
- 5.3.3. Building and Construction
- 5.3.4. Oil and Gas
- 5.3.5. Furniture
- 5.3.6. Other End-user Industries
- 5.4. Market Analysis, Insights and Forecast - by Region
- 5.4.1. Asia Pacific
- 5.4.2. North America
- 5.4.3. Europe
- 5.4.4. South America
- 5.4.5. Middle East and Africa
- 5.1. Market Analysis, Insights and Forecast - by Product Type
- 6. Asia Pacific Phenolic Resin Industry Analysis, Insights and Forecast, 2019-2031
- 6.1. Market Analysis, Insights and Forecast - by Product Type
- 6.1.1. Novolac
- 6.1.2. Resol
- 6.2. Market Analysis, Insights and Forecast - by Application
- 6.2.1. Molding
- 6.2.2. Adhesive
- 6.2.3. Insulation
- 6.2.4. Other Applications
- 6.3. Market Analysis, Insights and Forecast - by End-user Industry
- 6.3.1. Automotive and Transportation
- 6.3.2. Consumer Electronics
- 6.3.3. Building and Construction
- 6.3.4. Oil and Gas
- 6.3.5. Furniture
- 6.3.6. Other End-user Industries
- 6.1. Market Analysis, Insights and Forecast - by Product Type
- 7. North America Phenolic Resin Industry Analysis, Insights and Forecast, 2019-2031
- 7.1. Market Analysis, Insights and Forecast - by Product Type
- 7.1.1. Novolac
- 7.1.2. Resol
- 7.2. Market Analysis, Insights and Forecast - by Application
- 7.2.1. Molding
- 7.2.2. Adhesive
- 7.2.3. Insulation
- 7.2.4. Other Applications
- 7.3. Market Analysis, Insights and Forecast - by End-user Industry
- 7.3.1. Automotive and Transportation
- 7.3.2. Consumer Electronics
- 7.3.3. Building and Construction
- 7.3.4. Oil and Gas
- 7.3.5. Furniture
- 7.3.6. Other End-user Industries
- 7.1. Market Analysis, Insights and Forecast - by Product Type
- 8. Europe Phenolic Resin Industry Analysis, Insights and Forecast, 2019-2031
- 8.1. Market Analysis, Insights and Forecast - by Product Type
- 8.1.1. Novolac
- 8.1.2. Resol
- 8.2. Market Analysis, Insights and Forecast - by Application
- 8.2.1. Molding
- 8.2.2. Adhesive
- 8.2.3. Insulation
- 8.2.4. Other Applications
- 8.3. Market Analysis, Insights and Forecast - by End-user Industry
- 8.3.1. Automotive and Transportation
- 8.3.2. Consumer Electronics
- 8.3.3. Building and Construction
- 8.3.4. Oil and Gas
- 8.3.5. Furniture
- 8.3.6. Other End-user Industries
- 8.1. Market Analysis, Insights and Forecast - by Product Type
- 9. South America Phenolic Resin Industry Analysis, Insights and Forecast, 2019-2031
- 9.1. Market Analysis, Insights and Forecast - by Product Type
- 9.1.1. Novolac
- 9.1.2. Resol
- 9.2. Market Analysis, Insights and Forecast - by Application
- 9.2.1. Molding
- 9.2.2. Adhesive
- 9.2.3. Insulation
- 9.2.4. Other Applications
- 9.3. Market Analysis, Insights and Forecast - by End-user Industry
- 9.3.1. Automotive and Transportation
- 9.3.2. Consumer Electronics
- 9.3.3. Building and Construction
- 9.3.4. Oil and Gas
- 9.3.5. Furniture
- 9.3.6. Other End-user Industries
- 9.1. Market Analysis, Insights and Forecast - by Product Type
- 10. Middle East and Africa Phenolic Resin Industry Analysis, Insights and Forecast, 2019-2031
- 10.1. Market Analysis, Insights and Forecast - by Product Type
- 10.1.1. Novolac
- 10.1.2. Resol
- 10.2. Market Analysis, Insights and Forecast - by Application
- 10.2.1. Molding
- 10.2.2. Adhesive
- 10.2.3. Insulation
- 10.2.4. Other Applications
- 10.3. Market Analysis, Insights and Forecast - by End-user Industry
- 10.3.1. Automotive and Transportation
- 10.3.2. Consumer Electronics
- 10.3.3. Building and Construction
- 10.3.4. Oil and Gas
- 10.3.5. Furniture
- 10.3.6. Other End-user Industries
- 10.1. Market Analysis, Insights and Forecast - by Product Type
- 11. Asia Pacific Phenolic Resin Industry Analysis, Insights and Forecast, 2019-2031
- 11.1. Market Analysis, Insights and Forecast - By Country/Sub-region
- 11.1.1 China
- 11.1.2 India
- 11.1.3 Japan
- 11.1.4 South Korea
- 11.1.5 Rest of Asia Pacific
- 12. North America Phenolic Resin Industry Analysis, Insights and Forecast, 2019-2031
- 12.1. Market Analysis, Insights and Forecast - By Country/Sub-region
- 12.1.1 United States
- 12.1.2 Canada
- 12.1.3 Mexico
- 13. Europe Phenolic Resin Industry Analysis, Insights and Forecast, 2019-2031
- 13.1. Market Analysis, Insights and Forecast - By Country/Sub-region
- 13.1.1 Germany
- 13.1.2 United Kingdom
- 13.1.3 France
- 13.1.4 Italy
- 13.1.5 Rest of Europe
- 14. South America Phenolic Resin Industry Analysis, Insights and Forecast, 2019-2031
- 14.1. Market Analysis, Insights and Forecast - By Country/Sub-region
- 14.1.1 Brazil
- 14.1.2 Argentina
- 14.1.3 Rest of South America
- 15. Middle East and Africa Phenolic Resin Industry Analysis, Insights and Forecast, 2019-2031
- 15.1. Market Analysis, Insights and Forecast - By Country/Sub-region
- 15.1.1 Saudi Arabia
- 15.1.2 South Africa
- 15.1.3 Rest of Middle East and Africa
- 16. Competitive Analysis
- 16.1. Global Market Share Analysis 2024
- 16.2. Company Profiles
- 16.2.1 KANGNAM CHEMICAL
- 16.2.1.1. Overview
- 16.2.1.2. Products
- 16.2.1.3. SWOT Analysis
- 16.2.1.4. Recent Developments
- 16.2.1.5. Financials (Based on Availability)
- 16.2.2 Mitsui Chemicals India Pvt Ltd
- 16.2.2.1. Overview
- 16.2.2.2. Products
- 16.2.2.3. SWOT Analysis
- 16.2.2.4. Recent Developments
- 16.2.2.5. Financials (Based on Availability)
- 16.2.3 Georgia-Pacific Chemicals
- 16.2.3.1. Overview
- 16.2.3.2. Products
- 16.2.3.3. SWOT Analysis
- 16.2.3.4. Recent Developments
- 16.2.3.5. Financials (Based on Availability)
- 16.2.4 SI Group Inc
- 16.2.4.1. Overview
- 16.2.4.2. Products
- 16.2.4.3. SWOT Analysis
- 16.2.4.4. Recent Developments
- 16.2.4.5. Financials (Based on Availability)
- 16.2.5 BASF SE
- 16.2.5.1. Overview
- 16.2.5.2. Products
- 16.2.5.3. SWOT Analysis
- 16.2.5.4. Recent Developments
- 16.2.5.5. Financials (Based on Availability)
- 16.2.6 SHANDONG LAIWU RUNDA NEW MATERIAL CO LTD
- 16.2.6.1. Overview
- 16.2.6.2. Products
- 16.2.6.3. SWOT Analysis
- 16.2.6.4. Recent Developments
- 16.2.6.5. Financials (Based on Availability)
- 16.2.7 Hexcel Corporation
- 16.2.7.1. Overview
- 16.2.7.2. Products
- 16.2.7.3. SWOT Analysis
- 16.2.7.4. Recent Developments
- 16.2.7.5. Financials (Based on Availability)
- 16.2.8 DIC CORPORATION
- 16.2.8.1. Overview
- 16.2.8.2. Products
- 16.2.8.3. SWOT Analysis
- 16.2.8.4. Recent Developments
- 16.2.8.5. Financials (Based on Availability)
- 16.2.9 Prefere Resins Holding GmbH
- 16.2.9.1. Overview
- 16.2.9.2. Products
- 16.2.9.3. SWOT Analysis
- 16.2.9.4. Recent Developments
- 16.2.9.5. Financials (Based on Availability)
- 16.2.10 Changshu South-East Plastic Co Ltd
- 16.2.10.1. Overview
- 16.2.10.2. Products
- 16.2.10.3. SWOT Analysis
- 16.2.10.4. Recent Developments
- 16.2.10.5. Financials (Based on Availability)
- 16.2.11 Sumitomo Bakelite Co Ltd*List Not Exhaustive
- 16.2.11.1. Overview
- 16.2.11.2. Products
- 16.2.11.3. SWOT Analysis
- 16.2.11.4. Recent Developments
- 16.2.11.5. Financials (Based on Availability)
- 16.2.12 Kolon Industries Inc
- 16.2.12.1. Overview
- 16.2.12.2. Products
- 16.2.12.3. SWOT Analysis
- 16.2.12.4. Recent Developments
- 16.2.12.5. Financials (Based on Availability)
- 16.2.1 KANGNAM CHEMICAL
List of Figures
- Figure 1: Global Phenolic Resin Industry Revenue Breakdown (Million, %) by Region 2024 & 2032
- Figure 2: Asia Pacific Phenolic Resin Industry Revenue (Million), by Country 2024 & 2032
- Figure 3: Asia Pacific Phenolic Resin Industry Revenue Share (%), by Country 2024 & 2032
- Figure 4: North America Phenolic Resin Industry Revenue (Million), by Country 2024 & 2032
- Figure 5: North America Phenolic Resin Industry Revenue Share (%), by Country 2024 & 2032
- Figure 6: Europe Phenolic Resin Industry Revenue (Million), by Country 2024 & 2032
- Figure 7: Europe Phenolic Resin Industry Revenue Share (%), by Country 2024 & 2032
- Figure 8: South America Phenolic Resin Industry Revenue (Million), by Country 2024 & 2032
- Figure 9: South America Phenolic Resin Industry Revenue Share (%), by Country 2024 & 2032
- Figure 10: Middle East and Africa Phenolic Resin Industry Revenue (Million), by Country 2024 & 2032
- Figure 11: Middle East and Africa Phenolic Resin Industry Revenue Share (%), by Country 2024 & 2032
- Figure 12: Asia Pacific Phenolic Resin Industry Revenue (Million), by Product Type 2024 & 2032
- Figure 13: Asia Pacific Phenolic Resin Industry Revenue Share (%), by Product Type 2024 & 2032
- Figure 14: Asia Pacific Phenolic Resin Industry Revenue (Million), by Application 2024 & 2032
- Figure 15: Asia Pacific Phenolic Resin Industry Revenue Share (%), by Application 2024 & 2032
- Figure 16: Asia Pacific Phenolic Resin Industry Revenue (Million), by End-user Industry 2024 & 2032
- Figure 17: Asia Pacific Phenolic Resin Industry Revenue Share (%), by End-user Industry 2024 & 2032
- Figure 18: Asia Pacific Phenolic Resin Industry Revenue (Million), by Country 2024 & 2032
- Figure 19: Asia Pacific Phenolic Resin Industry Revenue Share (%), by Country 2024 & 2032
- Figure 20: North America Phenolic Resin Industry Revenue (Million), by Product Type 2024 & 2032
- Figure 21: North America Phenolic Resin Industry Revenue Share (%), by Product Type 2024 & 2032
- Figure 22: North America Phenolic Resin Industry Revenue (Million), by Application 2024 & 2032
- Figure 23: North America Phenolic Resin Industry Revenue Share (%), by Application 2024 & 2032
- Figure 24: North America Phenolic Resin Industry Revenue (Million), by End-user Industry 2024 & 2032
- Figure 25: North America Phenolic Resin Industry Revenue Share (%), by End-user Industry 2024 & 2032
- Figure 26: North America Phenolic Resin Industry Revenue (Million), by Country 2024 & 2032
- Figure 27: North America Phenolic Resin Industry Revenue Share (%), by Country 2024 & 2032
- Figure 28: Europe Phenolic Resin Industry Revenue (Million), by Product Type 2024 & 2032
- Figure 29: Europe Phenolic Resin Industry Revenue Share (%), by Product Type 2024 & 2032
- Figure 30: Europe Phenolic Resin Industry Revenue (Million), by Application 2024 & 2032
- Figure 31: Europe Phenolic Resin Industry Revenue Share (%), by Application 2024 & 2032
- Figure 32: Europe Phenolic Resin Industry Revenue (Million), by End-user Industry 2024 & 2032
- Figure 33: Europe Phenolic Resin Industry Revenue Share (%), by End-user Industry 2024 & 2032
- Figure 34: Europe Phenolic Resin Industry Revenue (Million), by Country 2024 & 2032
- Figure 35: Europe Phenolic Resin Industry Revenue Share (%), by Country 2024 & 2032
- Figure 36: South America Phenolic Resin Industry Revenue (Million), by Product Type 2024 & 2032
- Figure 37: South America Phenolic Resin Industry Revenue Share (%), by Product Type 2024 & 2032
- Figure 38: South America Phenolic Resin Industry Revenue (Million), by Application 2024 & 2032
- Figure 39: South America Phenolic Resin Industry Revenue Share (%), by Application 2024 & 2032
- Figure 40: South America Phenolic Resin Industry Revenue (Million), by End-user Industry 2024 & 2032
- Figure 41: South America Phenolic Resin Industry Revenue Share (%), by End-user Industry 2024 & 2032
- Figure 42: South America Phenolic Resin Industry Revenue (Million), by Country 2024 & 2032
- Figure 43: South America Phenolic Resin Industry Revenue Share (%), by Country 2024 & 2032
- Figure 44: Middle East and Africa Phenolic Resin Industry Revenue (Million), by Product Type 2024 & 2032
- Figure 45: Middle East and Africa Phenolic Resin Industry Revenue Share (%), by Product Type 2024 & 2032
- Figure 46: Middle East and Africa Phenolic Resin Industry Revenue (Million), by Application 2024 & 2032
- Figure 47: Middle East and Africa Phenolic Resin Industry Revenue Share (%), by Application 2024 & 2032
- Figure 48: Middle East and Africa Phenolic Resin Industry Revenue (Million), by End-user Industry 2024 & 2032
- Figure 49: Middle East and Africa Phenolic Resin Industry Revenue Share (%), by End-user Industry 2024 & 2032
- Figure 50: Middle East and Africa Phenolic Resin Industry Revenue (Million), by Country 2024 & 2032
- Figure 51: Middle East and Africa Phenolic Resin Industry Revenue Share (%), by Country 2024 & 2032
List of Tables
- Table 1: Global Phenolic Resin Industry Revenue Million Forecast, by Region 2019 & 2032
- Table 2: Global Phenolic Resin Industry Revenue Million Forecast, by Product Type 2019 & 2032
- Table 3: Global Phenolic Resin Industry Revenue Million Forecast, by Application 2019 & 2032
- Table 4: Global Phenolic Resin Industry Revenue Million Forecast, by End-user Industry 2019 & 2032
- Table 5: Global Phenolic Resin Industry Revenue Million Forecast, by Region 2019 & 2032
- Table 6: Global Phenolic Resin Industry Revenue Million Forecast, by Country 2019 & 2032
- Table 7: China Phenolic Resin Industry Revenue (Million) Forecast, by Application 2019 & 2032
- Table 8: India Phenolic Resin Industry Revenue (Million) Forecast, by Application 2019 & 2032
- Table 9: Japan Phenolic Resin Industry Revenue (Million) Forecast, by Application 2019 & 2032
- Table 10: South Korea Phenolic Resin Industry Revenue (Million) Forecast, by Application 2019 & 2032
- Table 11: Rest of Asia Pacific Phenolic Resin Industry Revenue (Million) Forecast, by Application 2019 & 2032
- Table 12: Global Phenolic Resin Industry Revenue Million Forecast, by Country 2019 & 2032
- Table 13: United States Phenolic Resin Industry Revenue (Million) Forecast, by Application 2019 & 2032
- Table 14: Canada Phenolic Resin Industry Revenue (Million) Forecast, by Application 2019 & 2032
- Table 15: Mexico Phenolic Resin Industry Revenue (Million) Forecast, by Application 2019 & 2032
- Table 16: Global Phenolic Resin Industry Revenue Million Forecast, by Country 2019 & 2032
- Table 17: Germany Phenolic Resin Industry Revenue (Million) Forecast, by Application 2019 & 2032
- Table 18: United Kingdom Phenolic Resin Industry Revenue (Million) Forecast, by Application 2019 & 2032
- Table 19: France Phenolic Resin Industry Revenue (Million) Forecast, by Application 2019 & 2032
- Table 20: Italy Phenolic Resin Industry Revenue (Million) Forecast, by Application 2019 & 2032
- Table 21: Rest of Europe Phenolic Resin Industry Revenue (Million) Forecast, by Application 2019 & 2032
- Table 22: Global Phenolic Resin Industry Revenue Million Forecast, by Country 2019 & 2032
- Table 23: Brazil Phenolic Resin Industry Revenue (Million) Forecast, by Application 2019 & 2032
- Table 24: Argentina Phenolic Resin Industry Revenue (Million) Forecast, by Application 2019 & 2032
- Table 25: Rest of South America Phenolic Resin Industry Revenue (Million) Forecast, by Application 2019 & 2032
- Table 26: Global Phenolic Resin Industry Revenue Million Forecast, by Country 2019 & 2032
- Table 27: Saudi Arabia Phenolic Resin Industry Revenue (Million) Forecast, by Application 2019 & 2032
- Table 28: South Africa Phenolic Resin Industry Revenue (Million) Forecast, by Application 2019 & 2032
- Table 29: Rest of Middle East and Africa Phenolic Resin Industry Revenue (Million) Forecast, by Application 2019 & 2032
- Table 30: Global Phenolic Resin Industry Revenue Million Forecast, by Product Type 2019 & 2032
- Table 31: Global Phenolic Resin Industry Revenue Million Forecast, by Application 2019 & 2032
- Table 32: Global Phenolic Resin Industry Revenue Million Forecast, by End-user Industry 2019 & 2032
- Table 33: Global Phenolic Resin Industry Revenue Million Forecast, by Country 2019 & 2032
- Table 34: China Phenolic Resin Industry Revenue (Million) Forecast, by Application 2019 & 2032
- Table 35: India Phenolic Resin Industry Revenue (Million) Forecast, by Application 2019 & 2032
- Table 36: Japan Phenolic Resin Industry Revenue (Million) Forecast, by Application 2019 & 2032
- Table 37: South Korea Phenolic Resin Industry Revenue (Million) Forecast, by Application 2019 & 2032
- Table 38: Rest of Asia Pacific Phenolic Resin Industry Revenue (Million) Forecast, by Application 2019 & 2032
- Table 39: Global Phenolic Resin Industry Revenue Million Forecast, by Product Type 2019 & 2032
- Table 40: Global Phenolic Resin Industry Revenue Million Forecast, by Application 2019 & 2032
- Table 41: Global Phenolic Resin Industry Revenue Million Forecast, by End-user Industry 2019 & 2032
- Table 42: Global Phenolic Resin Industry Revenue Million Forecast, by Country 2019 & 2032
- Table 43: United States Phenolic Resin Industry Revenue (Million) Forecast, by Application 2019 & 2032
- Table 44: Canada Phenolic Resin Industry Revenue (Million) Forecast, by Application 2019 & 2032
- Table 45: Mexico Phenolic Resin Industry Revenue (Million) Forecast, by Application 2019 & 2032
- Table 46: Global Phenolic Resin Industry Revenue Million Forecast, by Product Type 2019 & 2032
- Table 47: Global Phenolic Resin Industry Revenue Million Forecast, by Application 2019 & 2032
- Table 48: Global Phenolic Resin Industry Revenue Million Forecast, by End-user Industry 2019 & 2032
- Table 49: Global Phenolic Resin Industry Revenue Million Forecast, by Country 2019 & 2032
- Table 50: Germany Phenolic Resin Industry Revenue (Million) Forecast, by Application 2019 & 2032
- Table 51: United Kingdom Phenolic Resin Industry Revenue (Million) Forecast, by Application 2019 & 2032
- Table 52: France Phenolic Resin Industry Revenue (Million) Forecast, by Application 2019 & 2032
- Table 53: Italy Phenolic Resin Industry Revenue (Million) Forecast, by Application 2019 & 2032
- Table 54: Rest of Europe Phenolic Resin Industry Revenue (Million) Forecast, by Application 2019 & 2032
- Table 55: Global Phenolic Resin Industry Revenue Million Forecast, by Product Type 2019 & 2032
- Table 56: Global Phenolic Resin Industry Revenue Million Forecast, by Application 2019 & 2032
- Table 57: Global Phenolic Resin Industry Revenue Million Forecast, by End-user Industry 2019 & 2032
- Table 58: Global Phenolic Resin Industry Revenue Million Forecast, by Country 2019 & 2032
- Table 59: Brazil Phenolic Resin Industry Revenue (Million) Forecast, by Application 2019 & 2032
- Table 60: Argentina Phenolic Resin Industry Revenue (Million) Forecast, by Application 2019 & 2032
- Table 61: Rest of South America Phenolic Resin Industry Revenue (Million) Forecast, by Application 2019 & 2032
- Table 62: Global Phenolic Resin Industry Revenue Million Forecast, by Product Type 2019 & 2032
- Table 63: Global Phenolic Resin Industry Revenue Million Forecast, by Application 2019 & 2032
- Table 64: Global Phenolic Resin Industry Revenue Million Forecast, by End-user Industry 2019 & 2032
- Table 65: Global Phenolic Resin Industry Revenue Million Forecast, by Country 2019 & 2032
- Table 66: Saudi Arabia Phenolic Resin Industry Revenue (Million) Forecast, by Application 2019 & 2032
- Table 67: South Africa Phenolic Resin Industry Revenue (Million) Forecast, by Application 2019 & 2032
- Table 68: Rest of Middle East and Africa Phenolic Resin Industry Revenue (Million) Forecast, by Application 2019 & 2032
Frequently Asked Questions
1. What is the projected Compound Annual Growth Rate (CAGR) of the Phenolic Resin Industry?
The projected CAGR is approximately 4.00%.
2. Which companies are prominent players in the Phenolic Resin Industry?
Key companies in the market include KANGNAM CHEMICAL, Mitsui Chemicals India Pvt Ltd, Georgia-Pacific Chemicals, SI Group Inc, BASF SE, SHANDONG LAIWU RUNDA NEW MATERIAL CO LTD, Hexcel Corporation, DIC CORPORATION, Prefere Resins Holding GmbH, Changshu South-East Plastic Co Ltd, Sumitomo Bakelite Co Ltd*List Not Exhaustive, Kolon Industries Inc.
3. What are the main segments of the Phenolic Resin Industry?
The market segments include Product Type, Application, End-user Industry.
4. Can you provide details about the market size?
The market size is estimated to be USD XX Million as of 2022.
5. What are some drivers contributing to market growth?
Increasing Demand from the Construction and Transportation Industries; Other Drivers.
6. What are the notable trends driving market growth?
Increasing Demand for Molding Applications is Driving the Phenolic Resin Market.
7. Are there any restraints impacting market growth?
Unfavorable Conditions Arising Due to the COVID-19 Outbreak; Other Restraints.
8. Can you provide examples of recent developments in the market?
January 2023: BASF SE invested in the capacity expansion of polymer dispersions at its production site in Merak, Indonesia. The expansion is in line with the growing trend of high-quality packaging in ASEAN, where key paper and board manufacturers are located.
9. What pricing options are available for accessing the report?
Pricing options include single-user, multi-user, and enterprise licenses priced at USD 4750, USD 5250, and USD 8750 respectively.
10. Is the market size provided in terms of value or volume?
The market size is provided in terms of value, measured in Million.
11. Are there any specific market keywords associated with the report?
Yes, the market keyword associated with the report is "Phenolic Resin Industry," which aids in identifying and referencing the specific market segment covered.
12. How do I determine which pricing option suits my needs best?
The pricing options vary based on user requirements and access needs. Individual users may opt for single-user licenses, while businesses requiring broader access may choose multi-user or enterprise licenses for cost-effective access to the report.
13. Are there any additional resources or data provided in the Phenolic Resin Industry report?
While the report offers comprehensive insights, it's advisable to review the specific contents or supplementary materials provided to ascertain if additional resources or data are available.
14. How can I stay updated on further developments or reports in the Phenolic Resin Industry?
To stay informed about further developments, trends, and reports in the Phenolic Resin Industry, consider subscribing to industry newsletters, following relevant companies and organizations, or regularly checking reputable industry news sources and publications.
Methodology
Step 1 - Identification of Relevant Samples Size from Population Database


Step 2 - Approaches for Defining Global Market Size (Value, Volume* & Price*)

Note*: In applicable scenarios
Step 3 - Data Sources
Primary Research
- Web Analytics
- Survey Reports
- Research Institute
- Latest Research Reports
- Opinion Leaders
Secondary Research
- Annual Reports
- White Paper
- Latest Press Release
- Industry Association
- Paid Database
- Investor Presentations

Step 4 - Data Triangulation
Involves using different sources of information in order to increase the validity of a study
These sources are likely to be stakeholders in a program - participants, other researchers, program staff, other community members, and so on.
Then we put all data in single framework & apply various statistical tools to find out the dynamic on the market.
During the analysis stage, feedback from the stakeholder groups would be compared to determine areas of agreement as well as areas of divergence


