
Key Insights
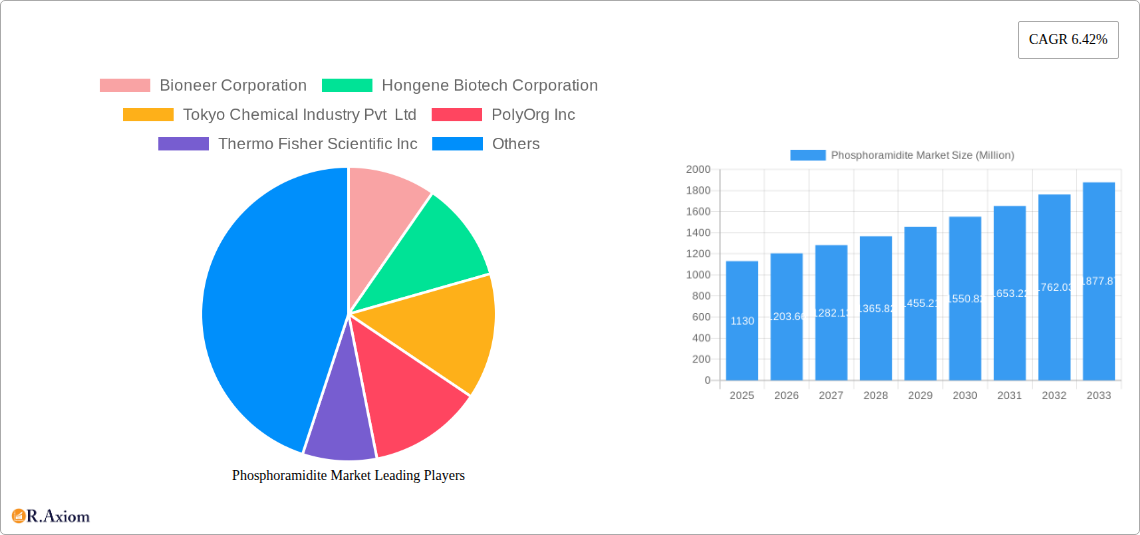
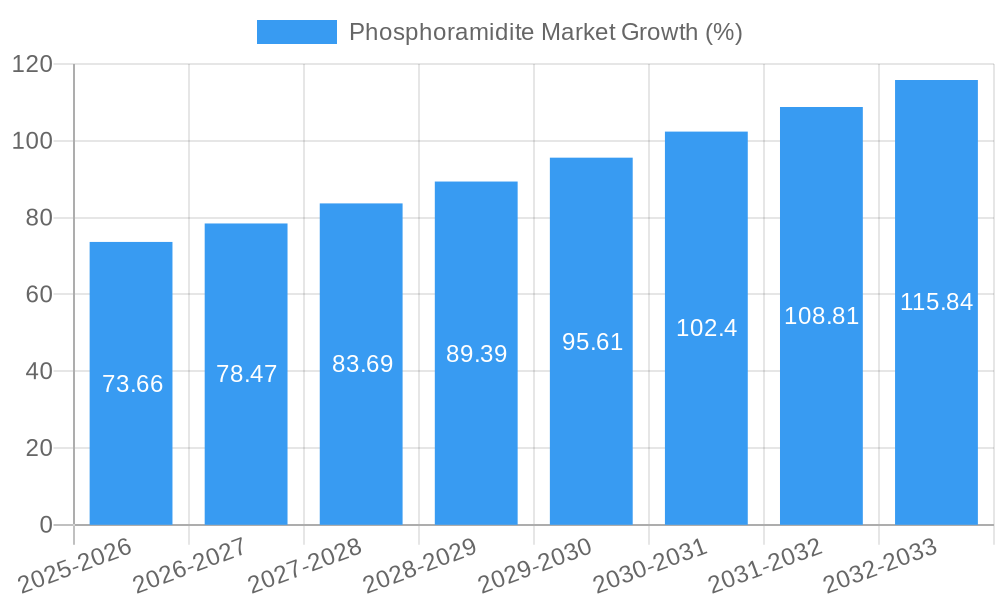
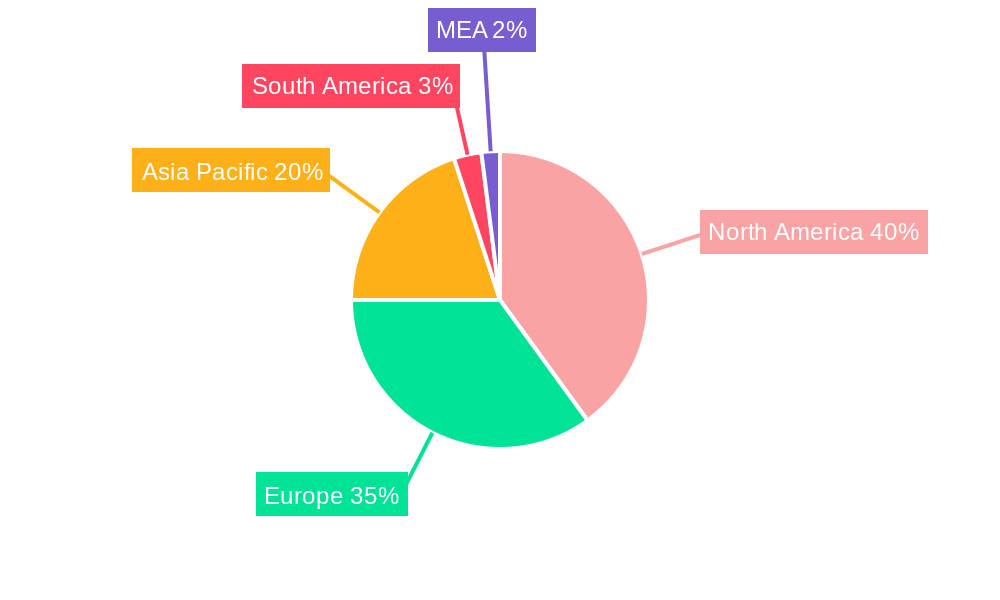
The global phosphoramidite market, valued at $1.13 billion in 2025, is projected to experience robust growth, driven by the increasing demand for oligonucleotide synthesis in pharmaceutical and biotechnology research. A compound annual growth rate (CAGR) of 6.42% from 2025 to 2033 indicates a significant expansion of the market over the forecast period. Key drivers include the rising prevalence of chronic diseases necessitating advanced drug discovery, the growing adoption of next-generation sequencing (NGS) technologies, and the increasing application of phosphoramidites in gene therapy and personalized medicine. The market segmentation reveals a significant contribution from pharmaceutical and biotechnology companies, followed by academic and research institutions. DNA phosphoramidites currently dominate the type segment, although RNA phosphoramidites are experiencing rapid growth due to their importance in RNA interference (RNAi) therapeutics. Geographic analysis suggests North America and Europe currently hold a larger market share due to established research infrastructure and strong pharmaceutical industries; however, the Asia-Pacific region is expected to exhibit significant growth in the coming years fueled by increasing investments in biotechnology and life sciences. Competitive pressures among key players like Thermo Fisher Scientific, Danaher, and QIAGEN are driving innovation and fostering market expansion.
The market's continued expansion is anticipated to be fueled by several factors, including ongoing advancements in oligonucleotide-based therapies, increasing government funding for research and development in biotechnology, and the emergence of novel applications of phosphoramidites in areas like diagnostics and agricultural biotechnology. However, challenges such as stringent regulatory approvals and high manufacturing costs could potentially restrain market growth to some extent. To maintain a competitive edge, companies are investing heavily in research and development to introduce innovative products and improve manufacturing efficiency, focusing on higher purity and customized solutions to cater to the specific needs of various research and therapeutic applications. This competitive landscape and increasing demand across various sectors ensure sustained growth in the phosphoramidite market throughout the forecast period.
This detailed report provides a comprehensive analysis of the Phosphoramidite market, offering actionable insights for stakeholders across the pharmaceutical, biotechnology, and research sectors. The study period covers 2019-2033, with 2025 as the base and estimated year. The report segments the market by end-user (Pharmaceutical and Biotechnology Companies, Academic and Research Institutes, Other End-Users) and by type (DNA Phosphoramidites, RNA Phosphoramidites, Other Phosphoramidites), providing granular market sizing and growth projections. Key players such as Bioneer Corporation, Hongene Biotech Corporation, Tokyo Chemical Industry Pvt Ltd, PolyOrg Inc, Thermo Fisher Scientific Inc, Biosynth Ltd, Lumiprobe Corporation, Danaher Corporation, QIAGEN N V, TriLink BioTechnologies, Creative Biolabs Inc, and BOC Sciences are analyzed for their market positioning and strategic initiatives.
Phosphoramidite Market Market Concentration & Innovation
The Phosphoramidite market exhibits a moderately concentrated landscape, with a few major players holding significant market share. However, the presence of several smaller, specialized companies fosters innovation. Market share data for 2024 indicates that the top 5 players account for approximately xx% of the global market. The high entry barrier associated with stringent regulatory approvals and significant R&D investments contributes to this concentration.
Innovation in the Phosphoramidite market is driven by the increasing demand for customized oligonucleotides for various applications, including gene editing, diagnostics, and therapeutics. Continuous advancements in solid-phase synthesis technologies are leading to higher yields, improved purity, and reduced production costs. Stringent regulatory frameworks, particularly regarding the purity and safety of phosphoramidites used in pharmaceutical applications, necessitate substantial investments in quality control and compliance. The emergence of novel phosphoramidite analogs with improved properties further fuels innovation. M&A activity in the sector, although not frequent, has yielded notable deals with estimated values ranging from xx Million to xx Million in recent years. These deals primarily focus on expanding product portfolios and geographical reach.
Phosphoramidite Market Industry Trends & Insights
The Phosphoramidite market is experiencing robust growth, driven by the expanding applications of oligonucleotides in diverse fields. The increasing prevalence of chronic diseases and the growing demand for personalized medicine are major growth drivers. Technological advancements, such as next-generation sequencing and CRISPR-Cas9 gene editing, are significantly boosting market demand. The market is witnessing a shift towards automation and high-throughput synthesis methods to meet the rising demand for large-scale oligonucleotide production. Consumer preference is moving towards high-purity, custom-designed phosphoramidites with specific modifications to optimize performance in target applications. The market is expected to witness a CAGR of xx% during the forecast period (2025-2033), with market penetration in emerging economies expected to increase significantly. Intense competition among established players and the emergence of new entrants are shaping the competitive landscape, demanding continuous innovation and cost optimization strategies.
Dominant Markets & Segments in Phosphoramidite Market
The North American region currently dominates the Phosphoramidite market, owing to the high concentration of pharmaceutical and biotechnology companies, robust research infrastructure, and favorable regulatory environment. Within this region, the United States holds the largest market share.
By End-User: Pharmaceutical and biotechnology companies constitute the largest segment, driven by the increasing use of oligonucleotides in drug discovery and development. Academic and research institutes form a significant segment, fueled by the growing need for research reagents and customized oligonucleotides for academic research.
By Type: DNA phosphoramidites currently hold the largest market share, driven by their widespread use in various applications. However, the RNA phosphoramidite segment is experiencing rapid growth due to the increasing demand for RNA-based therapeutics and diagnostics. The significant growth of the RNA segment stems from several factors, including the advancement of RNA-based therapeutics, increasing research activities focusing on RNA interference (RNAi), and the development of novel RNA technologies like mRNA vaccines.
Key drivers for regional dominance include:
- Robust funding for research and development: Significant government and private investments in biotechnology and pharmaceutical research drive demand for high-quality reagents like phosphoramidites.
- Presence of major pharmaceutical and biotechnology companies: The concentration of large companies in North America fuels the demand for these products.
- Well-established regulatory framework: Clear guidelines and streamlined regulatory processes facilitate the development and commercialization of oligonucleotide-based products.
The European region is also a significant market, followed by the Asia-Pacific region, which is experiencing rapid growth driven by increasing research activities and government initiatives promoting healthcare and biotechnology.
Phosphoramidite Market Product Developments
Recent innovations include the development of novel phosphoramidite analogs with improved properties, such as increased stability, enhanced coupling efficiency, and reduced side reactions. These advancements address the limitations of traditional phosphoramidites, leading to improved oligonucleotide synthesis and enhanced product quality. The market is witnessing an increasing focus on the development of customized phosphoramidites tailored for specific applications, providing researchers with greater flexibility and control over oligonucleotide synthesis. This trend is driven by the growing need for specialized oligonucleotides in advanced research areas such as gene editing and next-generation sequencing.
Report Scope & Segmentation Analysis
This report comprehensively segments the Phosphoramidite market by end-user and type.
By End-User:
Pharmaceutical and Biotechnology Companies: This segment is projected to experience significant growth due to increasing investments in oligonucleotide-based therapies and diagnostics. The market size for this segment is estimated to be xx Million in 2025 and is expected to reach xx Million by 2033. Competitive dynamics are characterized by intense competition among established players.
Academic and Research Institutes: This segment exhibits steady growth driven by the ongoing research activities related to oligonucleotide synthesis and applications. The market size for this segment is estimated to be xx Million in 2025 and is expected to reach xx Million by 2033. Competition in this segment is characterized by a diverse range of suppliers.
Other End-Users: This segment comprises various industries using phosphoramidites for diverse applications. The market size for this segment is estimated to be xx Million in 2025 and is expected to reach xx Million by 2033.
By Type:
DNA Phosphoramidites: This segment holds the largest market share and is expected to maintain its dominance due to the widespread use of DNA oligonucleotides in various applications.
RNA Phosphoramidites: This segment is experiencing the fastest growth owing to the increasing demand for RNA-based therapeutics and diagnostics.
Other Phosphoramidites: This segment encompasses modified phosphoramidites and specialized analogs.
Key Drivers of Phosphoramidite Market Growth
The Phosphoramidite market growth is primarily fueled by several key factors. Firstly, the rapid expansion of the biotechnology and pharmaceutical industries, alongside increasing research and development spending, is a significant driver. Secondly, the growing prevalence of chronic diseases globally necessitates advancements in diagnostic tools and therapeutic interventions, increasing demand for phosphoramidites. Thirdly, the development and adoption of next-generation sequencing (NGS) and gene editing technologies further accelerates the demand for high-quality, customized oligonucleotides. Finally, supportive government initiatives and policies encouraging innovation in biotechnology and pharmaceutical sectors further bolster market growth.
Challenges in the Phosphoramidite Market Sector
The Phosphoramidite market faces several challenges. The stringent regulatory landscape for pharmaceutical applications necessitates extensive quality control and compliance measures, increasing production costs. Supply chain disruptions, especially in the procurement of raw materials, can impact production capacity and timelines. Intense competition from established players and emerging competitors demands continuous innovation and cost optimization. Furthermore, the high cost of research and development poses a significant barrier to entry for new players. These challenges, if not effectively managed, can significantly impact market growth.
Emerging Opportunities in Phosphoramidite Market
The Phosphoramidite market presents several exciting opportunities. The increasing adoption of personalized medicine and growing interest in gene therapy pave the way for the development of customized phosphoramidites tailored for specific therapeutic applications. Advancements in solid-phase synthesis technology, such as microfluidic synthesis and automated high-throughput systems, offer the potential for increased efficiency and reduced costs. Expanding into emerging markets in Asia and Africa, where the demand for advanced healthcare technologies is rising rapidly, presents substantial growth potential. Furthermore, exploration of novel phosphoramidite analogs with improved properties and functionalities can open new avenues for applications.
Leading Players in the Phosphoramidite Market Market
- Bioneer Corporation
- Hongene Biotech Corporation
- Tokyo Chemical Industry Pvt Ltd
- PolyOrg Inc
- Thermo Fisher Scientific Inc
- Biosynth Ltd
- Lumiprobe Corporation
- Danaher Corporation
- QIAGEN N V
- TriLink BioTechnologies
- Creative Biolabs Inc
- BOC Sciences
Key Developments in Phosphoramidite Market Industry
July 2022: WuXi STA launched a new large-scale oligonucleotide and peptide manufacturing facility at its Changzhou campus, enhancing its capacity to meet the growing global demand for oligonucleotide and peptide therapeutics. This expansion significantly boosts the company's market position and ability to supply large-scale production demands.
March 2023: Oligo Factory opened a new 13,000 sq ft oligo manufacturing facility in Holliston, United States. This expansion strengthens the North American manufacturing capacity for custom oligonucleotides, potentially impacting local supply chains and competitive dynamics.
Strategic Outlook for Phosphoramidite Market Market
The Phosphoramidite market is poised for substantial growth driven by the converging trends of increasing demand for advanced therapies, technological innovations in oligonucleotide synthesis, and supportive government regulations. Strategic investments in research and development, expansion into emerging markets, and strategic partnerships are expected to be key growth catalysts. Companies with a focus on developing high-purity, customized phosphoramidites and embracing automation and high-throughput synthesis technologies are well-positioned to capitalize on the growing market opportunities. The continuous evolution of oligonucleotide-based therapies and diagnostics will drive sustained demand for high-quality phosphoramidites in the years to come.
Phosphoramidite Market Segmentation
-
1. Type
- 1.1. DNA Phosphoramidites
- 1.2. RNA Phosphoramidites
- 1.3. Other Phosphoramidites
-
2. End-User
- 2.1. Pharmaceutical and Biotechnology Companies
- 2.2. Academic and Research Institutes
- 2.3. Other End-Users
Phosphoramidite Market Segmentation By Geography
-
1. North America
- 1.1. United States
- 1.2. Canada
- 1.3. Mexico
-
2. Europe
- 2.1. Germany
- 2.2. United Kingdom
- 2.3. France
- 2.4. Italy
- 2.5. Spain
- 2.6. Rest of Europe
-
3. Asia Pacific
- 3.1. China
- 3.2. Japan
- 3.3. India
- 3.4. Australia
- 3.5. South Korea
- 3.6. Rest of Asia Pacific
- 4. Rest of the World
Phosphoramidite Market REPORT HIGHLIGHTS
| Aspects | Details |
|---|---|
| Study Period | 2019-2033 |
| Base Year | 2024 |
| Estimated Year | 2025 |
| Forecast Period | 2025-2033 |
| Historical Period | 2019-2024 |
| Growth Rate | CAGR of 6.42% from 2019-2033 |
| Segmentation |
|
Table of Contents
- 1. Introduction
- 1.1. Research Scope
- 1.2. Market Segmentation
- 1.3. Research Methodology
- 1.4. Definitions and Assumptions
- 2. Executive Summary
- 2.1. Introduction
- 3. Market Dynamics
- 3.1. Introduction
- 3.2. Market Drivers
- 3.2.1. Increasing Synthetic Nucleotide Applications in Therapeutics; Growth in Synthetic Biology
- 3.3. Market Restrains
- 3.3.1. Challenges in Developing Long Nucleotide Sequences
- 3.4. Market Trends
- 3.4.1. DNA Phosphoramidites is Expected to Witness Growth Over the Forecast Period
- 4. Market Factor Analysis
- 4.1. Porters Five Forces
- 4.2. Supply/Value Chain
- 4.3. PESTEL analysis
- 4.4. Market Entropy
- 4.5. Patent/Trademark Analysis
- 5. Global Phosphoramidite Market Analysis, Insights and Forecast, 2019-2031
- 5.1. Market Analysis, Insights and Forecast - by Type
- 5.1.1. DNA Phosphoramidites
- 5.1.2. RNA Phosphoramidites
- 5.1.3. Other Phosphoramidites
- 5.2. Market Analysis, Insights and Forecast - by End-User
- 5.2.1. Pharmaceutical and Biotechnology Companies
- 5.2.2. Academic and Research Institutes
- 5.2.3. Other End-Users
- 5.3. Market Analysis, Insights and Forecast - by Region
- 5.3.1. North America
- 5.3.2. Europe
- 5.3.3. Asia Pacific
- 5.3.4. Rest of the World
- 5.1. Market Analysis, Insights and Forecast - by Type
- 6. North America Phosphoramidite Market Analysis, Insights and Forecast, 2019-2031
- 6.1. Market Analysis, Insights and Forecast - by Type
- 6.1.1. DNA Phosphoramidites
- 6.1.2. RNA Phosphoramidites
- 6.1.3. Other Phosphoramidites
- 6.2. Market Analysis, Insights and Forecast - by End-User
- 6.2.1. Pharmaceutical and Biotechnology Companies
- 6.2.2. Academic and Research Institutes
- 6.2.3. Other End-Users
- 6.1. Market Analysis, Insights and Forecast - by Type
- 7. Europe Phosphoramidite Market Analysis, Insights and Forecast, 2019-2031
- 7.1. Market Analysis, Insights and Forecast - by Type
- 7.1.1. DNA Phosphoramidites
- 7.1.2. RNA Phosphoramidites
- 7.1.3. Other Phosphoramidites
- 7.2. Market Analysis, Insights and Forecast - by End-User
- 7.2.1. Pharmaceutical and Biotechnology Companies
- 7.2.2. Academic and Research Institutes
- 7.2.3. Other End-Users
- 7.1. Market Analysis, Insights and Forecast - by Type
- 8. Asia Pacific Phosphoramidite Market Analysis, Insights and Forecast, 2019-2031
- 8.1. Market Analysis, Insights and Forecast - by Type
- 8.1.1. DNA Phosphoramidites
- 8.1.2. RNA Phosphoramidites
- 8.1.3. Other Phosphoramidites
- 8.2. Market Analysis, Insights and Forecast - by End-User
- 8.2.1. Pharmaceutical and Biotechnology Companies
- 8.2.2. Academic and Research Institutes
- 8.2.3. Other End-Users
- 8.1. Market Analysis, Insights and Forecast - by Type
- 9. Rest of the World Phosphoramidite Market Analysis, Insights and Forecast, 2019-2031
- 9.1. Market Analysis, Insights and Forecast - by Type
- 9.1.1. DNA Phosphoramidites
- 9.1.2. RNA Phosphoramidites
- 9.1.3. Other Phosphoramidites
- 9.2. Market Analysis, Insights and Forecast - by End-User
- 9.2.1. Pharmaceutical and Biotechnology Companies
- 9.2.2. Academic and Research Institutes
- 9.2.3. Other End-Users
- 9.1. Market Analysis, Insights and Forecast - by Type
- 10. North America Phosphoramidite Market Analysis, Insights and Forecast, 2019-2031
- 10.1. Market Analysis, Insights and Forecast - By Country/Sub-region
- 10.1.1 United States
- 10.1.2 Canada
- 10.1.3 Mexico
- 11. Europe Phosphoramidite Market Analysis, Insights and Forecast, 2019-2031
- 11.1. Market Analysis, Insights and Forecast - By Country/Sub-region
- 11.1.1 Germany
- 11.1.2 United Kingdom
- 11.1.3 France
- 11.1.4 Spain
- 11.1.5 Italy
- 11.1.6 Spain
- 11.1.7 Belgium
- 11.1.8 Netherland
- 11.1.9 Nordics
- 11.1.10 Rest of Europe
- 12. Asia Pacific Phosphoramidite Market Analysis, Insights and Forecast, 2019-2031
- 12.1. Market Analysis, Insights and Forecast - By Country/Sub-region
- 12.1.1 China
- 12.1.2 Japan
- 12.1.3 India
- 12.1.4 South Korea
- 12.1.5 Southeast Asia
- 12.1.6 Australia
- 12.1.7 Indonesia
- 12.1.8 Phillipes
- 12.1.9 Singapore
- 12.1.10 Thailandc
- 12.1.11 Rest of Asia Pacific
- 13. South America Phosphoramidite Market Analysis, Insights and Forecast, 2019-2031
- 13.1. Market Analysis, Insights and Forecast - By Country/Sub-region
- 13.1.1 Brazil
- 13.1.2 Argentina
- 13.1.3 Peru
- 13.1.4 Chile
- 13.1.5 Colombia
- 13.1.6 Ecuador
- 13.1.7 Venezuela
- 13.1.8 Rest of South America
- 14. North America Phosphoramidite Market Analysis, Insights and Forecast, 2019-2031
- 14.1. Market Analysis, Insights and Forecast - By Country/Sub-region
- 14.1.1 United States
- 14.1.2 Canada
- 14.1.3 Mexico
- 15. MEA Phosphoramidite Market Analysis, Insights and Forecast, 2019-2031
- 15.1. Market Analysis, Insights and Forecast - By Country/Sub-region
- 15.1.1 United Arab Emirates
- 15.1.2 Saudi Arabia
- 15.1.3 South Africa
- 15.1.4 Rest of Middle East and Africa
- 16. Competitive Analysis
- 16.1. Global Market Share Analysis 2024
- 16.2. Company Profiles
- 16.2.1 Bioneer Corporation
- 16.2.1.1. Overview
- 16.2.1.2. Products
- 16.2.1.3. SWOT Analysis
- 16.2.1.4. Recent Developments
- 16.2.1.5. Financials (Based on Availability)
- 16.2.2 Hongene Biotech Corporation
- 16.2.2.1. Overview
- 16.2.2.2. Products
- 16.2.2.3. SWOT Analysis
- 16.2.2.4. Recent Developments
- 16.2.2.5. Financials (Based on Availability)
- 16.2.3 Tokyo Chemical Industry Pvt Ltd
- 16.2.3.1. Overview
- 16.2.3.2. Products
- 16.2.3.3. SWOT Analysis
- 16.2.3.4. Recent Developments
- 16.2.3.5. Financials (Based on Availability)
- 16.2.4 PolyOrg Inc
- 16.2.4.1. Overview
- 16.2.4.2. Products
- 16.2.4.3. SWOT Analysis
- 16.2.4.4. Recent Developments
- 16.2.4.5. Financials (Based on Availability)
- 16.2.5 Thermo Fisher Scientific Inc
- 16.2.5.1. Overview
- 16.2.5.2. Products
- 16.2.5.3. SWOT Analysis
- 16.2.5.4. Recent Developments
- 16.2.5.5. Financials (Based on Availability)
- 16.2.6 Biosynth Ltd
- 16.2.6.1. Overview
- 16.2.6.2. Products
- 16.2.6.3. SWOT Analysis
- 16.2.6.4. Recent Developments
- 16.2.6.5. Financials (Based on Availability)
- 16.2.7 Lumiprobe Corporation
- 16.2.7.1. Overview
- 16.2.7.2. Products
- 16.2.7.3. SWOT Analysis
- 16.2.7.4. Recent Developments
- 16.2.7.5. Financials (Based on Availability)
- 16.2.8 Danaher Corporation
- 16.2.8.1. Overview
- 16.2.8.2. Products
- 16.2.8.3. SWOT Analysis
- 16.2.8.4. Recent Developments
- 16.2.8.5. Financials (Based on Availability)
- 16.2.9 QIAGEN N V
- 16.2.9.1. Overview
- 16.2.9.2. Products
- 16.2.9.3. SWOT Analysis
- 16.2.9.4. Recent Developments
- 16.2.9.5. Financials (Based on Availability)
- 16.2.10 TriLink BioTechnologies
- 16.2.10.1. Overview
- 16.2.10.2. Products
- 16.2.10.3. SWOT Analysis
- 16.2.10.4. Recent Developments
- 16.2.10.5. Financials (Based on Availability)
- 16.2.11 Creative Biolabs Inc
- 16.2.11.1. Overview
- 16.2.11.2. Products
- 16.2.11.3. SWOT Analysis
- 16.2.11.4. Recent Developments
- 16.2.11.5. Financials (Based on Availability)
- 16.2.12 BOC Sciences
- 16.2.12.1. Overview
- 16.2.12.2. Products
- 16.2.12.3. SWOT Analysis
- 16.2.12.4. Recent Developments
- 16.2.12.5. Financials (Based on Availability)
- 16.2.1 Bioneer Corporation
List of Figures
- Figure 1: Global Phosphoramidite Market Revenue Breakdown (Million, %) by Region 2024 & 2032
- Figure 2: Global Phosphoramidite Market Volume Breakdown (K Unit, %) by Region 2024 & 2032
- Figure 3: North America Phosphoramidite Market Revenue (Million), by Country 2024 & 2032
- Figure 4: North America Phosphoramidite Market Volume (K Unit), by Country 2024 & 2032
- Figure 5: North America Phosphoramidite Market Revenue Share (%), by Country 2024 & 2032
- Figure 6: North America Phosphoramidite Market Volume Share (%), by Country 2024 & 2032
- Figure 7: Europe Phosphoramidite Market Revenue (Million), by Country 2024 & 2032
- Figure 8: Europe Phosphoramidite Market Volume (K Unit), by Country 2024 & 2032
- Figure 9: Europe Phosphoramidite Market Revenue Share (%), by Country 2024 & 2032
- Figure 10: Europe Phosphoramidite Market Volume Share (%), by Country 2024 & 2032
- Figure 11: Asia Pacific Phosphoramidite Market Revenue (Million), by Country 2024 & 2032
- Figure 12: Asia Pacific Phosphoramidite Market Volume (K Unit), by Country 2024 & 2032
- Figure 13: Asia Pacific Phosphoramidite Market Revenue Share (%), by Country 2024 & 2032
- Figure 14: Asia Pacific Phosphoramidite Market Volume Share (%), by Country 2024 & 2032
- Figure 15: South America Phosphoramidite Market Revenue (Million), by Country 2024 & 2032
- Figure 16: South America Phosphoramidite Market Volume (K Unit), by Country 2024 & 2032
- Figure 17: South America Phosphoramidite Market Revenue Share (%), by Country 2024 & 2032
- Figure 18: South America Phosphoramidite Market Volume Share (%), by Country 2024 & 2032
- Figure 19: North America Phosphoramidite Market Revenue (Million), by Country 2024 & 2032
- Figure 20: North America Phosphoramidite Market Volume (K Unit), by Country 2024 & 2032
- Figure 21: North America Phosphoramidite Market Revenue Share (%), by Country 2024 & 2032
- Figure 22: North America Phosphoramidite Market Volume Share (%), by Country 2024 & 2032
- Figure 23: MEA Phosphoramidite Market Revenue (Million), by Country 2024 & 2032
- Figure 24: MEA Phosphoramidite Market Volume (K Unit), by Country 2024 & 2032
- Figure 25: MEA Phosphoramidite Market Revenue Share (%), by Country 2024 & 2032
- Figure 26: MEA Phosphoramidite Market Volume Share (%), by Country 2024 & 2032
- Figure 27: North America Phosphoramidite Market Revenue (Million), by Type 2024 & 2032
- Figure 28: North America Phosphoramidite Market Volume (K Unit), by Type 2024 & 2032
- Figure 29: North America Phosphoramidite Market Revenue Share (%), by Type 2024 & 2032
- Figure 30: North America Phosphoramidite Market Volume Share (%), by Type 2024 & 2032
- Figure 31: North America Phosphoramidite Market Revenue (Million), by End-User 2024 & 2032
- Figure 32: North America Phosphoramidite Market Volume (K Unit), by End-User 2024 & 2032
- Figure 33: North America Phosphoramidite Market Revenue Share (%), by End-User 2024 & 2032
- Figure 34: North America Phosphoramidite Market Volume Share (%), by End-User 2024 & 2032
- Figure 35: North America Phosphoramidite Market Revenue (Million), by Country 2024 & 2032
- Figure 36: North America Phosphoramidite Market Volume (K Unit), by Country 2024 & 2032
- Figure 37: North America Phosphoramidite Market Revenue Share (%), by Country 2024 & 2032
- Figure 38: North America Phosphoramidite Market Volume Share (%), by Country 2024 & 2032
- Figure 39: Europe Phosphoramidite Market Revenue (Million), by Type 2024 & 2032
- Figure 40: Europe Phosphoramidite Market Volume (K Unit), by Type 2024 & 2032
- Figure 41: Europe Phosphoramidite Market Revenue Share (%), by Type 2024 & 2032
- Figure 42: Europe Phosphoramidite Market Volume Share (%), by Type 2024 & 2032
- Figure 43: Europe Phosphoramidite Market Revenue (Million), by End-User 2024 & 2032
- Figure 44: Europe Phosphoramidite Market Volume (K Unit), by End-User 2024 & 2032
- Figure 45: Europe Phosphoramidite Market Revenue Share (%), by End-User 2024 & 2032
- Figure 46: Europe Phosphoramidite Market Volume Share (%), by End-User 2024 & 2032
- Figure 47: Europe Phosphoramidite Market Revenue (Million), by Country 2024 & 2032
- Figure 48: Europe Phosphoramidite Market Volume (K Unit), by Country 2024 & 2032
- Figure 49: Europe Phosphoramidite Market Revenue Share (%), by Country 2024 & 2032
- Figure 50: Europe Phosphoramidite Market Volume Share (%), by Country 2024 & 2032
- Figure 51: Asia Pacific Phosphoramidite Market Revenue (Million), by Type 2024 & 2032
- Figure 52: Asia Pacific Phosphoramidite Market Volume (K Unit), by Type 2024 & 2032
- Figure 53: Asia Pacific Phosphoramidite Market Revenue Share (%), by Type 2024 & 2032
- Figure 54: Asia Pacific Phosphoramidite Market Volume Share (%), by Type 2024 & 2032
- Figure 55: Asia Pacific Phosphoramidite Market Revenue (Million), by End-User 2024 & 2032
- Figure 56: Asia Pacific Phosphoramidite Market Volume (K Unit), by End-User 2024 & 2032
- Figure 57: Asia Pacific Phosphoramidite Market Revenue Share (%), by End-User 2024 & 2032
- Figure 58: Asia Pacific Phosphoramidite Market Volume Share (%), by End-User 2024 & 2032
- Figure 59: Asia Pacific Phosphoramidite Market Revenue (Million), by Country 2024 & 2032
- Figure 60: Asia Pacific Phosphoramidite Market Volume (K Unit), by Country 2024 & 2032
- Figure 61: Asia Pacific Phosphoramidite Market Revenue Share (%), by Country 2024 & 2032
- Figure 62: Asia Pacific Phosphoramidite Market Volume Share (%), by Country 2024 & 2032
- Figure 63: Rest of the World Phosphoramidite Market Revenue (Million), by Type 2024 & 2032
- Figure 64: Rest of the World Phosphoramidite Market Volume (K Unit), by Type 2024 & 2032
- Figure 65: Rest of the World Phosphoramidite Market Revenue Share (%), by Type 2024 & 2032
- Figure 66: Rest of the World Phosphoramidite Market Volume Share (%), by Type 2024 & 2032
- Figure 67: Rest of the World Phosphoramidite Market Revenue (Million), by End-User 2024 & 2032
- Figure 68: Rest of the World Phosphoramidite Market Volume (K Unit), by End-User 2024 & 2032
- Figure 69: Rest of the World Phosphoramidite Market Revenue Share (%), by End-User 2024 & 2032
- Figure 70: Rest of the World Phosphoramidite Market Volume Share (%), by End-User 2024 & 2032
- Figure 71: Rest of the World Phosphoramidite Market Revenue (Million), by Country 2024 & 2032
- Figure 72: Rest of the World Phosphoramidite Market Volume (K Unit), by Country 2024 & 2032
- Figure 73: Rest of the World Phosphoramidite Market Revenue Share (%), by Country 2024 & 2032
- Figure 74: Rest of the World Phosphoramidite Market Volume Share (%), by Country 2024 & 2032
List of Tables
- Table 1: Global Phosphoramidite Market Revenue Million Forecast, by Region 2019 & 2032
- Table 2: Global Phosphoramidite Market Volume K Unit Forecast, by Region 2019 & 2032
- Table 3: Global Phosphoramidite Market Revenue Million Forecast, by Type 2019 & 2032
- Table 4: Global Phosphoramidite Market Volume K Unit Forecast, by Type 2019 & 2032
- Table 5: Global Phosphoramidite Market Revenue Million Forecast, by End-User 2019 & 2032
- Table 6: Global Phosphoramidite Market Volume K Unit Forecast, by End-User 2019 & 2032
- Table 7: Global Phosphoramidite Market Revenue Million Forecast, by Region 2019 & 2032
- Table 8: Global Phosphoramidite Market Volume K Unit Forecast, by Region 2019 & 2032
- Table 9: Global Phosphoramidite Market Revenue Million Forecast, by Country 2019 & 2032
- Table 10: Global Phosphoramidite Market Volume K Unit Forecast, by Country 2019 & 2032
- Table 11: United States Phosphoramidite Market Revenue (Million) Forecast, by Application 2019 & 2032
- Table 12: United States Phosphoramidite Market Volume (K Unit) Forecast, by Application 2019 & 2032
- Table 13: Canada Phosphoramidite Market Revenue (Million) Forecast, by Application 2019 & 2032
- Table 14: Canada Phosphoramidite Market Volume (K Unit) Forecast, by Application 2019 & 2032
- Table 15: Mexico Phosphoramidite Market Revenue (Million) Forecast, by Application 2019 & 2032
- Table 16: Mexico Phosphoramidite Market Volume (K Unit) Forecast, by Application 2019 & 2032
- Table 17: Global Phosphoramidite Market Revenue Million Forecast, by Country 2019 & 2032
- Table 18: Global Phosphoramidite Market Volume K Unit Forecast, by Country 2019 & 2032
- Table 19: Germany Phosphoramidite Market Revenue (Million) Forecast, by Application 2019 & 2032
- Table 20: Germany Phosphoramidite Market Volume (K Unit) Forecast, by Application 2019 & 2032
- Table 21: United Kingdom Phosphoramidite Market Revenue (Million) Forecast, by Application 2019 & 2032
- Table 22: United Kingdom Phosphoramidite Market Volume (K Unit) Forecast, by Application 2019 & 2032
- Table 23: France Phosphoramidite Market Revenue (Million) Forecast, by Application 2019 & 2032
- Table 24: France Phosphoramidite Market Volume (K Unit) Forecast, by Application 2019 & 2032
- Table 25: Spain Phosphoramidite Market Revenue (Million) Forecast, by Application 2019 & 2032
- Table 26: Spain Phosphoramidite Market Volume (K Unit) Forecast, by Application 2019 & 2032
- Table 27: Italy Phosphoramidite Market Revenue (Million) Forecast, by Application 2019 & 2032
- Table 28: Italy Phosphoramidite Market Volume (K Unit) Forecast, by Application 2019 & 2032
- Table 29: Spain Phosphoramidite Market Revenue (Million) Forecast, by Application 2019 & 2032
- Table 30: Spain Phosphoramidite Market Volume (K Unit) Forecast, by Application 2019 & 2032
- Table 31: Belgium Phosphoramidite Market Revenue (Million) Forecast, by Application 2019 & 2032
- Table 32: Belgium Phosphoramidite Market Volume (K Unit) Forecast, by Application 2019 & 2032
- Table 33: Netherland Phosphoramidite Market Revenue (Million) Forecast, by Application 2019 & 2032
- Table 34: Netherland Phosphoramidite Market Volume (K Unit) Forecast, by Application 2019 & 2032
- Table 35: Nordics Phosphoramidite Market Revenue (Million) Forecast, by Application 2019 & 2032
- Table 36: Nordics Phosphoramidite Market Volume (K Unit) Forecast, by Application 2019 & 2032
- Table 37: Rest of Europe Phosphoramidite Market Revenue (Million) Forecast, by Application 2019 & 2032
- Table 38: Rest of Europe Phosphoramidite Market Volume (K Unit) Forecast, by Application 2019 & 2032
- Table 39: Global Phosphoramidite Market Revenue Million Forecast, by Country 2019 & 2032
- Table 40: Global Phosphoramidite Market Volume K Unit Forecast, by Country 2019 & 2032
- Table 41: China Phosphoramidite Market Revenue (Million) Forecast, by Application 2019 & 2032
- Table 42: China Phosphoramidite Market Volume (K Unit) Forecast, by Application 2019 & 2032
- Table 43: Japan Phosphoramidite Market Revenue (Million) Forecast, by Application 2019 & 2032
- Table 44: Japan Phosphoramidite Market Volume (K Unit) Forecast, by Application 2019 & 2032
- Table 45: India Phosphoramidite Market Revenue (Million) Forecast, by Application 2019 & 2032
- Table 46: India Phosphoramidite Market Volume (K Unit) Forecast, by Application 2019 & 2032
- Table 47: South Korea Phosphoramidite Market Revenue (Million) Forecast, by Application 2019 & 2032
- Table 48: South Korea Phosphoramidite Market Volume (K Unit) Forecast, by Application 2019 & 2032
- Table 49: Southeast Asia Phosphoramidite Market Revenue (Million) Forecast, by Application 2019 & 2032
- Table 50: Southeast Asia Phosphoramidite Market Volume (K Unit) Forecast, by Application 2019 & 2032
- Table 51: Australia Phosphoramidite Market Revenue (Million) Forecast, by Application 2019 & 2032
- Table 52: Australia Phosphoramidite Market Volume (K Unit) Forecast, by Application 2019 & 2032
- Table 53: Indonesia Phosphoramidite Market Revenue (Million) Forecast, by Application 2019 & 2032
- Table 54: Indonesia Phosphoramidite Market Volume (K Unit) Forecast, by Application 2019 & 2032
- Table 55: Phillipes Phosphoramidite Market Revenue (Million) Forecast, by Application 2019 & 2032
- Table 56: Phillipes Phosphoramidite Market Volume (K Unit) Forecast, by Application 2019 & 2032
- Table 57: Singapore Phosphoramidite Market Revenue (Million) Forecast, by Application 2019 & 2032
- Table 58: Singapore Phosphoramidite Market Volume (K Unit) Forecast, by Application 2019 & 2032
- Table 59: Thailandc Phosphoramidite Market Revenue (Million) Forecast, by Application 2019 & 2032
- Table 60: Thailandc Phosphoramidite Market Volume (K Unit) Forecast, by Application 2019 & 2032
- Table 61: Rest of Asia Pacific Phosphoramidite Market Revenue (Million) Forecast, by Application 2019 & 2032
- Table 62: Rest of Asia Pacific Phosphoramidite Market Volume (K Unit) Forecast, by Application 2019 & 2032
- Table 63: Global Phosphoramidite Market Revenue Million Forecast, by Country 2019 & 2032
- Table 64: Global Phosphoramidite Market Volume K Unit Forecast, by Country 2019 & 2032
- Table 65: Brazil Phosphoramidite Market Revenue (Million) Forecast, by Application 2019 & 2032
- Table 66: Brazil Phosphoramidite Market Volume (K Unit) Forecast, by Application 2019 & 2032
- Table 67: Argentina Phosphoramidite Market Revenue (Million) Forecast, by Application 2019 & 2032
- Table 68: Argentina Phosphoramidite Market Volume (K Unit) Forecast, by Application 2019 & 2032
- Table 69: Peru Phosphoramidite Market Revenue (Million) Forecast, by Application 2019 & 2032
- Table 70: Peru Phosphoramidite Market Volume (K Unit) Forecast, by Application 2019 & 2032
- Table 71: Chile Phosphoramidite Market Revenue (Million) Forecast, by Application 2019 & 2032
- Table 72: Chile Phosphoramidite Market Volume (K Unit) Forecast, by Application 2019 & 2032
- Table 73: Colombia Phosphoramidite Market Revenue (Million) Forecast, by Application 2019 & 2032
- Table 74: Colombia Phosphoramidite Market Volume (K Unit) Forecast, by Application 2019 & 2032
- Table 75: Ecuador Phosphoramidite Market Revenue (Million) Forecast, by Application 2019 & 2032
- Table 76: Ecuador Phosphoramidite Market Volume (K Unit) Forecast, by Application 2019 & 2032
- Table 77: Venezuela Phosphoramidite Market Revenue (Million) Forecast, by Application 2019 & 2032
- Table 78: Venezuela Phosphoramidite Market Volume (K Unit) Forecast, by Application 2019 & 2032
- Table 79: Rest of South America Phosphoramidite Market Revenue (Million) Forecast, by Application 2019 & 2032
- Table 80: Rest of South America Phosphoramidite Market Volume (K Unit) Forecast, by Application 2019 & 2032
- Table 81: Global Phosphoramidite Market Revenue Million Forecast, by Country 2019 & 2032
- Table 82: Global Phosphoramidite Market Volume K Unit Forecast, by Country 2019 & 2032
- Table 83: United States Phosphoramidite Market Revenue (Million) Forecast, by Application 2019 & 2032
- Table 84: United States Phosphoramidite Market Volume (K Unit) Forecast, by Application 2019 & 2032
- Table 85: Canada Phosphoramidite Market Revenue (Million) Forecast, by Application 2019 & 2032
- Table 86: Canada Phosphoramidite Market Volume (K Unit) Forecast, by Application 2019 & 2032
- Table 87: Mexico Phosphoramidite Market Revenue (Million) Forecast, by Application 2019 & 2032
- Table 88: Mexico Phosphoramidite Market Volume (K Unit) Forecast, by Application 2019 & 2032
- Table 89: Global Phosphoramidite Market Revenue Million Forecast, by Country 2019 & 2032
- Table 90: Global Phosphoramidite Market Volume K Unit Forecast, by Country 2019 & 2032
- Table 91: United Arab Emirates Phosphoramidite Market Revenue (Million) Forecast, by Application 2019 & 2032
- Table 92: United Arab Emirates Phosphoramidite Market Volume (K Unit) Forecast, by Application 2019 & 2032
- Table 93: Saudi Arabia Phosphoramidite Market Revenue (Million) Forecast, by Application 2019 & 2032
- Table 94: Saudi Arabia Phosphoramidite Market Volume (K Unit) Forecast, by Application 2019 & 2032
- Table 95: South Africa Phosphoramidite Market Revenue (Million) Forecast, by Application 2019 & 2032
- Table 96: South Africa Phosphoramidite Market Volume (K Unit) Forecast, by Application 2019 & 2032
- Table 97: Rest of Middle East and Africa Phosphoramidite Market Revenue (Million) Forecast, by Application 2019 & 2032
- Table 98: Rest of Middle East and Africa Phosphoramidite Market Volume (K Unit) Forecast, by Application 2019 & 2032
- Table 99: Global Phosphoramidite Market Revenue Million Forecast, by Type 2019 & 2032
- Table 100: Global Phosphoramidite Market Volume K Unit Forecast, by Type 2019 & 2032
- Table 101: Global Phosphoramidite Market Revenue Million Forecast, by End-User 2019 & 2032
- Table 102: Global Phosphoramidite Market Volume K Unit Forecast, by End-User 2019 & 2032
- Table 103: Global Phosphoramidite Market Revenue Million Forecast, by Country 2019 & 2032
- Table 104: Global Phosphoramidite Market Volume K Unit Forecast, by Country 2019 & 2032
- Table 105: United States Phosphoramidite Market Revenue (Million) Forecast, by Application 2019 & 2032
- Table 106: United States Phosphoramidite Market Volume (K Unit) Forecast, by Application 2019 & 2032
- Table 107: Canada Phosphoramidite Market Revenue (Million) Forecast, by Application 2019 & 2032
- Table 108: Canada Phosphoramidite Market Volume (K Unit) Forecast, by Application 2019 & 2032
- Table 109: Mexico Phosphoramidite Market Revenue (Million) Forecast, by Application 2019 & 2032
- Table 110: Mexico Phosphoramidite Market Volume (K Unit) Forecast, by Application 2019 & 2032
- Table 111: Global Phosphoramidite Market Revenue Million Forecast, by Type 2019 & 2032
- Table 112: Global Phosphoramidite Market Volume K Unit Forecast, by Type 2019 & 2032
- Table 113: Global Phosphoramidite Market Revenue Million Forecast, by End-User 2019 & 2032
- Table 114: Global Phosphoramidite Market Volume K Unit Forecast, by End-User 2019 & 2032
- Table 115: Global Phosphoramidite Market Revenue Million Forecast, by Country 2019 & 2032
- Table 116: Global Phosphoramidite Market Volume K Unit Forecast, by Country 2019 & 2032
- Table 117: Germany Phosphoramidite Market Revenue (Million) Forecast, by Application 2019 & 2032
- Table 118: Germany Phosphoramidite Market Volume (K Unit) Forecast, by Application 2019 & 2032
- Table 119: United Kingdom Phosphoramidite Market Revenue (Million) Forecast, by Application 2019 & 2032
- Table 120: United Kingdom Phosphoramidite Market Volume (K Unit) Forecast, by Application 2019 & 2032
- Table 121: France Phosphoramidite Market Revenue (Million) Forecast, by Application 2019 & 2032
- Table 122: France Phosphoramidite Market Volume (K Unit) Forecast, by Application 2019 & 2032
- Table 123: Italy Phosphoramidite Market Revenue (Million) Forecast, by Application 2019 & 2032
- Table 124: Italy Phosphoramidite Market Volume (K Unit) Forecast, by Application 2019 & 2032
- Table 125: Spain Phosphoramidite Market Revenue (Million) Forecast, by Application 2019 & 2032
- Table 126: Spain Phosphoramidite Market Volume (K Unit) Forecast, by Application 2019 & 2032
- Table 127: Rest of Europe Phosphoramidite Market Revenue (Million) Forecast, by Application 2019 & 2032
- Table 128: Rest of Europe Phosphoramidite Market Volume (K Unit) Forecast, by Application 2019 & 2032
- Table 129: Global Phosphoramidite Market Revenue Million Forecast, by Type 2019 & 2032
- Table 130: Global Phosphoramidite Market Volume K Unit Forecast, by Type 2019 & 2032
- Table 131: Global Phosphoramidite Market Revenue Million Forecast, by End-User 2019 & 2032
- Table 132: Global Phosphoramidite Market Volume K Unit Forecast, by End-User 2019 & 2032
- Table 133: Global Phosphoramidite Market Revenue Million Forecast, by Country 2019 & 2032
- Table 134: Global Phosphoramidite Market Volume K Unit Forecast, by Country 2019 & 2032
- Table 135: China Phosphoramidite Market Revenue (Million) Forecast, by Application 2019 & 2032
- Table 136: China Phosphoramidite Market Volume (K Unit) Forecast, by Application 2019 & 2032
- Table 137: Japan Phosphoramidite Market Revenue (Million) Forecast, by Application 2019 & 2032
- Table 138: Japan Phosphoramidite Market Volume (K Unit) Forecast, by Application 2019 & 2032
- Table 139: India Phosphoramidite Market Revenue (Million) Forecast, by Application 2019 & 2032
- Table 140: India Phosphoramidite Market Volume (K Unit) Forecast, by Application 2019 & 2032
- Table 141: Australia Phosphoramidite Market Revenue (Million) Forecast, by Application 2019 & 2032
- Table 142: Australia Phosphoramidite Market Volume (K Unit) Forecast, by Application 2019 & 2032
- Table 143: South Korea Phosphoramidite Market Revenue (Million) Forecast, by Application 2019 & 2032
- Table 144: South Korea Phosphoramidite Market Volume (K Unit) Forecast, by Application 2019 & 2032
- Table 145: Rest of Asia Pacific Phosphoramidite Market Revenue (Million) Forecast, by Application 2019 & 2032
- Table 146: Rest of Asia Pacific Phosphoramidite Market Volume (K Unit) Forecast, by Application 2019 & 2032
- Table 147: Global Phosphoramidite Market Revenue Million Forecast, by Type 2019 & 2032
- Table 148: Global Phosphoramidite Market Volume K Unit Forecast, by Type 2019 & 2032
- Table 149: Global Phosphoramidite Market Revenue Million Forecast, by End-User 2019 & 2032
- Table 150: Global Phosphoramidite Market Volume K Unit Forecast, by End-User 2019 & 2032
- Table 151: Global Phosphoramidite Market Revenue Million Forecast, by Country 2019 & 2032
- Table 152: Global Phosphoramidite Market Volume K Unit Forecast, by Country 2019 & 2032
Frequently Asked Questions
1. What is the projected Compound Annual Growth Rate (CAGR) of the Phosphoramidite Market?
The projected CAGR is approximately 6.42%.
2. Which companies are prominent players in the Phosphoramidite Market?
Key companies in the market include Bioneer Corporation, Hongene Biotech Corporation, Tokyo Chemical Industry Pvt Ltd, PolyOrg Inc, Thermo Fisher Scientific Inc, Biosynth Ltd, Lumiprobe Corporation, Danaher Corporation, QIAGEN N V, TriLink BioTechnologies, Creative Biolabs Inc, BOC Sciences.
3. What are the main segments of the Phosphoramidite Market?
The market segments include Type, End-User.
4. Can you provide details about the market size?
The market size is estimated to be USD 1.13 Million as of 2022.
5. What are some drivers contributing to market growth?
Increasing Synthetic Nucleotide Applications in Therapeutics; Growth in Synthetic Biology.
6. What are the notable trends driving market growth?
DNA Phosphoramidites is Expected to Witness Growth Over the Forecast Period.
7. Are there any restraints impacting market growth?
Challenges in Developing Long Nucleotide Sequences.
8. Can you provide examples of recent developments in the market?
March 2023: Oligo Factory, an independent custom oligonucleotide manufacturer, opened a new oligo manufacturing facility with 13,000 sq ft of combined offices, bench space, and labs in Holliston, United States.
9. What pricing options are available for accessing the report?
Pricing options include single-user, multi-user, and enterprise licenses priced at USD 4750, USD 5250, and USD 8750 respectively.
10. Is the market size provided in terms of value or volume?
The market size is provided in terms of value, measured in Million and volume, measured in K Unit.
11. Are there any specific market keywords associated with the report?
Yes, the market keyword associated with the report is "Phosphoramidite Market," which aids in identifying and referencing the specific market segment covered.
12. How do I determine which pricing option suits my needs best?
The pricing options vary based on user requirements and access needs. Individual users may opt for single-user licenses, while businesses requiring broader access may choose multi-user or enterprise licenses for cost-effective access to the report.
13. Are there any additional resources or data provided in the Phosphoramidite Market report?
While the report offers comprehensive insights, it's advisable to review the specific contents or supplementary materials provided to ascertain if additional resources or data are available.
14. How can I stay updated on further developments or reports in the Phosphoramidite Market?
To stay informed about further developments, trends, and reports in the Phosphoramidite Market, consider subscribing to industry newsletters, following relevant companies and organizations, or regularly checking reputable industry news sources and publications.
Methodology
Step 1 - Identification of Relevant Samples Size from Population Database


Step 2 - Approaches for Defining Global Market Size (Value, Volume* & Price*)

Note*: In applicable scenarios
Step 3 - Data Sources
Primary Research
- Web Analytics
- Survey Reports
- Research Institute
- Latest Research Reports
- Opinion Leaders
Secondary Research
- Annual Reports
- White Paper
- Latest Press Release
- Industry Association
- Paid Database
- Investor Presentations

Step 4 - Data Triangulation
Involves using different sources of information in order to increase the validity of a study
These sources are likely to be stakeholders in a program - participants, other researchers, program staff, other community members, and so on.
Then we put all data in single framework & apply various statistical tools to find out the dynamic on the market.
During the analysis stage, feedback from the stakeholder groups would be compared to determine areas of agreement as well as areas of divergence


