
Key Insights
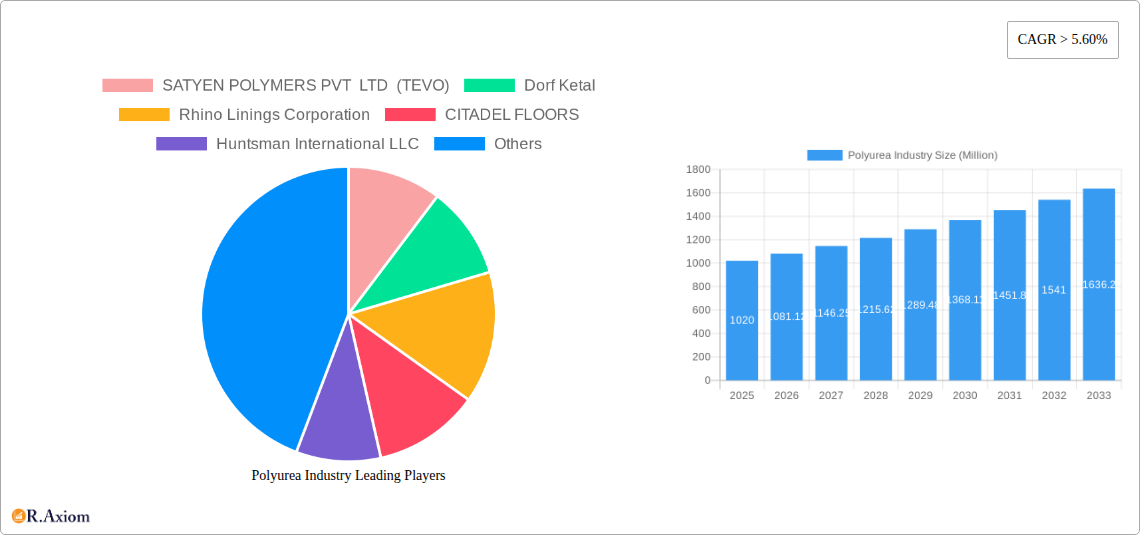
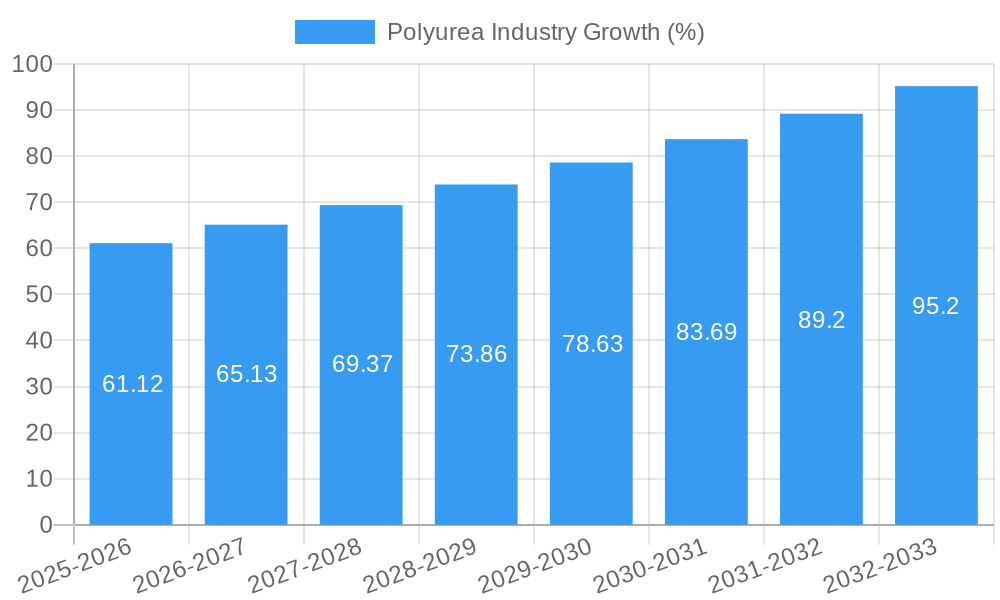
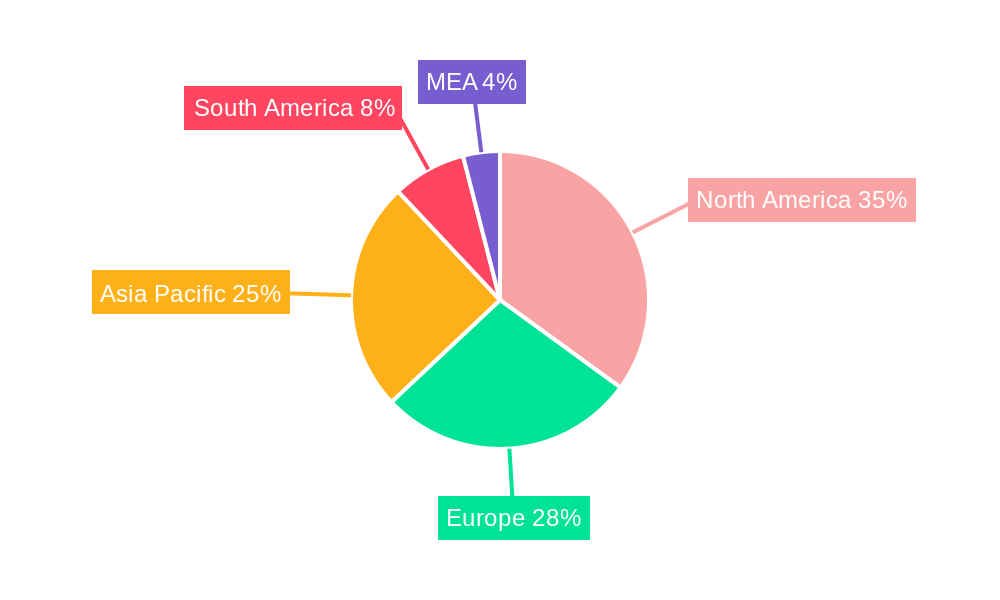
The global polyurea market, valued at $1.02 billion in 2025, is projected to experience robust growth, driven by a compound annual growth rate (CAGR) exceeding 5.60% from 2025 to 2033. This expansion is fueled by several key factors. The increasing demand for high-performance coatings in diverse end-use industries, such as construction (infrastructure projects, waterproofing), automotive (corrosion protection, sound dampening), and industrial applications (pipeline coatings, tank linings), is a significant driver. Furthermore, the unique properties of polyurea – rapid curing, excellent abrasion resistance, and superior flexibility – make it a preferred choice over traditional materials like epoxy and polyurethane in many applications. Technological advancements leading to improved formulations with enhanced durability and cost-effectiveness are further boosting market growth. The rising adoption of sustainable and eco-friendly polyurea coatings, addressing environmental concerns, also contributes to the market's positive outlook. The market segmentation reveals significant contributions from various product types (lining, coating, sealants) and chemical structures (aromatic, aliphatic), with hot and cold polyurea applications exhibiting diverse growth trajectories based on specific project needs. Geographic variations exist, with North America and Europe holding substantial market shares, while Asia-Pacific is expected to show significant growth potential in the coming years due to increasing infrastructure development and industrialization.
Despite the positive outlook, the market faces certain challenges. Fluctuations in raw material prices, particularly for isocyanates, can impact production costs and profitability. Furthermore, the specialized application techniques required for polyurea necessitate skilled labor, potentially limiting widespread adoption in certain regions. However, ongoing advancements in application equipment and training programs are mitigating this constraint. The competitive landscape is characterized by a mix of established players and emerging companies, each focusing on product innovation and market penetration. Companies like Huntsman International LLC and Covestro AG leverage their established presence and research capabilities to maintain their market positions, while smaller players are focusing on niche applications and regional expansion. The overall forecast for the polyurea market remains optimistic, promising substantial growth and opportunities for market participants over the next decade.
Polyurea Industry Market Report: 2019-2033
This comprehensive report provides an in-depth analysis of the global polyurea industry, covering market size, segmentation, growth drivers, challenges, and key players. The study period spans from 2019 to 2033, with 2025 as the base and estimated year. The forecast period is 2025-2033, and the historical period is 2019-2024. This report is crucial for industry stakeholders, investors, and businesses seeking to understand and capitalize on the opportunities within this dynamic market. The report projects a xx Million USD market value by 2033, with a CAGR of xx% during the forecast period.
Polyurea Industry Market Concentration & Innovation
The global polyurea market exhibits a moderately concentrated landscape, with several major players holding significant market share. While precise market share figures for each company are proprietary information, Huntsman International LLC, Covestro AG, and Teknos Group are consistently identified as major players. The market is characterized by ongoing innovation, driven by the need for improved performance characteristics, such as enhanced durability, flexibility, and chemical resistance. Regulatory frameworks, particularly those related to environmental protection and worker safety, play a significant role in shaping industry practices. Product substitutes, such as epoxy coatings and polyurethane systems, represent competitive challenges, prompting ongoing innovation in polyurea formulations to maintain a competitive edge. M&A activities have played a role in consolidating the market, though the total value of deals within the past five years is estimated at approximately xx Million USD. End-user trends toward sustainable and high-performance materials are creating opportunities for new polyurea applications.
- Key Players: Huntsman International LLC, Covestro AG, Teknos Group, and others.
- Innovation Drivers: Improved performance characteristics (durability, flexibility, chemical resistance), sustainability concerns, and regulatory compliance.
- M&A Activity: Estimated value of deals over the last five years: xx Million USD.
Polyurea Industry Industry Trends & Insights
The polyurea market is experiencing robust growth, fueled by increasing demand across diverse end-use sectors. The construction industry, particularly for infrastructure projects and protective coatings, is a significant driver, alongside automotive applications (e.g., underbody coatings) and industrial uses (e.g., corrosion protection). The market penetration rate varies considerably across segments; for example, the construction sector demonstrates relatively high adoption of polyurea products, while penetration in certain niche industrial applications remains limited. Technological advancements, such as the development of high-performance formulations, improved application methods, and more sustainable manufacturing processes are accelerating market growth. Consumer preferences for durable, long-lasting, and environmentally friendly coatings further contribute to market expansion. Competitive dynamics involve price competition, innovation in product features, and strategic partnerships to expand market reach.
Dominant Markets & Segments in Polyurea Industry
The construction sector represents the dominant end-use industry for polyurea, driven by its superior performance in waterproofing, corrosion protection, and durability. Geographically, North America and Europe are currently the leading markets, driven by mature infrastructure, robust construction activities, and stringent regulatory standards. The automotive industry and industrial applications are also significant and growing segments.
- Dominant End-Use Industry: Construction
- Leading Regions: North America and Europe
- Key Drivers:
- Construction: Infrastructure development, building renovation, stringent regulatory standards.
- Automotive: Demand for lightweighting materials, durability and corrosion protection.
- Industrial: Protection of equipment, pipes, and tanks.
- Product Segment Dominance: The coatings segment holds the largest market share due to its broad applicability across various industries.
Polyurea Industry Product Developments
Recent product innovations focus on enhanced durability, flexibility, and ease of application. New formulations offer improved UV resistance, chemical resistance, and abrasion resistance, expanding the range of applications for polyurea. The development of water-based polyurea systems is gaining traction, driven by environmental concerns. These advancements improve market fit by addressing key user needs for high performance and environmental friendliness.
Report Scope & Segmentation Analysis
This report segments the polyurea market based on product type (lining, coating, sealants), end-user industry (construction, paints and coatings, automotive, industrial, maritime, others), chemical structure (aliphatic, aromatic), and application method (hot, cold). Each segment's growth projections, market size, and competitive landscape are analyzed in detail. For instance, the construction segment shows a projected xx% CAGR, while the automotive segment is anticipated to grow at a xx% CAGR. The market size is projected at xx Million USD for the coatings segment, and xx Million USD for the construction segment, in 2025. Market dynamics within each segment differ based on technological advancements, regulatory changes, and specific industry needs.
Key Drivers of Polyurea Industry Growth
Several factors contribute to the growth of the polyurea industry. Technological advancements in formulation and application methods provide improved performance characteristics, enabling wider adoption across various end-use sectors. The increasing demand for durable, corrosion-resistant coatings in infrastructure projects, automotive manufacturing, and industrial applications is a significant driver. Furthermore, stringent environmental regulations are stimulating the development of more environmentally friendly polyurea formulations, further fueling market growth.
Challenges in the Polyurea Industry Sector
The polyurea industry faces challenges, including high initial investment costs for specialized application equipment. Supply chain disruptions can impact the availability of raw materials, influencing production costs. Competition from other coating technologies and price fluctuations in raw materials represent ongoing challenges. Regulatory compliance requirements, especially concerning volatile organic compounds (VOCs), can impact market growth. The overall impact of these challenges is estimated to reduce the overall market growth by approximately xx% over the forecast period.
Emerging Opportunities in Polyurea Industry
Emerging opportunities lie in the development of sustainable and eco-friendly polyurea formulations, expanding into new applications, and exploring new geographical markets. The increasing demand for specialized coatings in renewable energy sectors, such as wind turbine blades and solar panels, presents significant growth potential. Technological advancements in application techniques and automated systems offer cost and efficiency improvements, driving market growth.
Leading Players in the Polyurea Industry Market
- SATYEN POLYMERS PVT LTD (TEVO)
- Dorf Ketal
- Rhino Linings Corporation
- CITADEL FLOORS
- Huntsman International LLC
- Elastothane
- Speciality Products Inc
- Teknos Group
- Lonza
- Covestro AG
- Armorthane
Key Developments in Polyurea Industry Industry
- September 2022: Teknos Group opened a new Commercial and Competence Centre in Vietnam, expanding its business and boosting the polyurea market in the region.
- January 2023: Teknos Deutschland GmbH relocated its production to Brüggen, Germany, improving production and delivery capabilities and positively impacting the German polyurea market.
Strategic Outlook for Polyurea Industry Market
The polyurea industry is poised for continued growth driven by ongoing innovation, expanding applications, and increasing demand across various sectors. Strategic investments in research and development, along with strategic partnerships, will be crucial for players to capitalize on future opportunities. Focus on sustainability and environmentally friendly formulations will further enhance market competitiveness. The market is expected to witness significant growth, particularly in emerging economies, driven by infrastructure development and industrialization.
Polyurea Industry Segmentation
-
1. Chemical Structure
- 1.1. Aromatic
- 1.2. Aliphatic
-
2. Type
- 2.1. Hot Polyurea
- 2.2. Cold Polyurea
-
3. Product
- 3.1. Lining
- 3.2. Coating
- 3.3. Sealants
-
4. End-user Industry
- 4.1. Construction
- 4.2. Paints and Coatings
- 4.3. Automotive
- 4.4. Industrial
- 4.5. Maritime
- 4.6. Other End-user Industries (Transportation, Etc.)
Polyurea Industry Segmentation By Geography
-
1. Asia Pacific
- 1.1. China
- 1.2. India
- 1.3. Japan
- 1.4. South Korea
- 1.5. Rest of Asia Pacific
-
2. North America
- 2.1. United States
- 2.2. Canada
- 2.3. Mexico
-
3. Europe
- 3.1. Germany
- 3.2. United Kingdom
- 3.3. France
- 3.4. Italy
- 3.5. Rest of Europe
-
4. South America
- 4.1. Brazil
- 4.2. Argentina
- 4.3. Rest of South America
-
5. Middle East and Africa
- 5.1. Saudi Arabia
- 5.2. South Africa
- 5.3. Rest of Middle East and Africa
Polyurea Industry REPORT HIGHLIGHTS
| Aspects | Details |
|---|---|
| Study Period | 2019-2033 |
| Base Year | 2024 |
| Estimated Year | 2025 |
| Forecast Period | 2025-2033 |
| Historical Period | 2019-2024 |
| Growth Rate | CAGR of > 5.60% from 2019-2033 |
| Segmentation |
|
Table of Contents
- 1. Introduction
- 1.1. Research Scope
- 1.2. Market Segmentation
- 1.3. Research Methodology
- 1.4. Definitions and Assumptions
- 2. Executive Summary
- 2.1. Introduction
- 3. Market Dynamics
- 3.1. Introduction
- 3.2. Market Drivers
- 3.2.1. Growing Demand of Polyurea from Construction Industry; Growing Demand from Automotive Sector; Other Drivers
- 3.3. Market Restrains
- 3.3.1. Volatility in Raw Material Price; Other Restraints
- 3.4. Market Trends
- 3.4.1. Growing Demand for Polyurea from the Construction Industry
- 4. Market Factor Analysis
- 4.1. Porters Five Forces
- 4.2. Supply/Value Chain
- 4.3. PESTEL analysis
- 4.4. Market Entropy
- 4.5. Patent/Trademark Analysis
- 5. Global Polyurea Industry Analysis, Insights and Forecast, 2019-2031
- 5.1. Market Analysis, Insights and Forecast - by Chemical Structure
- 5.1.1. Aromatic
- 5.1.2. Aliphatic
- 5.2. Market Analysis, Insights and Forecast - by Type
- 5.2.1. Hot Polyurea
- 5.2.2. Cold Polyurea
- 5.3. Market Analysis, Insights and Forecast - by Product
- 5.3.1. Lining
- 5.3.2. Coating
- 5.3.3. Sealants
- 5.4. Market Analysis, Insights and Forecast - by End-user Industry
- 5.4.1. Construction
- 5.4.2. Paints and Coatings
- 5.4.3. Automotive
- 5.4.4. Industrial
- 5.4.5. Maritime
- 5.4.6. Other End-user Industries (Transportation, Etc.)
- 5.5. Market Analysis, Insights and Forecast - by Region
- 5.5.1. Asia Pacific
- 5.5.2. North America
- 5.5.3. Europe
- 5.5.4. South America
- 5.5.5. Middle East and Africa
- 5.1. Market Analysis, Insights and Forecast - by Chemical Structure
- 6. Asia Pacific Polyurea Industry Analysis, Insights and Forecast, 2019-2031
- 6.1. Market Analysis, Insights and Forecast - by Chemical Structure
- 6.1.1. Aromatic
- 6.1.2. Aliphatic
- 6.2. Market Analysis, Insights and Forecast - by Type
- 6.2.1. Hot Polyurea
- 6.2.2. Cold Polyurea
- 6.3. Market Analysis, Insights and Forecast - by Product
- 6.3.1. Lining
- 6.3.2. Coating
- 6.3.3. Sealants
- 6.4. Market Analysis, Insights and Forecast - by End-user Industry
- 6.4.1. Construction
- 6.4.2. Paints and Coatings
- 6.4.3. Automotive
- 6.4.4. Industrial
- 6.4.5. Maritime
- 6.4.6. Other End-user Industries (Transportation, Etc.)
- 6.1. Market Analysis, Insights and Forecast - by Chemical Structure
- 7. North America Polyurea Industry Analysis, Insights and Forecast, 2019-2031
- 7.1. Market Analysis, Insights and Forecast - by Chemical Structure
- 7.1.1. Aromatic
- 7.1.2. Aliphatic
- 7.2. Market Analysis, Insights and Forecast - by Type
- 7.2.1. Hot Polyurea
- 7.2.2. Cold Polyurea
- 7.3. Market Analysis, Insights and Forecast - by Product
- 7.3.1. Lining
- 7.3.2. Coating
- 7.3.3. Sealants
- 7.4. Market Analysis, Insights and Forecast - by End-user Industry
- 7.4.1. Construction
- 7.4.2. Paints and Coatings
- 7.4.3. Automotive
- 7.4.4. Industrial
- 7.4.5. Maritime
- 7.4.6. Other End-user Industries (Transportation, Etc.)
- 7.1. Market Analysis, Insights and Forecast - by Chemical Structure
- 8. Europe Polyurea Industry Analysis, Insights and Forecast, 2019-2031
- 8.1. Market Analysis, Insights and Forecast - by Chemical Structure
- 8.1.1. Aromatic
- 8.1.2. Aliphatic
- 8.2. Market Analysis, Insights and Forecast - by Type
- 8.2.1. Hot Polyurea
- 8.2.2. Cold Polyurea
- 8.3. Market Analysis, Insights and Forecast - by Product
- 8.3.1. Lining
- 8.3.2. Coating
- 8.3.3. Sealants
- 8.4. Market Analysis, Insights and Forecast - by End-user Industry
- 8.4.1. Construction
- 8.4.2. Paints and Coatings
- 8.4.3. Automotive
- 8.4.4. Industrial
- 8.4.5. Maritime
- 8.4.6. Other End-user Industries (Transportation, Etc.)
- 8.1. Market Analysis, Insights and Forecast - by Chemical Structure
- 9. South America Polyurea Industry Analysis, Insights and Forecast, 2019-2031
- 9.1. Market Analysis, Insights and Forecast - by Chemical Structure
- 9.1.1. Aromatic
- 9.1.2. Aliphatic
- 9.2. Market Analysis, Insights and Forecast - by Type
- 9.2.1. Hot Polyurea
- 9.2.2. Cold Polyurea
- 9.3. Market Analysis, Insights and Forecast - by Product
- 9.3.1. Lining
- 9.3.2. Coating
- 9.3.3. Sealants
- 9.4. Market Analysis, Insights and Forecast - by End-user Industry
- 9.4.1. Construction
- 9.4.2. Paints and Coatings
- 9.4.3. Automotive
- 9.4.4. Industrial
- 9.4.5. Maritime
- 9.4.6. Other End-user Industries (Transportation, Etc.)
- 9.1. Market Analysis, Insights and Forecast - by Chemical Structure
- 10. Middle East and Africa Polyurea Industry Analysis, Insights and Forecast, 2019-2031
- 10.1. Market Analysis, Insights and Forecast - by Chemical Structure
- 10.1.1. Aromatic
- 10.1.2. Aliphatic
- 10.2. Market Analysis, Insights and Forecast - by Type
- 10.2.1. Hot Polyurea
- 10.2.2. Cold Polyurea
- 10.3. Market Analysis, Insights and Forecast - by Product
- 10.3.1. Lining
- 10.3.2. Coating
- 10.3.3. Sealants
- 10.4. Market Analysis, Insights and Forecast - by End-user Industry
- 10.4.1. Construction
- 10.4.2. Paints and Coatings
- 10.4.3. Automotive
- 10.4.4. Industrial
- 10.4.5. Maritime
- 10.4.6. Other End-user Industries (Transportation, Etc.)
- 10.1. Market Analysis, Insights and Forecast - by Chemical Structure
- 11. North America Polyurea Industry Analysis, Insights and Forecast, 2019-2031
- 11.1. Market Analysis, Insights and Forecast - By Country/Sub-region
- 11.1.1 United States
- 11.1.2 Canada
- 11.1.3 Mexico
- 12. Europe Polyurea Industry Analysis, Insights and Forecast, 2019-2031
- 12.1. Market Analysis, Insights and Forecast - By Country/Sub-region
- 12.1.1 Germany
- 12.1.2 France
- 12.1.3 Italy
- 12.1.4 United Kingdom
- 12.1.5 Netherlands
- 12.1.6 Rest of Europe
- 13. Asia Pacific Polyurea Industry Analysis, Insights and Forecast, 2019-2031
- 13.1. Market Analysis, Insights and Forecast - By Country/Sub-region
- 13.1.1 China
- 13.1.2 Japan
- 13.1.3 India
- 13.1.4 South Korea
- 13.1.5 Taiwan
- 13.1.6 Australia
- 13.1.7 Rest of Asia-Pacific
- 14. South America Polyurea Industry Analysis, Insights and Forecast, 2019-2031
- 14.1. Market Analysis, Insights and Forecast - By Country/Sub-region
- 14.1.1 Brazil
- 14.1.2 Argentina
- 14.1.3 Rest of South America
- 15. MEA Polyurea Industry Analysis, Insights and Forecast, 2019-2031
- 15.1. Market Analysis, Insights and Forecast - By Country/Sub-region
- 15.1.1 Middle East
- 15.1.2 Africa
- 16. Competitive Analysis
- 16.1. Global Market Share Analysis 2024
- 16.2. Company Profiles
- 16.2.1 SATYEN POLYMERS PVT LTD (TEVO)
- 16.2.1.1. Overview
- 16.2.1.2. Products
- 16.2.1.3. SWOT Analysis
- 16.2.1.4. Recent Developments
- 16.2.1.5. Financials (Based on Availability)
- 16.2.2 Dorf Ketal
- 16.2.2.1. Overview
- 16.2.2.2. Products
- 16.2.2.3. SWOT Analysis
- 16.2.2.4. Recent Developments
- 16.2.2.5. Financials (Based on Availability)
- 16.2.3 Rhino Linings Corporation
- 16.2.3.1. Overview
- 16.2.3.2. Products
- 16.2.3.3. SWOT Analysis
- 16.2.3.4. Recent Developments
- 16.2.3.5. Financials (Based on Availability)
- 16.2.4 CITADEL FLOORS
- 16.2.4.1. Overview
- 16.2.4.2. Products
- 16.2.4.3. SWOT Analysis
- 16.2.4.4. Recent Developments
- 16.2.4.5. Financials (Based on Availability)
- 16.2.5 Huntsman International LLC
- 16.2.5.1. Overview
- 16.2.5.2. Products
- 16.2.5.3. SWOT Analysis
- 16.2.5.4. Recent Developments
- 16.2.5.5. Financials (Based on Availability)
- 16.2.6 Elastothane
- 16.2.6.1. Overview
- 16.2.6.2. Products
- 16.2.6.3. SWOT Analysis
- 16.2.6.4. Recent Developments
- 16.2.6.5. Financials (Based on Availability)
- 16.2.7 Speciality Products Inc
- 16.2.7.1. Overview
- 16.2.7.2. Products
- 16.2.7.3. SWOT Analysis
- 16.2.7.4. Recent Developments
- 16.2.7.5. Financials (Based on Availability)
- 16.2.8 Teknos Group
- 16.2.8.1. Overview
- 16.2.8.2. Products
- 16.2.8.3. SWOT Analysis
- 16.2.8.4. Recent Developments
- 16.2.8.5. Financials (Based on Availability)
- 16.2.9 Lonza
- 16.2.9.1. Overview
- 16.2.9.2. Products
- 16.2.9.3. SWOT Analysis
- 16.2.9.4. Recent Developments
- 16.2.9.5. Financials (Based on Availability)
- 16.2.10 Covestro AG
- 16.2.10.1. Overview
- 16.2.10.2. Products
- 16.2.10.3. SWOT Analysis
- 16.2.10.4. Recent Developments
- 16.2.10.5. Financials (Based on Availability)
- 16.2.11 Armorthane
- 16.2.11.1. Overview
- 16.2.11.2. Products
- 16.2.11.3. SWOT Analysis
- 16.2.11.4. Recent Developments
- 16.2.11.5. Financials (Based on Availability)
- 16.2.1 SATYEN POLYMERS PVT LTD (TEVO)
List of Figures
- Figure 1: Global Polyurea Industry Revenue Breakdown (Million, %) by Region 2024 & 2032
- Figure 2: Global Polyurea Industry Volume Breakdown (K Tons, %) by Region 2024 & 2032
- Figure 3: North America Polyurea Industry Revenue (Million), by Country 2024 & 2032
- Figure 4: North America Polyurea Industry Volume (K Tons), by Country 2024 & 2032
- Figure 5: North America Polyurea Industry Revenue Share (%), by Country 2024 & 2032
- Figure 6: North America Polyurea Industry Volume Share (%), by Country 2024 & 2032
- Figure 7: Europe Polyurea Industry Revenue (Million), by Country 2024 & 2032
- Figure 8: Europe Polyurea Industry Volume (K Tons), by Country 2024 & 2032
- Figure 9: Europe Polyurea Industry Revenue Share (%), by Country 2024 & 2032
- Figure 10: Europe Polyurea Industry Volume Share (%), by Country 2024 & 2032
- Figure 11: Asia Pacific Polyurea Industry Revenue (Million), by Country 2024 & 2032
- Figure 12: Asia Pacific Polyurea Industry Volume (K Tons), by Country 2024 & 2032
- Figure 13: Asia Pacific Polyurea Industry Revenue Share (%), by Country 2024 & 2032
- Figure 14: Asia Pacific Polyurea Industry Volume Share (%), by Country 2024 & 2032
- Figure 15: South America Polyurea Industry Revenue (Million), by Country 2024 & 2032
- Figure 16: South America Polyurea Industry Volume (K Tons), by Country 2024 & 2032
- Figure 17: South America Polyurea Industry Revenue Share (%), by Country 2024 & 2032
- Figure 18: South America Polyurea Industry Volume Share (%), by Country 2024 & 2032
- Figure 19: MEA Polyurea Industry Revenue (Million), by Country 2024 & 2032
- Figure 20: MEA Polyurea Industry Volume (K Tons), by Country 2024 & 2032
- Figure 21: MEA Polyurea Industry Revenue Share (%), by Country 2024 & 2032
- Figure 22: MEA Polyurea Industry Volume Share (%), by Country 2024 & 2032
- Figure 23: Asia Pacific Polyurea Industry Revenue (Million), by Chemical Structure 2024 & 2032
- Figure 24: Asia Pacific Polyurea Industry Volume (K Tons), by Chemical Structure 2024 & 2032
- Figure 25: Asia Pacific Polyurea Industry Revenue Share (%), by Chemical Structure 2024 & 2032
- Figure 26: Asia Pacific Polyurea Industry Volume Share (%), by Chemical Structure 2024 & 2032
- Figure 27: Asia Pacific Polyurea Industry Revenue (Million), by Type 2024 & 2032
- Figure 28: Asia Pacific Polyurea Industry Volume (K Tons), by Type 2024 & 2032
- Figure 29: Asia Pacific Polyurea Industry Revenue Share (%), by Type 2024 & 2032
- Figure 30: Asia Pacific Polyurea Industry Volume Share (%), by Type 2024 & 2032
- Figure 31: Asia Pacific Polyurea Industry Revenue (Million), by Product 2024 & 2032
- Figure 32: Asia Pacific Polyurea Industry Volume (K Tons), by Product 2024 & 2032
- Figure 33: Asia Pacific Polyurea Industry Revenue Share (%), by Product 2024 & 2032
- Figure 34: Asia Pacific Polyurea Industry Volume Share (%), by Product 2024 & 2032
- Figure 35: Asia Pacific Polyurea Industry Revenue (Million), by End-user Industry 2024 & 2032
- Figure 36: Asia Pacific Polyurea Industry Volume (K Tons), by End-user Industry 2024 & 2032
- Figure 37: Asia Pacific Polyurea Industry Revenue Share (%), by End-user Industry 2024 & 2032
- Figure 38: Asia Pacific Polyurea Industry Volume Share (%), by End-user Industry 2024 & 2032
- Figure 39: Asia Pacific Polyurea Industry Revenue (Million), by Country 2024 & 2032
- Figure 40: Asia Pacific Polyurea Industry Volume (K Tons), by Country 2024 & 2032
- Figure 41: Asia Pacific Polyurea Industry Revenue Share (%), by Country 2024 & 2032
- Figure 42: Asia Pacific Polyurea Industry Volume Share (%), by Country 2024 & 2032
- Figure 43: North America Polyurea Industry Revenue (Million), by Chemical Structure 2024 & 2032
- Figure 44: North America Polyurea Industry Volume (K Tons), by Chemical Structure 2024 & 2032
- Figure 45: North America Polyurea Industry Revenue Share (%), by Chemical Structure 2024 & 2032
- Figure 46: North America Polyurea Industry Volume Share (%), by Chemical Structure 2024 & 2032
- Figure 47: North America Polyurea Industry Revenue (Million), by Type 2024 & 2032
- Figure 48: North America Polyurea Industry Volume (K Tons), by Type 2024 & 2032
- Figure 49: North America Polyurea Industry Revenue Share (%), by Type 2024 & 2032
- Figure 50: North America Polyurea Industry Volume Share (%), by Type 2024 & 2032
- Figure 51: North America Polyurea Industry Revenue (Million), by Product 2024 & 2032
- Figure 52: North America Polyurea Industry Volume (K Tons), by Product 2024 & 2032
- Figure 53: North America Polyurea Industry Revenue Share (%), by Product 2024 & 2032
- Figure 54: North America Polyurea Industry Volume Share (%), by Product 2024 & 2032
- Figure 55: North America Polyurea Industry Revenue (Million), by End-user Industry 2024 & 2032
- Figure 56: North America Polyurea Industry Volume (K Tons), by End-user Industry 2024 & 2032
- Figure 57: North America Polyurea Industry Revenue Share (%), by End-user Industry 2024 & 2032
- Figure 58: North America Polyurea Industry Volume Share (%), by End-user Industry 2024 & 2032
- Figure 59: North America Polyurea Industry Revenue (Million), by Country 2024 & 2032
- Figure 60: North America Polyurea Industry Volume (K Tons), by Country 2024 & 2032
- Figure 61: North America Polyurea Industry Revenue Share (%), by Country 2024 & 2032
- Figure 62: North America Polyurea Industry Volume Share (%), by Country 2024 & 2032
- Figure 63: Europe Polyurea Industry Revenue (Million), by Chemical Structure 2024 & 2032
- Figure 64: Europe Polyurea Industry Volume (K Tons), by Chemical Structure 2024 & 2032
- Figure 65: Europe Polyurea Industry Revenue Share (%), by Chemical Structure 2024 & 2032
- Figure 66: Europe Polyurea Industry Volume Share (%), by Chemical Structure 2024 & 2032
- Figure 67: Europe Polyurea Industry Revenue (Million), by Type 2024 & 2032
- Figure 68: Europe Polyurea Industry Volume (K Tons), by Type 2024 & 2032
- Figure 69: Europe Polyurea Industry Revenue Share (%), by Type 2024 & 2032
- Figure 70: Europe Polyurea Industry Volume Share (%), by Type 2024 & 2032
- Figure 71: Europe Polyurea Industry Revenue (Million), by Product 2024 & 2032
- Figure 72: Europe Polyurea Industry Volume (K Tons), by Product 2024 & 2032
- Figure 73: Europe Polyurea Industry Revenue Share (%), by Product 2024 & 2032
- Figure 74: Europe Polyurea Industry Volume Share (%), by Product 2024 & 2032
- Figure 75: Europe Polyurea Industry Revenue (Million), by End-user Industry 2024 & 2032
- Figure 76: Europe Polyurea Industry Volume (K Tons), by End-user Industry 2024 & 2032
- Figure 77: Europe Polyurea Industry Revenue Share (%), by End-user Industry 2024 & 2032
- Figure 78: Europe Polyurea Industry Volume Share (%), by End-user Industry 2024 & 2032
- Figure 79: Europe Polyurea Industry Revenue (Million), by Country 2024 & 2032
- Figure 80: Europe Polyurea Industry Volume (K Tons), by Country 2024 & 2032
- Figure 81: Europe Polyurea Industry Revenue Share (%), by Country 2024 & 2032
- Figure 82: Europe Polyurea Industry Volume Share (%), by Country 2024 & 2032
- Figure 83: South America Polyurea Industry Revenue (Million), by Chemical Structure 2024 & 2032
- Figure 84: South America Polyurea Industry Volume (K Tons), by Chemical Structure 2024 & 2032
- Figure 85: South America Polyurea Industry Revenue Share (%), by Chemical Structure 2024 & 2032
- Figure 86: South America Polyurea Industry Volume Share (%), by Chemical Structure 2024 & 2032
- Figure 87: South America Polyurea Industry Revenue (Million), by Type 2024 & 2032
- Figure 88: South America Polyurea Industry Volume (K Tons), by Type 2024 & 2032
- Figure 89: South America Polyurea Industry Revenue Share (%), by Type 2024 & 2032
- Figure 90: South America Polyurea Industry Volume Share (%), by Type 2024 & 2032
- Figure 91: South America Polyurea Industry Revenue (Million), by Product 2024 & 2032
- Figure 92: South America Polyurea Industry Volume (K Tons), by Product 2024 & 2032
- Figure 93: South America Polyurea Industry Revenue Share (%), by Product 2024 & 2032
- Figure 94: South America Polyurea Industry Volume Share (%), by Product 2024 & 2032
- Figure 95: South America Polyurea Industry Revenue (Million), by End-user Industry 2024 & 2032
- Figure 96: South America Polyurea Industry Volume (K Tons), by End-user Industry 2024 & 2032
- Figure 97: South America Polyurea Industry Revenue Share (%), by End-user Industry 2024 & 2032
- Figure 98: South America Polyurea Industry Volume Share (%), by End-user Industry 2024 & 2032
- Figure 99: South America Polyurea Industry Revenue (Million), by Country 2024 & 2032
- Figure 100: South America Polyurea Industry Volume (K Tons), by Country 2024 & 2032
- Figure 101: South America Polyurea Industry Revenue Share (%), by Country 2024 & 2032
- Figure 102: South America Polyurea Industry Volume Share (%), by Country 2024 & 2032
- Figure 103: Middle East and Africa Polyurea Industry Revenue (Million), by Chemical Structure 2024 & 2032
- Figure 104: Middle East and Africa Polyurea Industry Volume (K Tons), by Chemical Structure 2024 & 2032
- Figure 105: Middle East and Africa Polyurea Industry Revenue Share (%), by Chemical Structure 2024 & 2032
- Figure 106: Middle East and Africa Polyurea Industry Volume Share (%), by Chemical Structure 2024 & 2032
- Figure 107: Middle East and Africa Polyurea Industry Revenue (Million), by Type 2024 & 2032
- Figure 108: Middle East and Africa Polyurea Industry Volume (K Tons), by Type 2024 & 2032
- Figure 109: Middle East and Africa Polyurea Industry Revenue Share (%), by Type 2024 & 2032
- Figure 110: Middle East and Africa Polyurea Industry Volume Share (%), by Type 2024 & 2032
- Figure 111: Middle East and Africa Polyurea Industry Revenue (Million), by Product 2024 & 2032
- Figure 112: Middle East and Africa Polyurea Industry Volume (K Tons), by Product 2024 & 2032
- Figure 113: Middle East and Africa Polyurea Industry Revenue Share (%), by Product 2024 & 2032
- Figure 114: Middle East and Africa Polyurea Industry Volume Share (%), by Product 2024 & 2032
- Figure 115: Middle East and Africa Polyurea Industry Revenue (Million), by End-user Industry 2024 & 2032
- Figure 116: Middle East and Africa Polyurea Industry Volume (K Tons), by End-user Industry 2024 & 2032
- Figure 117: Middle East and Africa Polyurea Industry Revenue Share (%), by End-user Industry 2024 & 2032
- Figure 118: Middle East and Africa Polyurea Industry Volume Share (%), by End-user Industry 2024 & 2032
- Figure 119: Middle East and Africa Polyurea Industry Revenue (Million), by Country 2024 & 2032
- Figure 120: Middle East and Africa Polyurea Industry Volume (K Tons), by Country 2024 & 2032
- Figure 121: Middle East and Africa Polyurea Industry Revenue Share (%), by Country 2024 & 2032
- Figure 122: Middle East and Africa Polyurea Industry Volume Share (%), by Country 2024 & 2032
List of Tables
- Table 1: Global Polyurea Industry Revenue Million Forecast, by Region 2019 & 2032
- Table 2: Global Polyurea Industry Volume K Tons Forecast, by Region 2019 & 2032
- Table 3: Global Polyurea Industry Revenue Million Forecast, by Chemical Structure 2019 & 2032
- Table 4: Global Polyurea Industry Volume K Tons Forecast, by Chemical Structure 2019 & 2032
- Table 5: Global Polyurea Industry Revenue Million Forecast, by Type 2019 & 2032
- Table 6: Global Polyurea Industry Volume K Tons Forecast, by Type 2019 & 2032
- Table 7: Global Polyurea Industry Revenue Million Forecast, by Product 2019 & 2032
- Table 8: Global Polyurea Industry Volume K Tons Forecast, by Product 2019 & 2032
- Table 9: Global Polyurea Industry Revenue Million Forecast, by End-user Industry 2019 & 2032
- Table 10: Global Polyurea Industry Volume K Tons Forecast, by End-user Industry 2019 & 2032
- Table 11: Global Polyurea Industry Revenue Million Forecast, by Region 2019 & 2032
- Table 12: Global Polyurea Industry Volume K Tons Forecast, by Region 2019 & 2032
- Table 13: Global Polyurea Industry Revenue Million Forecast, by Country 2019 & 2032
- Table 14: Global Polyurea Industry Volume K Tons Forecast, by Country 2019 & 2032
- Table 15: United States Polyurea Industry Revenue (Million) Forecast, by Application 2019 & 2032
- Table 16: United States Polyurea Industry Volume (K Tons) Forecast, by Application 2019 & 2032
- Table 17: Canada Polyurea Industry Revenue (Million) Forecast, by Application 2019 & 2032
- Table 18: Canada Polyurea Industry Volume (K Tons) Forecast, by Application 2019 & 2032
- Table 19: Mexico Polyurea Industry Revenue (Million) Forecast, by Application 2019 & 2032
- Table 20: Mexico Polyurea Industry Volume (K Tons) Forecast, by Application 2019 & 2032
- Table 21: Global Polyurea Industry Revenue Million Forecast, by Country 2019 & 2032
- Table 22: Global Polyurea Industry Volume K Tons Forecast, by Country 2019 & 2032
- Table 23: Germany Polyurea Industry Revenue (Million) Forecast, by Application 2019 & 2032
- Table 24: Germany Polyurea Industry Volume (K Tons) Forecast, by Application 2019 & 2032
- Table 25: France Polyurea Industry Revenue (Million) Forecast, by Application 2019 & 2032
- Table 26: France Polyurea Industry Volume (K Tons) Forecast, by Application 2019 & 2032
- Table 27: Italy Polyurea Industry Revenue (Million) Forecast, by Application 2019 & 2032
- Table 28: Italy Polyurea Industry Volume (K Tons) Forecast, by Application 2019 & 2032
- Table 29: United Kingdom Polyurea Industry Revenue (Million) Forecast, by Application 2019 & 2032
- Table 30: United Kingdom Polyurea Industry Volume (K Tons) Forecast, by Application 2019 & 2032
- Table 31: Netherlands Polyurea Industry Revenue (Million) Forecast, by Application 2019 & 2032
- Table 32: Netherlands Polyurea Industry Volume (K Tons) Forecast, by Application 2019 & 2032
- Table 33: Rest of Europe Polyurea Industry Revenue (Million) Forecast, by Application 2019 & 2032
- Table 34: Rest of Europe Polyurea Industry Volume (K Tons) Forecast, by Application 2019 & 2032
- Table 35: Global Polyurea Industry Revenue Million Forecast, by Country 2019 & 2032
- Table 36: Global Polyurea Industry Volume K Tons Forecast, by Country 2019 & 2032
- Table 37: China Polyurea Industry Revenue (Million) Forecast, by Application 2019 & 2032
- Table 38: China Polyurea Industry Volume (K Tons) Forecast, by Application 2019 & 2032
- Table 39: Japan Polyurea Industry Revenue (Million) Forecast, by Application 2019 & 2032
- Table 40: Japan Polyurea Industry Volume (K Tons) Forecast, by Application 2019 & 2032
- Table 41: India Polyurea Industry Revenue (Million) Forecast, by Application 2019 & 2032
- Table 42: India Polyurea Industry Volume (K Tons) Forecast, by Application 2019 & 2032
- Table 43: South Korea Polyurea Industry Revenue (Million) Forecast, by Application 2019 & 2032
- Table 44: South Korea Polyurea Industry Volume (K Tons) Forecast, by Application 2019 & 2032
- Table 45: Taiwan Polyurea Industry Revenue (Million) Forecast, by Application 2019 & 2032
- Table 46: Taiwan Polyurea Industry Volume (K Tons) Forecast, by Application 2019 & 2032
- Table 47: Australia Polyurea Industry Revenue (Million) Forecast, by Application 2019 & 2032
- Table 48: Australia Polyurea Industry Volume (K Tons) Forecast, by Application 2019 & 2032
- Table 49: Rest of Asia-Pacific Polyurea Industry Revenue (Million) Forecast, by Application 2019 & 2032
- Table 50: Rest of Asia-Pacific Polyurea Industry Volume (K Tons) Forecast, by Application 2019 & 2032
- Table 51: Global Polyurea Industry Revenue Million Forecast, by Country 2019 & 2032
- Table 52: Global Polyurea Industry Volume K Tons Forecast, by Country 2019 & 2032
- Table 53: Brazil Polyurea Industry Revenue (Million) Forecast, by Application 2019 & 2032
- Table 54: Brazil Polyurea Industry Volume (K Tons) Forecast, by Application 2019 & 2032
- Table 55: Argentina Polyurea Industry Revenue (Million) Forecast, by Application 2019 & 2032
- Table 56: Argentina Polyurea Industry Volume (K Tons) Forecast, by Application 2019 & 2032
- Table 57: Rest of South America Polyurea Industry Revenue (Million) Forecast, by Application 2019 & 2032
- Table 58: Rest of South America Polyurea Industry Volume (K Tons) Forecast, by Application 2019 & 2032
- Table 59: Global Polyurea Industry Revenue Million Forecast, by Country 2019 & 2032
- Table 60: Global Polyurea Industry Volume K Tons Forecast, by Country 2019 & 2032
- Table 61: Middle East Polyurea Industry Revenue (Million) Forecast, by Application 2019 & 2032
- Table 62: Middle East Polyurea Industry Volume (K Tons) Forecast, by Application 2019 & 2032
- Table 63: Africa Polyurea Industry Revenue (Million) Forecast, by Application 2019 & 2032
- Table 64: Africa Polyurea Industry Volume (K Tons) Forecast, by Application 2019 & 2032
- Table 65: Global Polyurea Industry Revenue Million Forecast, by Chemical Structure 2019 & 2032
- Table 66: Global Polyurea Industry Volume K Tons Forecast, by Chemical Structure 2019 & 2032
- Table 67: Global Polyurea Industry Revenue Million Forecast, by Type 2019 & 2032
- Table 68: Global Polyurea Industry Volume K Tons Forecast, by Type 2019 & 2032
- Table 69: Global Polyurea Industry Revenue Million Forecast, by Product 2019 & 2032
- Table 70: Global Polyurea Industry Volume K Tons Forecast, by Product 2019 & 2032
- Table 71: Global Polyurea Industry Revenue Million Forecast, by End-user Industry 2019 & 2032
- Table 72: Global Polyurea Industry Volume K Tons Forecast, by End-user Industry 2019 & 2032
- Table 73: Global Polyurea Industry Revenue Million Forecast, by Country 2019 & 2032
- Table 74: Global Polyurea Industry Volume K Tons Forecast, by Country 2019 & 2032
- Table 75: China Polyurea Industry Revenue (Million) Forecast, by Application 2019 & 2032
- Table 76: China Polyurea Industry Volume (K Tons) Forecast, by Application 2019 & 2032
- Table 77: India Polyurea Industry Revenue (Million) Forecast, by Application 2019 & 2032
- Table 78: India Polyurea Industry Volume (K Tons) Forecast, by Application 2019 & 2032
- Table 79: Japan Polyurea Industry Revenue (Million) Forecast, by Application 2019 & 2032
- Table 80: Japan Polyurea Industry Volume (K Tons) Forecast, by Application 2019 & 2032
- Table 81: South Korea Polyurea Industry Revenue (Million) Forecast, by Application 2019 & 2032
- Table 82: South Korea Polyurea Industry Volume (K Tons) Forecast, by Application 2019 & 2032
- Table 83: Rest of Asia Pacific Polyurea Industry Revenue (Million) Forecast, by Application 2019 & 2032
- Table 84: Rest of Asia Pacific Polyurea Industry Volume (K Tons) Forecast, by Application 2019 & 2032
- Table 85: Global Polyurea Industry Revenue Million Forecast, by Chemical Structure 2019 & 2032
- Table 86: Global Polyurea Industry Volume K Tons Forecast, by Chemical Structure 2019 & 2032
- Table 87: Global Polyurea Industry Revenue Million Forecast, by Type 2019 & 2032
- Table 88: Global Polyurea Industry Volume K Tons Forecast, by Type 2019 & 2032
- Table 89: Global Polyurea Industry Revenue Million Forecast, by Product 2019 & 2032
- Table 90: Global Polyurea Industry Volume K Tons Forecast, by Product 2019 & 2032
- Table 91: Global Polyurea Industry Revenue Million Forecast, by End-user Industry 2019 & 2032
- Table 92: Global Polyurea Industry Volume K Tons Forecast, by End-user Industry 2019 & 2032
- Table 93: Global Polyurea Industry Revenue Million Forecast, by Country 2019 & 2032
- Table 94: Global Polyurea Industry Volume K Tons Forecast, by Country 2019 & 2032
- Table 95: United States Polyurea Industry Revenue (Million) Forecast, by Application 2019 & 2032
- Table 96: United States Polyurea Industry Volume (K Tons) Forecast, by Application 2019 & 2032
- Table 97: Canada Polyurea Industry Revenue (Million) Forecast, by Application 2019 & 2032
- Table 98: Canada Polyurea Industry Volume (K Tons) Forecast, by Application 2019 & 2032
- Table 99: Mexico Polyurea Industry Revenue (Million) Forecast, by Application 2019 & 2032
- Table 100: Mexico Polyurea Industry Volume (K Tons) Forecast, by Application 2019 & 2032
- Table 101: Global Polyurea Industry Revenue Million Forecast, by Chemical Structure 2019 & 2032
- Table 102: Global Polyurea Industry Volume K Tons Forecast, by Chemical Structure 2019 & 2032
- Table 103: Global Polyurea Industry Revenue Million Forecast, by Type 2019 & 2032
- Table 104: Global Polyurea Industry Volume K Tons Forecast, by Type 2019 & 2032
- Table 105: Global Polyurea Industry Revenue Million Forecast, by Product 2019 & 2032
- Table 106: Global Polyurea Industry Volume K Tons Forecast, by Product 2019 & 2032
- Table 107: Global Polyurea Industry Revenue Million Forecast, by End-user Industry 2019 & 2032
- Table 108: Global Polyurea Industry Volume K Tons Forecast, by End-user Industry 2019 & 2032
- Table 109: Global Polyurea Industry Revenue Million Forecast, by Country 2019 & 2032
- Table 110: Global Polyurea Industry Volume K Tons Forecast, by Country 2019 & 2032
- Table 111: Germany Polyurea Industry Revenue (Million) Forecast, by Application 2019 & 2032
- Table 112: Germany Polyurea Industry Volume (K Tons) Forecast, by Application 2019 & 2032
- Table 113: United Kingdom Polyurea Industry Revenue (Million) Forecast, by Application 2019 & 2032
- Table 114: United Kingdom Polyurea Industry Volume (K Tons) Forecast, by Application 2019 & 2032
- Table 115: France Polyurea Industry Revenue (Million) Forecast, by Application 2019 & 2032
- Table 116: France Polyurea Industry Volume (K Tons) Forecast, by Application 2019 & 2032
- Table 117: Italy Polyurea Industry Revenue (Million) Forecast, by Application 2019 & 2032
- Table 118: Italy Polyurea Industry Volume (K Tons) Forecast, by Application 2019 & 2032
- Table 119: Rest of Europe Polyurea Industry Revenue (Million) Forecast, by Application 2019 & 2032
- Table 120: Rest of Europe Polyurea Industry Volume (K Tons) Forecast, by Application 2019 & 2032
- Table 121: Global Polyurea Industry Revenue Million Forecast, by Chemical Structure 2019 & 2032
- Table 122: Global Polyurea Industry Volume K Tons Forecast, by Chemical Structure 2019 & 2032
- Table 123: Global Polyurea Industry Revenue Million Forecast, by Type 2019 & 2032
- Table 124: Global Polyurea Industry Volume K Tons Forecast, by Type 2019 & 2032
- Table 125: Global Polyurea Industry Revenue Million Forecast, by Product 2019 & 2032
- Table 126: Global Polyurea Industry Volume K Tons Forecast, by Product 2019 & 2032
- Table 127: Global Polyurea Industry Revenue Million Forecast, by End-user Industry 2019 & 2032
- Table 128: Global Polyurea Industry Volume K Tons Forecast, by End-user Industry 2019 & 2032
- Table 129: Global Polyurea Industry Revenue Million Forecast, by Country 2019 & 2032
- Table 130: Global Polyurea Industry Volume K Tons Forecast, by Country 2019 & 2032
- Table 131: Brazil Polyurea Industry Revenue (Million) Forecast, by Application 2019 & 2032
- Table 132: Brazil Polyurea Industry Volume (K Tons) Forecast, by Application 2019 & 2032
- Table 133: Argentina Polyurea Industry Revenue (Million) Forecast, by Application 2019 & 2032
- Table 134: Argentina Polyurea Industry Volume (K Tons) Forecast, by Application 2019 & 2032
- Table 135: Rest of South America Polyurea Industry Revenue (Million) Forecast, by Application 2019 & 2032
- Table 136: Rest of South America Polyurea Industry Volume (K Tons) Forecast, by Application 2019 & 2032
- Table 137: Global Polyurea Industry Revenue Million Forecast, by Chemical Structure 2019 & 2032
- Table 138: Global Polyurea Industry Volume K Tons Forecast, by Chemical Structure 2019 & 2032
- Table 139: Global Polyurea Industry Revenue Million Forecast, by Type 2019 & 2032
- Table 140: Global Polyurea Industry Volume K Tons Forecast, by Type 2019 & 2032
- Table 141: Global Polyurea Industry Revenue Million Forecast, by Product 2019 & 2032
- Table 142: Global Polyurea Industry Volume K Tons Forecast, by Product 2019 & 2032
- Table 143: Global Polyurea Industry Revenue Million Forecast, by End-user Industry 2019 & 2032
- Table 144: Global Polyurea Industry Volume K Tons Forecast, by End-user Industry 2019 & 2032
- Table 145: Global Polyurea Industry Revenue Million Forecast, by Country 2019 & 2032
- Table 146: Global Polyurea Industry Volume K Tons Forecast, by Country 2019 & 2032
- Table 147: Saudi Arabia Polyurea Industry Revenue (Million) Forecast, by Application 2019 & 2032
- Table 148: Saudi Arabia Polyurea Industry Volume (K Tons) Forecast, by Application 2019 & 2032
- Table 149: South Africa Polyurea Industry Revenue (Million) Forecast, by Application 2019 & 2032
- Table 150: South Africa Polyurea Industry Volume (K Tons) Forecast, by Application 2019 & 2032
- Table 151: Rest of Middle East and Africa Polyurea Industry Revenue (Million) Forecast, by Application 2019 & 2032
- Table 152: Rest of Middle East and Africa Polyurea Industry Volume (K Tons) Forecast, by Application 2019 & 2032
Frequently Asked Questions
1. What is the projected Compound Annual Growth Rate (CAGR) of the Polyurea Industry?
The projected CAGR is approximately > 5.60%.
2. Which companies are prominent players in the Polyurea Industry?
Key companies in the market include SATYEN POLYMERS PVT LTD (TEVO), Dorf Ketal, Rhino Linings Corporation, CITADEL FLOORS, Huntsman International LLC, Elastothane, Speciality Products Inc, Teknos Group, Lonza, Covestro AG, Armorthane.
3. What are the main segments of the Polyurea Industry?
The market segments include Chemical Structure, Type, Product, End-user Industry.
4. Can you provide details about the market size?
The market size is estimated to be USD 1.02 Million as of 2022.
5. What are some drivers contributing to market growth?
Growing Demand of Polyurea from Construction Industry; Growing Demand from Automotive Sector; Other Drivers.
6. What are the notable trends driving market growth?
Growing Demand for Polyurea from the Construction Industry.
7. Are there any restraints impacting market growth?
Volatility in Raw Material Price; Other Restraints.
8. Can you provide examples of recent developments in the market?
January 2023: Teknos Deutschland GmbH plans to relocate its production from Fulda to the existing Brüggen site. The relocation aims to develop further the production and delivery capabilities of Teknos Deutschland GmbH in Germany. This enhancement of production capabilities is likely to boost the market for polyurea in Germany.
9. What pricing options are available for accessing the report?
Pricing options include single-user, multi-user, and enterprise licenses priced at USD 4750, USD 5250, and USD 8750 respectively.
10. Is the market size provided in terms of value or volume?
The market size is provided in terms of value, measured in Million and volume, measured in K Tons.
11. Are there any specific market keywords associated with the report?
Yes, the market keyword associated with the report is "Polyurea Industry," which aids in identifying and referencing the specific market segment covered.
12. How do I determine which pricing option suits my needs best?
The pricing options vary based on user requirements and access needs. Individual users may opt for single-user licenses, while businesses requiring broader access may choose multi-user or enterprise licenses for cost-effective access to the report.
13. Are there any additional resources or data provided in the Polyurea Industry report?
While the report offers comprehensive insights, it's advisable to review the specific contents or supplementary materials provided to ascertain if additional resources or data are available.
14. How can I stay updated on further developments or reports in the Polyurea Industry?
To stay informed about further developments, trends, and reports in the Polyurea Industry, consider subscribing to industry newsletters, following relevant companies and organizations, or regularly checking reputable industry news sources and publications.
Methodology
Step 1 - Identification of Relevant Samples Size from Population Database


Step 2 - Approaches for Defining Global Market Size (Value, Volume* & Price*)

Note*: In applicable scenarios
Step 3 - Data Sources
Primary Research
- Web Analytics
- Survey Reports
- Research Institute
- Latest Research Reports
- Opinion Leaders
Secondary Research
- Annual Reports
- White Paper
- Latest Press Release
- Industry Association
- Paid Database
- Investor Presentations

Step 4 - Data Triangulation
Involves using different sources of information in order to increase the validity of a study
These sources are likely to be stakeholders in a program - participants, other researchers, program staff, other community members, and so on.
Then we put all data in single framework & apply various statistical tools to find out the dynamic on the market.
During the analysis stage, feedback from the stakeholder groups would be compared to determine areas of agreement as well as areas of divergence


