
Key Insights
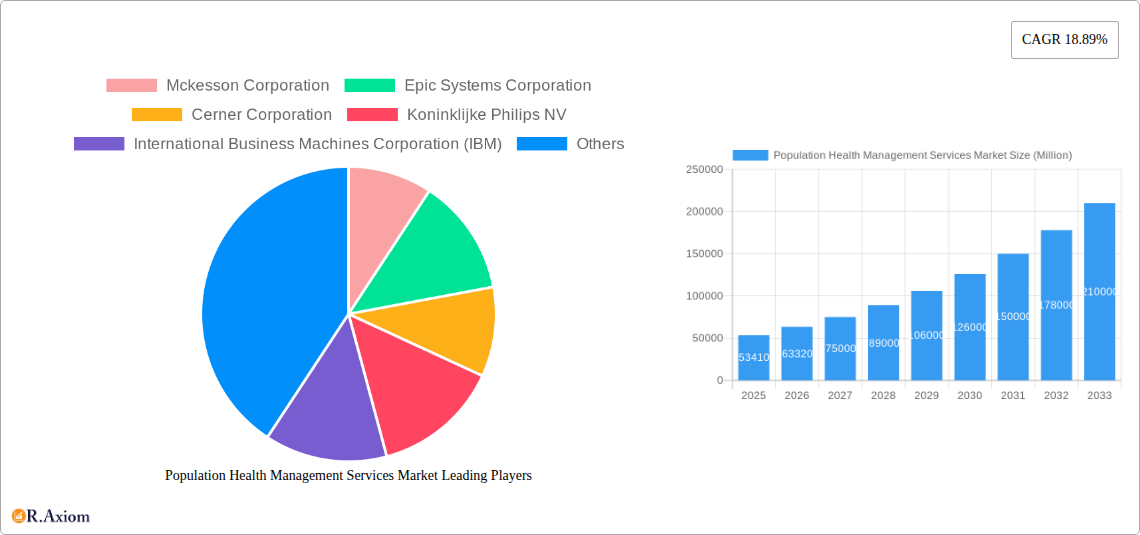
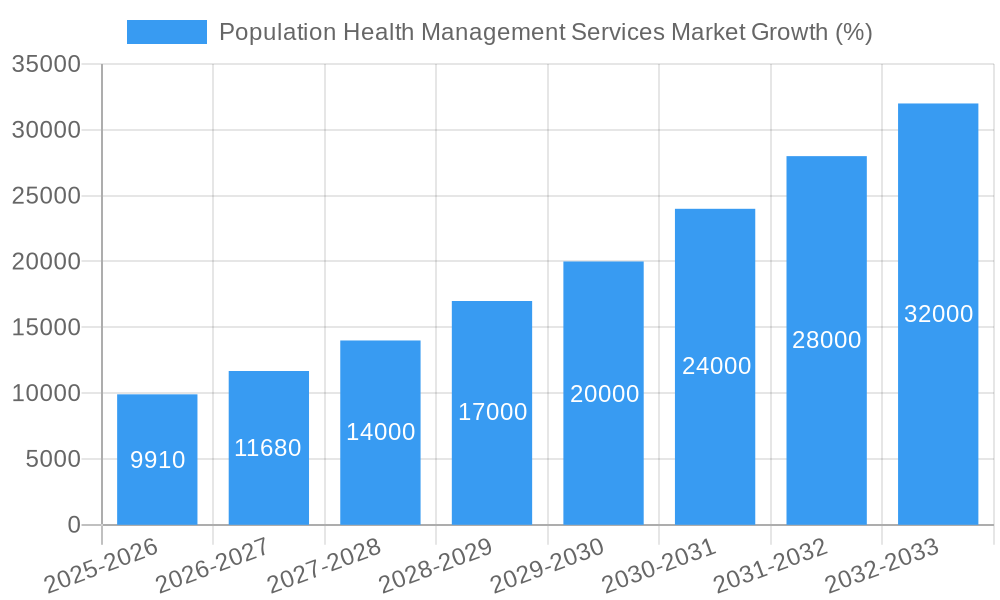
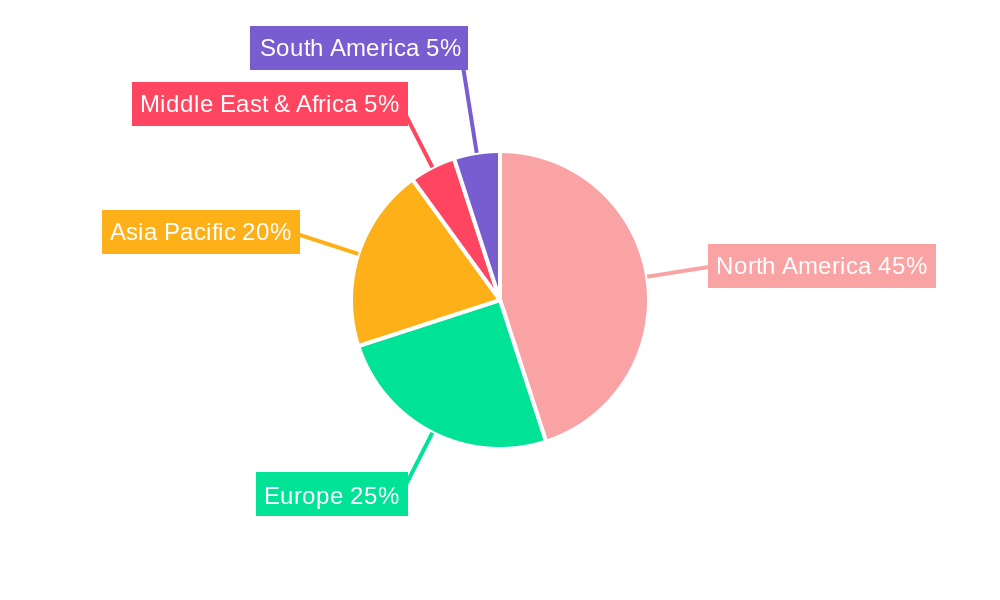
The Population Health Management (PHM) services market is experiencing robust growth, projected to reach a market size of $53.41 billion in 2025 and exhibiting a Compound Annual Growth Rate (CAGR) of 18.89% from 2025 to 2033. This expansion is driven by several key factors. Increasing prevalence of chronic diseases necessitates proactive and preventative healthcare approaches, fueling demand for PHM solutions. Furthermore, the rising adoption of electronic health records (EHRs) and advancements in data analytics are enabling more effective population health management strategies. Government initiatives promoting value-based care and reimbursement models are further incentivizing the widespread adoption of PHM technologies and services. The market is segmented by component (software, hardware, services), delivery mode (on-premise, cloud-based/web-based), and end-user (payers, providers). The cloud-based/web-based segment is expected to witness significant growth due to its scalability, accessibility, and cost-effectiveness. Providers are a major end-user segment, actively investing in PHM to improve patient outcomes and operational efficiency. Geographically, North America currently holds a significant market share, driven by advanced healthcare infrastructure and early adoption of PHM technologies. However, the Asia-Pacific region is anticipated to show substantial growth in the coming years due to increasing healthcare spending and rising awareness of population health management benefits. Key players like McKesson, Epic Systems, Cerner, and IBM are driving innovation and competition within the market.
The continued growth trajectory of the PHM market is contingent upon several factors. Successful integration of PHM solutions with existing healthcare infrastructure will be crucial. Addressing data privacy and security concerns associated with handling sensitive patient data is paramount. Furthermore, overcoming challenges related to interoperability between different healthcare systems and achieving widespread clinician adoption of PHM tools will be essential for realizing the full potential of the market. The market's future success hinges on the ability of vendors to provide comprehensive, user-friendly, and cost-effective solutions that cater to the diverse needs of payers and providers across various geographic regions. The sustained focus on improving patient outcomes through proactive and personalized care will remain a primary driver of market growth.
Population Health Management Services Market: A Comprehensive Report (2019-2033)
This comprehensive report provides an in-depth analysis of the Population Health Management Services market, offering valuable insights for stakeholders, investors, and industry professionals. The study covers the period from 2019 to 2033, with 2025 as the base and estimated year. The report uses a robust methodology to forecast market trends and growth drivers, offering actionable intelligence for strategic decision-making. The market is segmented by component (Software, Hardware, Services), delivery mode (On-premise, Cloud-based/Web-based), and end-user (Payers, Providers). Key players analyzed include McKesson Corporation, Epic Systems Corporation, Cerner Corporation, Koninklijke Philips NV, International Business Machines Corporation (IBM), Optum Inc, Health Catalyst, Allscripts Healthcare Solutions Inc, and Conifer Health Solutions. The report projects a market value of xx Million by 2033, exhibiting a CAGR of xx% during the forecast period (2025-2033).
Population Health Management Services Market Concentration & Innovation
The Population Health Management Services market exhibits a moderately concentrated landscape, with a few major players holding significant market share. McKesson Corporation and Epic Systems Corporation, for instance, together account for an estimated xx% of the market in 2025. However, the market is also characterized by significant innovation, driven by the need for improved healthcare outcomes and cost efficiency. This innovation manifests in areas such as AI-powered predictive analytics, remote patient monitoring technologies, and personalized medicine initiatives.
- Market Share (2025 Estimate): McKesson Corporation (xx%), Epic Systems Corporation (xx%), Cerner Corporation (xx%), Others (xx%).
- Innovation Drivers: Advancements in data analytics, AI, and IoT; increasing demand for value-based care; government regulations promoting interoperability.
- Regulatory Frameworks: HIPAA compliance, interoperability standards, and data privacy regulations significantly influence market dynamics. The evolving regulatory landscape presents both challenges and opportunities for market participants.
- M&A Activities: The historical period (2019-2024) witnessed xx M&A deals valued at an estimated xx Million, reflecting consolidation and expansion strategies among market players. Larger players are actively acquiring smaller companies with specialized technologies or market reach.
- Product Substitutes: While direct substitutes are limited, alternative approaches like traditional healthcare management practices exert competitive pressure.
- End-User Trends: Providers are increasingly adopting cloud-based solutions for scalability and cost-effectiveness, while payers are prioritizing data-driven insights for risk management and population health initiatives.
Population Health Management Services Market Industry Trends & Insights
The Population Health Management Services market is experiencing robust growth, fueled by several key factors. The rising prevalence of chronic diseases, the increasing focus on preventative care, and the shift towards value-based care models are primary drivers. Technological advancements, particularly in big data analytics and artificial intelligence (AI), are transforming how healthcare providers manage populations. Furthermore, government initiatives promoting interoperability and data sharing are accelerating market expansion. The market penetration of cloud-based solutions is rapidly increasing, driven by the need for scalability and accessibility. Consumer preferences are also shifting towards personalized and proactive healthcare services, fostering demand for sophisticated population health management solutions. The competitive dynamics are shaped by a blend of established players and emerging technology providers vying for market share. The market is expected to reach xx Million by 2033, exhibiting a significant CAGR of xx% during the forecast period.
Dominant Markets & Segments in Population Health Management Services Market
The North American market currently dominates the global Population Health Management Services market, driven by robust healthcare infrastructure, advanced technological adoption, and supportive regulatory frameworks. Within this region, the United States holds the largest market share, fueled by factors such as high healthcare expenditure and a substantial investment in health IT.
- Key Drivers in North America:
- High prevalence of chronic diseases.
- Significant investments in healthcare IT infrastructure.
- Favorable government policies promoting value-based care.
- Strong presence of major market players.
Segment Dominance:
- Component: The Software segment holds the largest market share due to the increasing adoption of advanced analytics platforms and population health management software.
- Delivery Mode: Cloud-based/Web-based solutions are rapidly gaining traction due to their scalability, cost-effectiveness, and accessibility.
- End-User: Providers are the primary adopters of population health management services, driven by the need to improve patient outcomes and manage rising healthcare costs. Payers are increasingly leveraging these services to manage risk and optimize healthcare spending.
Population Health Management Services Market Product Developments
Recent product innovations include AI-powered predictive analytics tools, integrated patient portals for enhanced engagement, and wearable sensor technology for remote patient monitoring. These developments are designed to improve care coordination, reduce hospital readmissions, and enhance the overall patient experience. The competitive advantage in this market hinges on the ability to offer robust analytics, seamless integration with existing healthcare systems, and personalized user interfaces. The trend is toward offering comprehensive, integrated platforms that address multiple aspects of population health management.
Report Scope & Segmentation Analysis
This report provides a comprehensive analysis of the Population Health Management Services market, segmented by component (Software, Hardware, Services), delivery mode (On-premise, Cloud-based/Web-based), and end-user (Payers, Providers). Each segment's growth projections, market size, and competitive dynamics are detailed within the report. For example, the software segment is expected to witness significant growth driven by increasing demand for advanced analytics and data management capabilities. The cloud-based delivery mode is projected to experience rapid expansion due to its scalability and cost-effectiveness. Providers are expected to remain the dominant end-user segment, with payers showing increasing adoption.
Key Drivers of Population Health Management Services Market Growth
Several factors drive market growth, including the rising prevalence of chronic diseases, technological advancements in data analytics and AI, the increasing focus on preventative care and value-based care models, favorable government regulations promoting interoperability and data sharing, and the growing adoption of cloud-based solutions. These factors collectively contribute to an expanding market for sophisticated population health management tools and services.
Challenges in the Population Health Management Services Market Sector
Challenges include interoperability issues between different healthcare systems, concerns about data privacy and security, the need for skilled professionals to manage complex data sets, and the high initial investment costs associated with implementing new technologies. These factors can hinder market adoption, particularly among smaller healthcare providers. The cost of data integration and maintenance can also pose a challenge, negatively impacting adoption and ROI.
Emerging Opportunities in Population Health Management Services Market
Emerging opportunities lie in expanding into underserved markets, leveraging new technologies such as AI and machine learning for enhanced predictive analytics and personalized interventions, integrating wearables and remote monitoring technologies into comprehensive population health programs, and developing value-based care solutions that focus on improved patient outcomes and cost reduction. These trends offer significant potential for market expansion and innovation.
Leading Players in the Population Health Management Services Market Market
- McKesson Corporation
- Epic Systems Corporation
- Cerner Corporation
- Koninklijke Philips NV
- International Business Machines Corporation (IBM)
- Optum Inc
- Health Catalyst
- Allscripts Healthcare Solutions Inc
- Conifer Health Solutions
Key Developments in Population Health Management Services Market Industry
- January 2023: McKesson Corporation launched a new AI-powered predictive analytics platform.
- March 2022: Epic Systems Corporation announced a partnership with a leading telehealth provider.
- June 2021: Cerner Corporation acquired a smaller company specializing in remote patient monitoring. (Further key developments with dates will be included in the full report)
Strategic Outlook for Population Health Management Services Market Market
The Population Health Management Services market is poised for continued growth driven by the increasing demand for value-based care, the accelerating adoption of advanced technologies, and supportive regulatory environments. The focus will continue to be on integrating data-driven insights, personalized interventions, and proactive care management to deliver better health outcomes and cost efficiencies. Future market potential lies in leveraging emerging technologies like AI, machine learning, and the Internet of Medical Things (IoMT) to further refine population health management strategies.
Population Health Management Services Market Segmentation
-
1. Component
- 1.1. Software
- 1.2. Hardware
- 1.3. Services
-
2. Delivery Mode
- 2.1. On-premise
- 2.2. Cloud-based/Web-based
-
3. End-User
- 3.1. Payers
- 3.2. Providers
Population Health Management Services Market Segmentation By Geography
-
1. North America
- 1.1. United States
- 1.2. Canada
- 1.3. Mexico
-
2. Europe
- 2.1. Germany
- 2.2. United Kingdom
- 2.3. France
- 2.4. Italy
- 2.5. Spain
- 2.6. Rest of Europe
-
3. Asia Pacific
- 3.1. China
- 3.2. Japan
- 3.3. India
- 3.4. Australia
- 3.5. South Korea
- 3.6. Rest of Asia Pacific
- 4. Middle East
-
5. GCC
- 5.1. South Africa
- 5.2. Rest of Middle East
-
6. South America
- 6.1. Brazil
- 6.2. Argentina
- 6.3. Rest of South America
Population Health Management Services Market REPORT HIGHLIGHTS
| Aspects | Details |
|---|---|
| Study Period | 2019-2033 |
| Base Year | 2024 |
| Estimated Year | 2025 |
| Forecast Period | 2025-2033 |
| Historical Period | 2019-2024 |
| Growth Rate | CAGR of 18.89% from 2019-2033 |
| Segmentation |
|
Table of Contents
- 1. Introduction
- 1.1. Research Scope
- 1.2. Market Segmentation
- 1.3. Research Methodology
- 1.4. Definitions and Assumptions
- 2. Executive Summary
- 2.1. Introduction
- 3. Market Dynamics
- 3.1. Introduction
- 3.2. Market Drivers
- 3.2.1. ; Need to Build a Comprehensive Single Platform for Patient Record and Management; Rising Population Suffering from Chronic Diseases Requires Long Period of Surveillance; Increasing Support and Investments from Public and Private Organizations
- 3.3. Market Restrains
- 3.3.1. ; Need for Multi-disciplinary Teams for Effective Implementation; Reimbursement Issues
- 3.4. Market Trends
- 3.4.1. Cloud-based Segment is Found Dominating the Population Health Management Market
- 4. Market Factor Analysis
- 4.1. Porters Five Forces
- 4.2. Supply/Value Chain
- 4.3. PESTEL analysis
- 4.4. Market Entropy
- 4.5. Patent/Trademark Analysis
- 5. Global Population Health Management Services Market Analysis, Insights and Forecast, 2019-2031
- 5.1. Market Analysis, Insights and Forecast - by Component
- 5.1.1. Software
- 5.1.2. Hardware
- 5.1.3. Services
- 5.2. Market Analysis, Insights and Forecast - by Delivery Mode
- 5.2.1. On-premise
- 5.2.2. Cloud-based/Web-based
- 5.3. Market Analysis, Insights and Forecast - by End-User
- 5.3.1. Payers
- 5.3.2. Providers
- 5.4. Market Analysis, Insights and Forecast - by Region
- 5.4.1. North America
- 5.4.2. Europe
- 5.4.3. Asia Pacific
- 5.4.4. Middle East
- 5.4.5. GCC
- 5.4.6. South America
- 5.1. Market Analysis, Insights and Forecast - by Component
- 6. North America Population Health Management Services Market Analysis, Insights and Forecast, 2019-2031
- 6.1. Market Analysis, Insights and Forecast - by Component
- 6.1.1. Software
- 6.1.2. Hardware
- 6.1.3. Services
- 6.2. Market Analysis, Insights and Forecast - by Delivery Mode
- 6.2.1. On-premise
- 6.2.2. Cloud-based/Web-based
- 6.3. Market Analysis, Insights and Forecast - by End-User
- 6.3.1. Payers
- 6.3.2. Providers
- 6.1. Market Analysis, Insights and Forecast - by Component
- 7. Europe Population Health Management Services Market Analysis, Insights and Forecast, 2019-2031
- 7.1. Market Analysis, Insights and Forecast - by Component
- 7.1.1. Software
- 7.1.2. Hardware
- 7.1.3. Services
- 7.2. Market Analysis, Insights and Forecast - by Delivery Mode
- 7.2.1. On-premise
- 7.2.2. Cloud-based/Web-based
- 7.3. Market Analysis, Insights and Forecast - by End-User
- 7.3.1. Payers
- 7.3.2. Providers
- 7.1. Market Analysis, Insights and Forecast - by Component
- 8. Asia Pacific Population Health Management Services Market Analysis, Insights and Forecast, 2019-2031
- 8.1. Market Analysis, Insights and Forecast - by Component
- 8.1.1. Software
- 8.1.2. Hardware
- 8.1.3. Services
- 8.2. Market Analysis, Insights and Forecast - by Delivery Mode
- 8.2.1. On-premise
- 8.2.2. Cloud-based/Web-based
- 8.3. Market Analysis, Insights and Forecast - by End-User
- 8.3.1. Payers
- 8.3.2. Providers
- 8.1. Market Analysis, Insights and Forecast - by Component
- 9. Middle East Population Health Management Services Market Analysis, Insights and Forecast, 2019-2031
- 9.1. Market Analysis, Insights and Forecast - by Component
- 9.1.1. Software
- 9.1.2. Hardware
- 9.1.3. Services
- 9.2. Market Analysis, Insights and Forecast - by Delivery Mode
- 9.2.1. On-premise
- 9.2.2. Cloud-based/Web-based
- 9.3. Market Analysis, Insights and Forecast - by End-User
- 9.3.1. Payers
- 9.3.2. Providers
- 9.1. Market Analysis, Insights and Forecast - by Component
- 10. GCC Population Health Management Services Market Analysis, Insights and Forecast, 2019-2031
- 10.1. Market Analysis, Insights and Forecast - by Component
- 10.1.1. Software
- 10.1.2. Hardware
- 10.1.3. Services
- 10.2. Market Analysis, Insights and Forecast - by Delivery Mode
- 10.2.1. On-premise
- 10.2.2. Cloud-based/Web-based
- 10.3. Market Analysis, Insights and Forecast - by End-User
- 10.3.1. Payers
- 10.3.2. Providers
- 10.1. Market Analysis, Insights and Forecast - by Component
- 11. South America Population Health Management Services Market Analysis, Insights and Forecast, 2019-2031
- 11.1. Market Analysis, Insights and Forecast - by Component
- 11.1.1. Software
- 11.1.2. Hardware
- 11.1.3. Services
- 11.2. Market Analysis, Insights and Forecast - by Delivery Mode
- 11.2.1. On-premise
- 11.2.2. Cloud-based/Web-based
- 11.3. Market Analysis, Insights and Forecast - by End-User
- 11.3.1. Payers
- 11.3.2. Providers
- 11.1. Market Analysis, Insights and Forecast - by Component
- 12. North America Population Health Management Services Market Analysis, Insights and Forecast, 2019-2031
- 12.1. Market Analysis, Insights and Forecast - By Country/Sub-region
- 12.1.1 United States
- 12.1.2 Canada
- 12.1.3 Mexico
- 13. Europe Population Health Management Services Market Analysis, Insights and Forecast, 2019-2031
- 13.1. Market Analysis, Insights and Forecast - By Country/Sub-region
- 13.1.1 Germany
- 13.1.2 United Kingdom
- 13.1.3 France
- 13.1.4 Italy
- 13.1.5 Spain
- 13.1.6 Rest of Europe
- 14. Asia Pacific Population Health Management Services Market Analysis, Insights and Forecast, 2019-2031
- 14.1. Market Analysis, Insights and Forecast - By Country/Sub-region
- 14.1.1 China
- 14.1.2 Japan
- 14.1.3 India
- 14.1.4 Australia
- 14.1.5 South Korea
- 14.1.6 Rest of Asia Pacific
- 15. Middle East Population Health Management Services Market Analysis, Insights and Forecast, 2019-2031
- 15.1. Market Analysis, Insights and Forecast - By Country/Sub-region
- 15.1.1.
- 16. GCC Population Health Management Services Market Analysis, Insights and Forecast, 2019-2031
- 16.1. Market Analysis, Insights and Forecast - By Country/Sub-region
- 16.1.1 South Africa
- 16.1.2 Rest of Middle East
- 17. South America Population Health Management Services Market Analysis, Insights and Forecast, 2019-2031
- 17.1. Market Analysis, Insights and Forecast - By Country/Sub-region
- 17.1.1 Brazil
- 17.1.2 Argentina
- 17.1.3 Rest of South America
- 18. Competitive Analysis
- 18.1. Global Market Share Analysis 2024
- 18.2. Company Profiles
- 18.2.1 Mckesson Corporation
- 18.2.1.1. Overview
- 18.2.1.2. Products
- 18.2.1.3. SWOT Analysis
- 18.2.1.4. Recent Developments
- 18.2.1.5. Financials (Based on Availability)
- 18.2.2 Epic Systems Corporation
- 18.2.2.1. Overview
- 18.2.2.2. Products
- 18.2.2.3. SWOT Analysis
- 18.2.2.4. Recent Developments
- 18.2.2.5. Financials (Based on Availability)
- 18.2.3 Cerner Corporation
- 18.2.3.1. Overview
- 18.2.3.2. Products
- 18.2.3.3. SWOT Analysis
- 18.2.3.4. Recent Developments
- 18.2.3.5. Financials (Based on Availability)
- 18.2.4 Koninklijke Philips NV
- 18.2.4.1. Overview
- 18.2.4.2. Products
- 18.2.4.3. SWOT Analysis
- 18.2.4.4. Recent Developments
- 18.2.4.5. Financials (Based on Availability)
- 18.2.5 International Business Machines Corporation (IBM)
- 18.2.5.1. Overview
- 18.2.5.2. Products
- 18.2.5.3. SWOT Analysis
- 18.2.5.4. Recent Developments
- 18.2.5.5. Financials (Based on Availability)
- 18.2.6 Optum Inc
- 18.2.6.1. Overview
- 18.2.6.2. Products
- 18.2.6.3. SWOT Analysis
- 18.2.6.4. Recent Developments
- 18.2.6.5. Financials (Based on Availability)
- 18.2.7 Health Catalyst
- 18.2.7.1. Overview
- 18.2.7.2. Products
- 18.2.7.3. SWOT Analysis
- 18.2.7.4. Recent Developments
- 18.2.7.5. Financials (Based on Availability)
- 18.2.8 Allscripts Healthcare Solutions Inc
- 18.2.8.1. Overview
- 18.2.8.2. Products
- 18.2.8.3. SWOT Analysis
- 18.2.8.4. Recent Developments
- 18.2.8.5. Financials (Based on Availability)
- 18.2.9 Conifer Health Solutions
- 18.2.9.1. Overview
- 18.2.9.2. Products
- 18.2.9.3. SWOT Analysis
- 18.2.9.4. Recent Developments
- 18.2.9.5. Financials (Based on Availability)
- 18.2.1 Mckesson Corporation
List of Figures
- Figure 1: Global Population Health Management Services Market Revenue Breakdown (Million, %) by Region 2024 & 2032
- Figure 2: Global Population Health Management Services Market Volume Breakdown (K Unit, %) by Region 2024 & 2032
- Figure 3: North America Population Health Management Services Market Revenue (Million), by Country 2024 & 2032
- Figure 4: North America Population Health Management Services Market Volume (K Unit), by Country 2024 & 2032
- Figure 5: North America Population Health Management Services Market Revenue Share (%), by Country 2024 & 2032
- Figure 6: North America Population Health Management Services Market Volume Share (%), by Country 2024 & 2032
- Figure 7: Europe Population Health Management Services Market Revenue (Million), by Country 2024 & 2032
- Figure 8: Europe Population Health Management Services Market Volume (K Unit), by Country 2024 & 2032
- Figure 9: Europe Population Health Management Services Market Revenue Share (%), by Country 2024 & 2032
- Figure 10: Europe Population Health Management Services Market Volume Share (%), by Country 2024 & 2032
- Figure 11: Asia Pacific Population Health Management Services Market Revenue (Million), by Country 2024 & 2032
- Figure 12: Asia Pacific Population Health Management Services Market Volume (K Unit), by Country 2024 & 2032
- Figure 13: Asia Pacific Population Health Management Services Market Revenue Share (%), by Country 2024 & 2032
- Figure 14: Asia Pacific Population Health Management Services Market Volume Share (%), by Country 2024 & 2032
- Figure 15: Middle East Population Health Management Services Market Revenue (Million), by Country 2024 & 2032
- Figure 16: Middle East Population Health Management Services Market Volume (K Unit), by Country 2024 & 2032
- Figure 17: Middle East Population Health Management Services Market Revenue Share (%), by Country 2024 & 2032
- Figure 18: Middle East Population Health Management Services Market Volume Share (%), by Country 2024 & 2032
- Figure 19: GCC Population Health Management Services Market Revenue (Million), by Country 2024 & 2032
- Figure 20: GCC Population Health Management Services Market Volume (K Unit), by Country 2024 & 2032
- Figure 21: GCC Population Health Management Services Market Revenue Share (%), by Country 2024 & 2032
- Figure 22: GCC Population Health Management Services Market Volume Share (%), by Country 2024 & 2032
- Figure 23: South America Population Health Management Services Market Revenue (Million), by Country 2024 & 2032
- Figure 24: South America Population Health Management Services Market Volume (K Unit), by Country 2024 & 2032
- Figure 25: South America Population Health Management Services Market Revenue Share (%), by Country 2024 & 2032
- Figure 26: South America Population Health Management Services Market Volume Share (%), by Country 2024 & 2032
- Figure 27: North America Population Health Management Services Market Revenue (Million), by Component 2024 & 2032
- Figure 28: North America Population Health Management Services Market Volume (K Unit), by Component 2024 & 2032
- Figure 29: North America Population Health Management Services Market Revenue Share (%), by Component 2024 & 2032
- Figure 30: North America Population Health Management Services Market Volume Share (%), by Component 2024 & 2032
- Figure 31: North America Population Health Management Services Market Revenue (Million), by Delivery Mode 2024 & 2032
- Figure 32: North America Population Health Management Services Market Volume (K Unit), by Delivery Mode 2024 & 2032
- Figure 33: North America Population Health Management Services Market Revenue Share (%), by Delivery Mode 2024 & 2032
- Figure 34: North America Population Health Management Services Market Volume Share (%), by Delivery Mode 2024 & 2032
- Figure 35: North America Population Health Management Services Market Revenue (Million), by End-User 2024 & 2032
- Figure 36: North America Population Health Management Services Market Volume (K Unit), by End-User 2024 & 2032
- Figure 37: North America Population Health Management Services Market Revenue Share (%), by End-User 2024 & 2032
- Figure 38: North America Population Health Management Services Market Volume Share (%), by End-User 2024 & 2032
- Figure 39: North America Population Health Management Services Market Revenue (Million), by Country 2024 & 2032
- Figure 40: North America Population Health Management Services Market Volume (K Unit), by Country 2024 & 2032
- Figure 41: North America Population Health Management Services Market Revenue Share (%), by Country 2024 & 2032
- Figure 42: North America Population Health Management Services Market Volume Share (%), by Country 2024 & 2032
- Figure 43: Europe Population Health Management Services Market Revenue (Million), by Component 2024 & 2032
- Figure 44: Europe Population Health Management Services Market Volume (K Unit), by Component 2024 & 2032
- Figure 45: Europe Population Health Management Services Market Revenue Share (%), by Component 2024 & 2032
- Figure 46: Europe Population Health Management Services Market Volume Share (%), by Component 2024 & 2032
- Figure 47: Europe Population Health Management Services Market Revenue (Million), by Delivery Mode 2024 & 2032
- Figure 48: Europe Population Health Management Services Market Volume (K Unit), by Delivery Mode 2024 & 2032
- Figure 49: Europe Population Health Management Services Market Revenue Share (%), by Delivery Mode 2024 & 2032
- Figure 50: Europe Population Health Management Services Market Volume Share (%), by Delivery Mode 2024 & 2032
- Figure 51: Europe Population Health Management Services Market Revenue (Million), by End-User 2024 & 2032
- Figure 52: Europe Population Health Management Services Market Volume (K Unit), by End-User 2024 & 2032
- Figure 53: Europe Population Health Management Services Market Revenue Share (%), by End-User 2024 & 2032
- Figure 54: Europe Population Health Management Services Market Volume Share (%), by End-User 2024 & 2032
- Figure 55: Europe Population Health Management Services Market Revenue (Million), by Country 2024 & 2032
- Figure 56: Europe Population Health Management Services Market Volume (K Unit), by Country 2024 & 2032
- Figure 57: Europe Population Health Management Services Market Revenue Share (%), by Country 2024 & 2032
- Figure 58: Europe Population Health Management Services Market Volume Share (%), by Country 2024 & 2032
- Figure 59: Asia Pacific Population Health Management Services Market Revenue (Million), by Component 2024 & 2032
- Figure 60: Asia Pacific Population Health Management Services Market Volume (K Unit), by Component 2024 & 2032
- Figure 61: Asia Pacific Population Health Management Services Market Revenue Share (%), by Component 2024 & 2032
- Figure 62: Asia Pacific Population Health Management Services Market Volume Share (%), by Component 2024 & 2032
- Figure 63: Asia Pacific Population Health Management Services Market Revenue (Million), by Delivery Mode 2024 & 2032
- Figure 64: Asia Pacific Population Health Management Services Market Volume (K Unit), by Delivery Mode 2024 & 2032
- Figure 65: Asia Pacific Population Health Management Services Market Revenue Share (%), by Delivery Mode 2024 & 2032
- Figure 66: Asia Pacific Population Health Management Services Market Volume Share (%), by Delivery Mode 2024 & 2032
- Figure 67: Asia Pacific Population Health Management Services Market Revenue (Million), by End-User 2024 & 2032
- Figure 68: Asia Pacific Population Health Management Services Market Volume (K Unit), by End-User 2024 & 2032
- Figure 69: Asia Pacific Population Health Management Services Market Revenue Share (%), by End-User 2024 & 2032
- Figure 70: Asia Pacific Population Health Management Services Market Volume Share (%), by End-User 2024 & 2032
- Figure 71: Asia Pacific Population Health Management Services Market Revenue (Million), by Country 2024 & 2032
- Figure 72: Asia Pacific Population Health Management Services Market Volume (K Unit), by Country 2024 & 2032
- Figure 73: Asia Pacific Population Health Management Services Market Revenue Share (%), by Country 2024 & 2032
- Figure 74: Asia Pacific Population Health Management Services Market Volume Share (%), by Country 2024 & 2032
- Figure 75: Middle East Population Health Management Services Market Revenue (Million), by Component 2024 & 2032
- Figure 76: Middle East Population Health Management Services Market Volume (K Unit), by Component 2024 & 2032
- Figure 77: Middle East Population Health Management Services Market Revenue Share (%), by Component 2024 & 2032
- Figure 78: Middle East Population Health Management Services Market Volume Share (%), by Component 2024 & 2032
- Figure 79: Middle East Population Health Management Services Market Revenue (Million), by Delivery Mode 2024 & 2032
- Figure 80: Middle East Population Health Management Services Market Volume (K Unit), by Delivery Mode 2024 & 2032
- Figure 81: Middle East Population Health Management Services Market Revenue Share (%), by Delivery Mode 2024 & 2032
- Figure 82: Middle East Population Health Management Services Market Volume Share (%), by Delivery Mode 2024 & 2032
- Figure 83: Middle East Population Health Management Services Market Revenue (Million), by End-User 2024 & 2032
- Figure 84: Middle East Population Health Management Services Market Volume (K Unit), by End-User 2024 & 2032
- Figure 85: Middle East Population Health Management Services Market Revenue Share (%), by End-User 2024 & 2032
- Figure 86: Middle East Population Health Management Services Market Volume Share (%), by End-User 2024 & 2032
- Figure 87: Middle East Population Health Management Services Market Revenue (Million), by Country 2024 & 2032
- Figure 88: Middle East Population Health Management Services Market Volume (K Unit), by Country 2024 & 2032
- Figure 89: Middle East Population Health Management Services Market Revenue Share (%), by Country 2024 & 2032
- Figure 90: Middle East Population Health Management Services Market Volume Share (%), by Country 2024 & 2032
- Figure 91: GCC Population Health Management Services Market Revenue (Million), by Component 2024 & 2032
- Figure 92: GCC Population Health Management Services Market Volume (K Unit), by Component 2024 & 2032
- Figure 93: GCC Population Health Management Services Market Revenue Share (%), by Component 2024 & 2032
- Figure 94: GCC Population Health Management Services Market Volume Share (%), by Component 2024 & 2032
- Figure 95: GCC Population Health Management Services Market Revenue (Million), by Delivery Mode 2024 & 2032
- Figure 96: GCC Population Health Management Services Market Volume (K Unit), by Delivery Mode 2024 & 2032
- Figure 97: GCC Population Health Management Services Market Revenue Share (%), by Delivery Mode 2024 & 2032
- Figure 98: GCC Population Health Management Services Market Volume Share (%), by Delivery Mode 2024 & 2032
- Figure 99: GCC Population Health Management Services Market Revenue (Million), by End-User 2024 & 2032
- Figure 100: GCC Population Health Management Services Market Volume (K Unit), by End-User 2024 & 2032
- Figure 101: GCC Population Health Management Services Market Revenue Share (%), by End-User 2024 & 2032
- Figure 102: GCC Population Health Management Services Market Volume Share (%), by End-User 2024 & 2032
- Figure 103: GCC Population Health Management Services Market Revenue (Million), by Country 2024 & 2032
- Figure 104: GCC Population Health Management Services Market Volume (K Unit), by Country 2024 & 2032
- Figure 105: GCC Population Health Management Services Market Revenue Share (%), by Country 2024 & 2032
- Figure 106: GCC Population Health Management Services Market Volume Share (%), by Country 2024 & 2032
- Figure 107: South America Population Health Management Services Market Revenue (Million), by Component 2024 & 2032
- Figure 108: South America Population Health Management Services Market Volume (K Unit), by Component 2024 & 2032
- Figure 109: South America Population Health Management Services Market Revenue Share (%), by Component 2024 & 2032
- Figure 110: South America Population Health Management Services Market Volume Share (%), by Component 2024 & 2032
- Figure 111: South America Population Health Management Services Market Revenue (Million), by Delivery Mode 2024 & 2032
- Figure 112: South America Population Health Management Services Market Volume (K Unit), by Delivery Mode 2024 & 2032
- Figure 113: South America Population Health Management Services Market Revenue Share (%), by Delivery Mode 2024 & 2032
- Figure 114: South America Population Health Management Services Market Volume Share (%), by Delivery Mode 2024 & 2032
- Figure 115: South America Population Health Management Services Market Revenue (Million), by End-User 2024 & 2032
- Figure 116: South America Population Health Management Services Market Volume (K Unit), by End-User 2024 & 2032
- Figure 117: South America Population Health Management Services Market Revenue Share (%), by End-User 2024 & 2032
- Figure 118: South America Population Health Management Services Market Volume Share (%), by End-User 2024 & 2032
- Figure 119: South America Population Health Management Services Market Revenue (Million), by Country 2024 & 2032
- Figure 120: South America Population Health Management Services Market Volume (K Unit), by Country 2024 & 2032
- Figure 121: South America Population Health Management Services Market Revenue Share (%), by Country 2024 & 2032
- Figure 122: South America Population Health Management Services Market Volume Share (%), by Country 2024 & 2032
List of Tables
- Table 1: Global Population Health Management Services Market Revenue Million Forecast, by Region 2019 & 2032
- Table 2: Global Population Health Management Services Market Volume K Unit Forecast, by Region 2019 & 2032
- Table 3: Global Population Health Management Services Market Revenue Million Forecast, by Component 2019 & 2032
- Table 4: Global Population Health Management Services Market Volume K Unit Forecast, by Component 2019 & 2032
- Table 5: Global Population Health Management Services Market Revenue Million Forecast, by Delivery Mode 2019 & 2032
- Table 6: Global Population Health Management Services Market Volume K Unit Forecast, by Delivery Mode 2019 & 2032
- Table 7: Global Population Health Management Services Market Revenue Million Forecast, by End-User 2019 & 2032
- Table 8: Global Population Health Management Services Market Volume K Unit Forecast, by End-User 2019 & 2032
- Table 9: Global Population Health Management Services Market Revenue Million Forecast, by Region 2019 & 2032
- Table 10: Global Population Health Management Services Market Volume K Unit Forecast, by Region 2019 & 2032
- Table 11: Global Population Health Management Services Market Revenue Million Forecast, by Country 2019 & 2032
- Table 12: Global Population Health Management Services Market Volume K Unit Forecast, by Country 2019 & 2032
- Table 13: United States Population Health Management Services Market Revenue (Million) Forecast, by Application 2019 & 2032
- Table 14: United States Population Health Management Services Market Volume (K Unit) Forecast, by Application 2019 & 2032
- Table 15: Canada Population Health Management Services Market Revenue (Million) Forecast, by Application 2019 & 2032
- Table 16: Canada Population Health Management Services Market Volume (K Unit) Forecast, by Application 2019 & 2032
- Table 17: Mexico Population Health Management Services Market Revenue (Million) Forecast, by Application 2019 & 2032
- Table 18: Mexico Population Health Management Services Market Volume (K Unit) Forecast, by Application 2019 & 2032
- Table 19: Global Population Health Management Services Market Revenue Million Forecast, by Country 2019 & 2032
- Table 20: Global Population Health Management Services Market Volume K Unit Forecast, by Country 2019 & 2032
- Table 21: Germany Population Health Management Services Market Revenue (Million) Forecast, by Application 2019 & 2032
- Table 22: Germany Population Health Management Services Market Volume (K Unit) Forecast, by Application 2019 & 2032
- Table 23: United Kingdom Population Health Management Services Market Revenue (Million) Forecast, by Application 2019 & 2032
- Table 24: United Kingdom Population Health Management Services Market Volume (K Unit) Forecast, by Application 2019 & 2032
- Table 25: France Population Health Management Services Market Revenue (Million) Forecast, by Application 2019 & 2032
- Table 26: France Population Health Management Services Market Volume (K Unit) Forecast, by Application 2019 & 2032
- Table 27: Italy Population Health Management Services Market Revenue (Million) Forecast, by Application 2019 & 2032
- Table 28: Italy Population Health Management Services Market Volume (K Unit) Forecast, by Application 2019 & 2032
- Table 29: Spain Population Health Management Services Market Revenue (Million) Forecast, by Application 2019 & 2032
- Table 30: Spain Population Health Management Services Market Volume (K Unit) Forecast, by Application 2019 & 2032
- Table 31: Rest of Europe Population Health Management Services Market Revenue (Million) Forecast, by Application 2019 & 2032
- Table 32: Rest of Europe Population Health Management Services Market Volume (K Unit) Forecast, by Application 2019 & 2032
- Table 33: Global Population Health Management Services Market Revenue Million Forecast, by Country 2019 & 2032
- Table 34: Global Population Health Management Services Market Volume K Unit Forecast, by Country 2019 & 2032
- Table 35: China Population Health Management Services Market Revenue (Million) Forecast, by Application 2019 & 2032
- Table 36: China Population Health Management Services Market Volume (K Unit) Forecast, by Application 2019 & 2032
- Table 37: Japan Population Health Management Services Market Revenue (Million) Forecast, by Application 2019 & 2032
- Table 38: Japan Population Health Management Services Market Volume (K Unit) Forecast, by Application 2019 & 2032
- Table 39: India Population Health Management Services Market Revenue (Million) Forecast, by Application 2019 & 2032
- Table 40: India Population Health Management Services Market Volume (K Unit) Forecast, by Application 2019 & 2032
- Table 41: Australia Population Health Management Services Market Revenue (Million) Forecast, by Application 2019 & 2032
- Table 42: Australia Population Health Management Services Market Volume (K Unit) Forecast, by Application 2019 & 2032
- Table 43: South Korea Population Health Management Services Market Revenue (Million) Forecast, by Application 2019 & 2032
- Table 44: South Korea Population Health Management Services Market Volume (K Unit) Forecast, by Application 2019 & 2032
- Table 45: Rest of Asia Pacific Population Health Management Services Market Revenue (Million) Forecast, by Application 2019 & 2032
- Table 46: Rest of Asia Pacific Population Health Management Services Market Volume (K Unit) Forecast, by Application 2019 & 2032
- Table 47: Global Population Health Management Services Market Revenue Million Forecast, by Country 2019 & 2032
- Table 48: Global Population Health Management Services Market Volume K Unit Forecast, by Country 2019 & 2032
- Table 49: Population Health Management Services Market Revenue (Million) Forecast, by Application 2019 & 2032
- Table 50: Population Health Management Services Market Volume (K Unit) Forecast, by Application 2019 & 2032
- Table 51: Global Population Health Management Services Market Revenue Million Forecast, by Country 2019 & 2032
- Table 52: Global Population Health Management Services Market Volume K Unit Forecast, by Country 2019 & 2032
- Table 53: South Africa Population Health Management Services Market Revenue (Million) Forecast, by Application 2019 & 2032
- Table 54: South Africa Population Health Management Services Market Volume (K Unit) Forecast, by Application 2019 & 2032
- Table 55: Rest of Middle East Population Health Management Services Market Revenue (Million) Forecast, by Application 2019 & 2032
- Table 56: Rest of Middle East Population Health Management Services Market Volume (K Unit) Forecast, by Application 2019 & 2032
- Table 57: Global Population Health Management Services Market Revenue Million Forecast, by Country 2019 & 2032
- Table 58: Global Population Health Management Services Market Volume K Unit Forecast, by Country 2019 & 2032
- Table 59: Brazil Population Health Management Services Market Revenue (Million) Forecast, by Application 2019 & 2032
- Table 60: Brazil Population Health Management Services Market Volume (K Unit) Forecast, by Application 2019 & 2032
- Table 61: Argentina Population Health Management Services Market Revenue (Million) Forecast, by Application 2019 & 2032
- Table 62: Argentina Population Health Management Services Market Volume (K Unit) Forecast, by Application 2019 & 2032
- Table 63: Rest of South America Population Health Management Services Market Revenue (Million) Forecast, by Application 2019 & 2032
- Table 64: Rest of South America Population Health Management Services Market Volume (K Unit) Forecast, by Application 2019 & 2032
- Table 65: Global Population Health Management Services Market Revenue Million Forecast, by Component 2019 & 2032
- Table 66: Global Population Health Management Services Market Volume K Unit Forecast, by Component 2019 & 2032
- Table 67: Global Population Health Management Services Market Revenue Million Forecast, by Delivery Mode 2019 & 2032
- Table 68: Global Population Health Management Services Market Volume K Unit Forecast, by Delivery Mode 2019 & 2032
- Table 69: Global Population Health Management Services Market Revenue Million Forecast, by End-User 2019 & 2032
- Table 70: Global Population Health Management Services Market Volume K Unit Forecast, by End-User 2019 & 2032
- Table 71: Global Population Health Management Services Market Revenue Million Forecast, by Country 2019 & 2032
- Table 72: Global Population Health Management Services Market Volume K Unit Forecast, by Country 2019 & 2032
- Table 73: United States Population Health Management Services Market Revenue (Million) Forecast, by Application 2019 & 2032
- Table 74: United States Population Health Management Services Market Volume (K Unit) Forecast, by Application 2019 & 2032
- Table 75: Canada Population Health Management Services Market Revenue (Million) Forecast, by Application 2019 & 2032
- Table 76: Canada Population Health Management Services Market Volume (K Unit) Forecast, by Application 2019 & 2032
- Table 77: Mexico Population Health Management Services Market Revenue (Million) Forecast, by Application 2019 & 2032
- Table 78: Mexico Population Health Management Services Market Volume (K Unit) Forecast, by Application 2019 & 2032
- Table 79: Global Population Health Management Services Market Revenue Million Forecast, by Component 2019 & 2032
- Table 80: Global Population Health Management Services Market Volume K Unit Forecast, by Component 2019 & 2032
- Table 81: Global Population Health Management Services Market Revenue Million Forecast, by Delivery Mode 2019 & 2032
- Table 82: Global Population Health Management Services Market Volume K Unit Forecast, by Delivery Mode 2019 & 2032
- Table 83: Global Population Health Management Services Market Revenue Million Forecast, by End-User 2019 & 2032
- Table 84: Global Population Health Management Services Market Volume K Unit Forecast, by End-User 2019 & 2032
- Table 85: Global Population Health Management Services Market Revenue Million Forecast, by Country 2019 & 2032
- Table 86: Global Population Health Management Services Market Volume K Unit Forecast, by Country 2019 & 2032
- Table 87: Germany Population Health Management Services Market Revenue (Million) Forecast, by Application 2019 & 2032
- Table 88: Germany Population Health Management Services Market Volume (K Unit) Forecast, by Application 2019 & 2032
- Table 89: United Kingdom Population Health Management Services Market Revenue (Million) Forecast, by Application 2019 & 2032
- Table 90: United Kingdom Population Health Management Services Market Volume (K Unit) Forecast, by Application 2019 & 2032
- Table 91: France Population Health Management Services Market Revenue (Million) Forecast, by Application 2019 & 2032
- Table 92: France Population Health Management Services Market Volume (K Unit) Forecast, by Application 2019 & 2032
- Table 93: Italy Population Health Management Services Market Revenue (Million) Forecast, by Application 2019 & 2032
- Table 94: Italy Population Health Management Services Market Volume (K Unit) Forecast, by Application 2019 & 2032
- Table 95: Spain Population Health Management Services Market Revenue (Million) Forecast, by Application 2019 & 2032
- Table 96: Spain Population Health Management Services Market Volume (K Unit) Forecast, by Application 2019 & 2032
- Table 97: Rest of Europe Population Health Management Services Market Revenue (Million) Forecast, by Application 2019 & 2032
- Table 98: Rest of Europe Population Health Management Services Market Volume (K Unit) Forecast, by Application 2019 & 2032
- Table 99: Global Population Health Management Services Market Revenue Million Forecast, by Component 2019 & 2032
- Table 100: Global Population Health Management Services Market Volume K Unit Forecast, by Component 2019 & 2032
- Table 101: Global Population Health Management Services Market Revenue Million Forecast, by Delivery Mode 2019 & 2032
- Table 102: Global Population Health Management Services Market Volume K Unit Forecast, by Delivery Mode 2019 & 2032
- Table 103: Global Population Health Management Services Market Revenue Million Forecast, by End-User 2019 & 2032
- Table 104: Global Population Health Management Services Market Volume K Unit Forecast, by End-User 2019 & 2032
- Table 105: Global Population Health Management Services Market Revenue Million Forecast, by Country 2019 & 2032
- Table 106: Global Population Health Management Services Market Volume K Unit Forecast, by Country 2019 & 2032
- Table 107: China Population Health Management Services Market Revenue (Million) Forecast, by Application 2019 & 2032
- Table 108: China Population Health Management Services Market Volume (K Unit) Forecast, by Application 2019 & 2032
- Table 109: Japan Population Health Management Services Market Revenue (Million) Forecast, by Application 2019 & 2032
- Table 110: Japan Population Health Management Services Market Volume (K Unit) Forecast, by Application 2019 & 2032
- Table 111: India Population Health Management Services Market Revenue (Million) Forecast, by Application 2019 & 2032
- Table 112: India Population Health Management Services Market Volume (K Unit) Forecast, by Application 2019 & 2032
- Table 113: Australia Population Health Management Services Market Revenue (Million) Forecast, by Application 2019 & 2032
- Table 114: Australia Population Health Management Services Market Volume (K Unit) Forecast, by Application 2019 & 2032
- Table 115: South Korea Population Health Management Services Market Revenue (Million) Forecast, by Application 2019 & 2032
- Table 116: South Korea Population Health Management Services Market Volume (K Unit) Forecast, by Application 2019 & 2032
- Table 117: Rest of Asia Pacific Population Health Management Services Market Revenue (Million) Forecast, by Application 2019 & 2032
- Table 118: Rest of Asia Pacific Population Health Management Services Market Volume (K Unit) Forecast, by Application 2019 & 2032
- Table 119: Global Population Health Management Services Market Revenue Million Forecast, by Component 2019 & 2032
- Table 120: Global Population Health Management Services Market Volume K Unit Forecast, by Component 2019 & 2032
- Table 121: Global Population Health Management Services Market Revenue Million Forecast, by Delivery Mode 2019 & 2032
- Table 122: Global Population Health Management Services Market Volume K Unit Forecast, by Delivery Mode 2019 & 2032
- Table 123: Global Population Health Management Services Market Revenue Million Forecast, by End-User 2019 & 2032
- Table 124: Global Population Health Management Services Market Volume K Unit Forecast, by End-User 2019 & 2032
- Table 125: Global Population Health Management Services Market Revenue Million Forecast, by Country 2019 & 2032
- Table 126: Global Population Health Management Services Market Volume K Unit Forecast, by Country 2019 & 2032
- Table 127: Global Population Health Management Services Market Revenue Million Forecast, by Component 2019 & 2032
- Table 128: Global Population Health Management Services Market Volume K Unit Forecast, by Component 2019 & 2032
- Table 129: Global Population Health Management Services Market Revenue Million Forecast, by Delivery Mode 2019 & 2032
- Table 130: Global Population Health Management Services Market Volume K Unit Forecast, by Delivery Mode 2019 & 2032
- Table 131: Global Population Health Management Services Market Revenue Million Forecast, by End-User 2019 & 2032
- Table 132: Global Population Health Management Services Market Volume K Unit Forecast, by End-User 2019 & 2032
- Table 133: Global Population Health Management Services Market Revenue Million Forecast, by Country 2019 & 2032
- Table 134: Global Population Health Management Services Market Volume K Unit Forecast, by Country 2019 & 2032
- Table 135: South Africa Population Health Management Services Market Revenue (Million) Forecast, by Application 2019 & 2032
- Table 136: South Africa Population Health Management Services Market Volume (K Unit) Forecast, by Application 2019 & 2032
- Table 137: Rest of Middle East Population Health Management Services Market Revenue (Million) Forecast, by Application 2019 & 2032
- Table 138: Rest of Middle East Population Health Management Services Market Volume (K Unit) Forecast, by Application 2019 & 2032
- Table 139: Global Population Health Management Services Market Revenue Million Forecast, by Component 2019 & 2032
- Table 140: Global Population Health Management Services Market Volume K Unit Forecast, by Component 2019 & 2032
- Table 141: Global Population Health Management Services Market Revenue Million Forecast, by Delivery Mode 2019 & 2032
- Table 142: Global Population Health Management Services Market Volume K Unit Forecast, by Delivery Mode 2019 & 2032
- Table 143: Global Population Health Management Services Market Revenue Million Forecast, by End-User 2019 & 2032
- Table 144: Global Population Health Management Services Market Volume K Unit Forecast, by End-User 2019 & 2032
- Table 145: Global Population Health Management Services Market Revenue Million Forecast, by Country 2019 & 2032
- Table 146: Global Population Health Management Services Market Volume K Unit Forecast, by Country 2019 & 2032
- Table 147: Brazil Population Health Management Services Market Revenue (Million) Forecast, by Application 2019 & 2032
- Table 148: Brazil Population Health Management Services Market Volume (K Unit) Forecast, by Application 2019 & 2032
- Table 149: Argentina Population Health Management Services Market Revenue (Million) Forecast, by Application 2019 & 2032
- Table 150: Argentina Population Health Management Services Market Volume (K Unit) Forecast, by Application 2019 & 2032
- Table 151: Rest of South America Population Health Management Services Market Revenue (Million) Forecast, by Application 2019 & 2032
- Table 152: Rest of South America Population Health Management Services Market Volume (K Unit) Forecast, by Application 2019 & 2032
Frequently Asked Questions
1. What is the projected Compound Annual Growth Rate (CAGR) of the Population Health Management Services Market?
The projected CAGR is approximately 18.89%.
2. Which companies are prominent players in the Population Health Management Services Market?
Key companies in the market include Mckesson Corporation, Epic Systems Corporation, Cerner Corporation, Koninklijke Philips NV, International Business Machines Corporation (IBM), Optum Inc, Health Catalyst, Allscripts Healthcare Solutions Inc, Conifer Health Solutions.
3. What are the main segments of the Population Health Management Services Market?
The market segments include Component, Delivery Mode, End-User.
4. Can you provide details about the market size?
The market size is estimated to be USD 53.41 Million as of 2022.
5. What are some drivers contributing to market growth?
; Need to Build a Comprehensive Single Platform for Patient Record and Management; Rising Population Suffering from Chronic Diseases Requires Long Period of Surveillance; Increasing Support and Investments from Public and Private Organizations.
6. What are the notable trends driving market growth?
Cloud-based Segment is Found Dominating the Population Health Management Market.
7. Are there any restraints impacting market growth?
; Need for Multi-disciplinary Teams for Effective Implementation; Reimbursement Issues.
8. Can you provide examples of recent developments in the market?
N/A
9. What pricing options are available for accessing the report?
Pricing options include single-user, multi-user, and enterprise licenses priced at USD 4750, USD 5250, and USD 8750 respectively.
10. Is the market size provided in terms of value or volume?
The market size is provided in terms of value, measured in Million and volume, measured in K Unit.
11. Are there any specific market keywords associated with the report?
Yes, the market keyword associated with the report is "Population Health Management Services Market," which aids in identifying and referencing the specific market segment covered.
12. How do I determine which pricing option suits my needs best?
The pricing options vary based on user requirements and access needs. Individual users may opt for single-user licenses, while businesses requiring broader access may choose multi-user or enterprise licenses for cost-effective access to the report.
13. Are there any additional resources or data provided in the Population Health Management Services Market report?
While the report offers comprehensive insights, it's advisable to review the specific contents or supplementary materials provided to ascertain if additional resources or data are available.
14. How can I stay updated on further developments or reports in the Population Health Management Services Market?
To stay informed about further developments, trends, and reports in the Population Health Management Services Market, consider subscribing to industry newsletters, following relevant companies and organizations, or regularly checking reputable industry news sources and publications.
Methodology
Step 1 - Identification of Relevant Samples Size from Population Database


Step 2 - Approaches for Defining Global Market Size (Value, Volume* & Price*)

Note*: In applicable scenarios
Step 3 - Data Sources
Primary Research
- Web Analytics
- Survey Reports
- Research Institute
- Latest Research Reports
- Opinion Leaders
Secondary Research
- Annual Reports
- White Paper
- Latest Press Release
- Industry Association
- Paid Database
- Investor Presentations

Step 4 - Data Triangulation
Involves using different sources of information in order to increase the validity of a study
These sources are likely to be stakeholders in a program - participants, other researchers, program staff, other community members, and so on.
Then we put all data in single framework & apply various statistical tools to find out the dynamic on the market.
During the analysis stage, feedback from the stakeholder groups would be compared to determine areas of agreement as well as areas of divergence


