
Key Insights
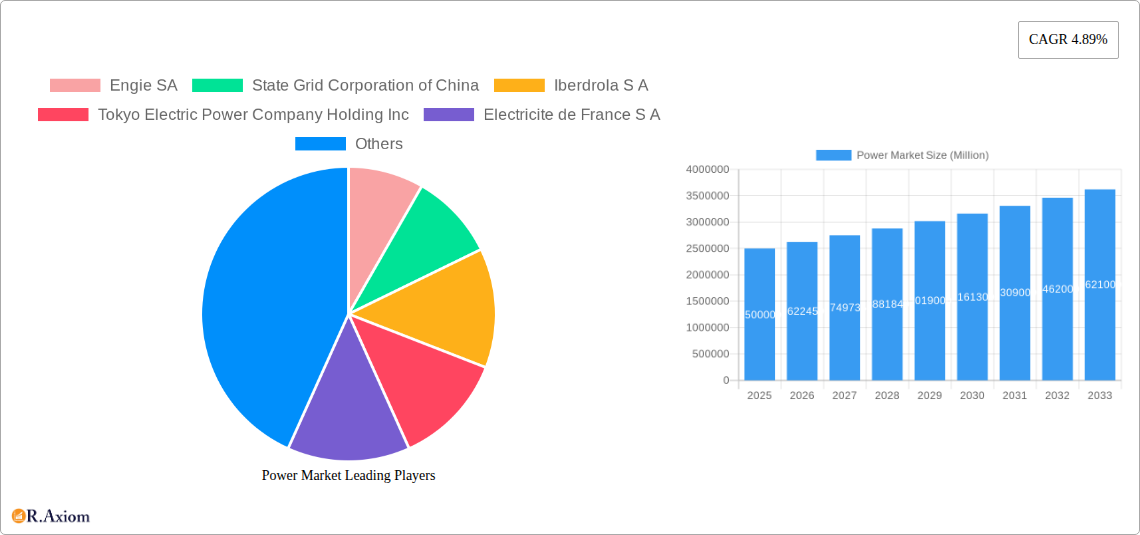
The global power market, currently exhibiting a Compound Annual Growth Rate (CAGR) of 4.89%, is poised for significant expansion throughout the forecast period (2025-2033). Driven by increasing energy demands fueled by population growth, industrialization, and urbanization, particularly in developing economies of Asia-Pacific, the market is projected to reach substantial value in the coming years. Key drivers include the global transition towards cleaner energy sources, with significant investments in renewable energy technologies like solar, wind, and hydro. Governments worldwide are implementing supportive policies, including subsidies and carbon emission reduction targets, further propelling the adoption of renewable power generation. However, challenges remain, including the intermittency of renewable energy sources, the need for substantial infrastructure upgrades to accommodate the transition, and the ongoing geopolitical factors impacting energy security and pricing. The market is segmented by power generation source (thermal, hydroelectric, nuclear, renewables), with renewables experiencing the fastest growth rate due to technological advancements and decreasing costs. Major players, including Engie SA, State Grid Corporation of China, Iberdrola S.A., and others, are strategically positioning themselves to capitalize on this growth, focusing on investments in renewable energy projects and grid modernization. Regional variations exist, with North America and Europe showing mature markets characterized by technological innovation and regulatory advancements, while Asia-Pacific is expected to demonstrate the most substantial growth potential due to its rapidly expanding energy demand.
The competitive landscape is marked by a mix of large established utilities and emerging renewable energy companies. Mergers, acquisitions, and strategic partnerships are becoming increasingly common as companies seek to expand their market share and diversify their energy portfolios. The long-term outlook for the power market remains positive, contingent upon continued technological progress, supportive government policies, and successful navigation of the challenges associated with the energy transition. The market's evolution will likely witness a more decentralized energy system, with increased participation from distributed generation sources and a greater emphasis on smart grid technologies. This will require substantial investments in grid infrastructure to ensure reliability and efficiency amidst increasing renewable energy integration. Furthermore, effective energy storage solutions will be crucial to address the intermittency challenges associated with solar and wind power.
Power Market: A Comprehensive Report (2019-2033)
This in-depth report provides a comprehensive analysis of the global power market, offering actionable insights for industry stakeholders. With a study period spanning 2019-2033, a base year of 2025, and a forecast period of 2025-2033, this report leverages historical data (2019-2024) to project future market trends and growth. The report analyzes market concentration, innovation, industry trends, dominant segments, product developments, and key players, providing a holistic view of this dynamic sector. The total market size is predicted to reach xx Million by 2033.
Power Market Market Concentration & Innovation
The global power market exhibits a moderately concentrated landscape, with a few major players holding significant market share. Engie SA, State Grid Corporation of China, Iberdrola S.A., and Enel S.p.A. are among the leading companies, although market share varies significantly across segments and regions. Innovation is driven by the increasing demand for renewable energy sources, stringent environmental regulations, and advancements in energy storage technologies. Mergers and acquisitions (M&A) activity is prominent, with deal values exceeding xx Million annually in recent years. Key M&A activities include strategic partnerships to leverage renewable energy technologies and expand geographic reach.
- Market Share: The top five players collectively hold an estimated xx% market share in 2025.
- M&A Activity: Over the past five years, the average annual value of M&A deals in the power sector exceeded xx Million.
- Innovation Drivers: Stringent environmental regulations, advancements in renewable energy technologies (e.g., solar PV, wind power), and the need for grid modernization are major drivers of innovation.
- Regulatory Frameworks: Government policies promoting renewable energy adoption, carbon emission reduction targets, and grid infrastructure investments significantly influence market dynamics.
Power Market Industry Trends & Insights
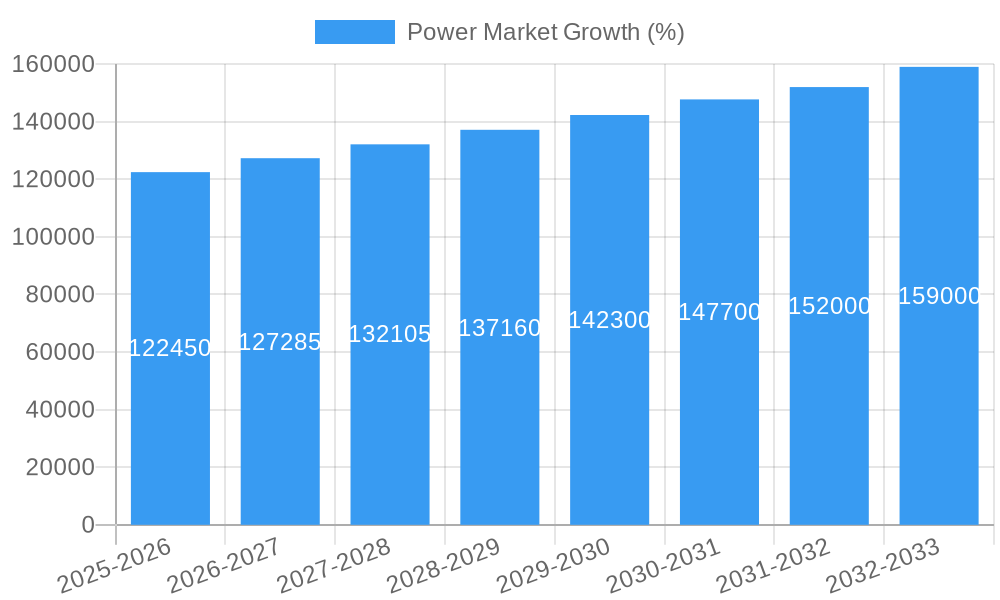
The power market is experiencing significant transformation fueled by several key trends. The global shift towards renewable energy sources is a dominant force, driving substantial growth in solar, wind, and hydroelectric power generation. Technological disruptions, such as the increasing adoption of smart grids and energy storage solutions, are enhancing grid efficiency and reliability. Consumer preferences are shifting towards cleaner energy sources, increasing demand for green power options. Competitive dynamics are intensifying, with established players and new entrants vying for market share. The global power market is estimated to achieve a CAGR of xx% during the forecast period (2025-2033), driven by rising energy demand and government initiatives to support renewable energy development. Market penetration of renewable energy sources is expected to reach xx% by 2033.
Dominant Markets & Segments in Power Market
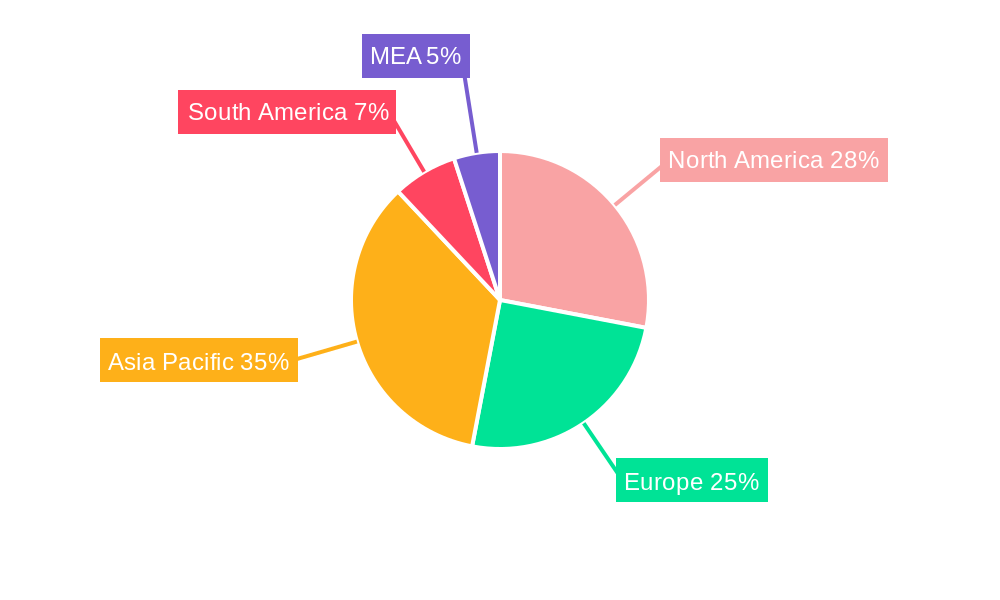
The Asia-Pacific region is expected to remain the dominant market for power generation, with China and India leading the growth. Within power generation sources, thermal power still holds the largest share, although the share of renewables is rapidly increasing.
Key Drivers:
- Asia-Pacific Dominance: Rapid economic growth, increasing energy demand, and government support for infrastructure development are driving growth in this region.
- Renewable Energy Growth: Government incentives, declining costs of renewable energy technologies, and environmental concerns are pushing the adoption of renewables.
- Thermal Power: Existing infrastructure and relatively low initial investment costs ensure that thermal power will remain a significant source of energy generation.
Dominance Analysis: The dominance of thermal power is attributed to its established infrastructure and cost-effectiveness, particularly in developing economies. However, the shift towards renewable energy is gradually reducing thermal power's market share. China's massive investments in renewable energy infrastructure have propelled it to become a leading market for both thermal and renewable power generation.
Power Market Product Developments
Recent innovations focus on enhancing efficiency, reducing costs, and improving the reliability of power generation and distribution. Smart grids, advanced energy storage systems, and improved renewable energy technologies are transforming the sector, enhancing grid stability and facilitating the integration of intermittent renewable sources. These developments offer competitive advantages by optimizing energy utilization, reducing emissions, and enhancing grid resilience.
Report Scope & Segmentation Analysis
This report segments the power market by generation source: Thermal, Hydroelectric, Nuclear, and Renewables.
Thermal: This segment is characterized by mature technology and extensive existing infrastructure. Growth will be moderate, driven by continued demand from industries and regions lacking sufficient renewable resources.
Hydroelectric: This sector offers clean, reliable energy, but development is limited by geographic constraints. Growth will depend on new project development, primarily in regions with suitable resources.
Nuclear: Nuclear power remains a significant source of baseload electricity but faces challenges related to safety and waste disposal. Growth projections depend on government policies and public acceptance.
Renewables (Solar, Wind, Geothermal, Biomass): This segment shows the highest growth potential, fueled by declining costs, technological advancements, and government support. Competition is intense, with various technologies vying for market share.
Key Drivers of Power Market Growth
Several factors are driving the growth of the power market, including rising global energy demand, government policies promoting renewable energy integration, advancements in energy storage technologies, and increasing industrialization. The declining costs of renewable energy technologies are also significantly boosting market expansion, making renewable options more economically viable. Government regulations aimed at reducing carbon emissions are further stimulating investment in cleaner energy sources.
Challenges in the Power Market Sector
The power market faces several challenges, including the intermittency of renewable energy sources, the need for significant infrastructure investment to support grid modernization and renewable integration, and regulatory hurdles related to permitting and licensing. Supply chain disruptions can also impact project timelines and costs. Furthermore, intense competition among power generation companies can put downward pressure on prices and profitability.
Emerging Opportunities in Power Market
Significant opportunities exist in the development of smart grids, energy storage solutions, and decentralized energy systems. The growth of electric vehicles and the increasing demand for data centers are creating further opportunities. Developing markets in Africa and Southeast Asia present substantial growth potential, while advancements in artificial intelligence (AI) and machine learning are enhancing grid management and optimizing energy distribution.
Leading Players in the Power Market Market
- Engie SA
- State Grid Corporation of China
- Iberdrola S A
- Tokyo Electric Power Company Holding Inc
- Electricite de France S A
- Chubu Electric Power Co Inc
- Korea Electric Power Corporation (KEPCO)
- NTPC Ltd
- National Thermal Power Corporation Limited
- Enel S p A
Key Developments in Power Market Industry
April 2023: ArcelorMittal Brazil and Casa dos Ventos form a joint venture to develop the 554 MW Babilonia wind power project in Brazil (USD 800 Million investment). This highlights the increasing private sector investment in renewable energy.
April 2023: The Indian government approves the construction of ten 700 MW nuclear reactors. This signifies a significant commitment to nuclear power expansion and energy security.
July 2022: DEWA announces plans to develop 4 GW of renewable energy projects in Dubai (AED 40 Billion investment). This showcases the rapid growth of renewable energy in the Middle East.
Strategic Outlook for Power Market Market
The future of the power market is bright, driven by the global transition to cleaner energy sources and the ongoing technological advancements that are improving efficiency and reducing costs. The increasing integration of renewable energy and the expansion of smart grids will continue to shape the landscape, offering significant growth opportunities for companies that can adapt and innovate. The power market is poised for continued expansion, driven by rising energy demand, policy support, and technological innovation.
Power Market Segmentation
-
1. Power Generation - Source
- 1.1. Thermal
- 1.2. Hydroelectric
- 1.3. Nuclear
- 1.4. Renewables
- 2. Power Transmission and Distribution (T&D)
Power Market Segmentation By Geography
- 1. North America
- 2. Asia Pacific
- 3. Europe
- 4. South America
- 5. Middle East and Africa
Power Market REPORT HIGHLIGHTS
| Aspects | Details |
|---|---|
| Study Period | 2019-2033 |
| Base Year | 2024 |
| Estimated Year | 2025 |
| Forecast Period | 2025-2033 |
| Historical Period | 2019-2024 |
| Growth Rate | CAGR of 4.89% from 2019-2033 |
| Segmentation |
|
Table of Contents
- 1. Introduction
- 1.1. Research Scope
- 1.2. Market Segmentation
- 1.3. Research Methodology
- 1.4. Definitions and Assumptions
- 2. Executive Summary
- 2.1. Introduction
- 3. Market Dynamics
- 3.1. Introduction
- 3.2. Market Drivers
- 3.2.1. 4.; Growing Electricity Generation along with Energy Consumption Demand4.8.; Increasing adoption of Renewable Energy
- 3.3. Market Restrains
- 3.3.1. 4.; Phasing out of Coal-Based Power Plants
- 3.4. Market Trends
- 3.4.1. Thermal Source for Power Generation to be the Largest Market
- 4. Market Factor Analysis
- 4.1. Porters Five Forces
- 4.2. Supply/Value Chain
- 4.3. PESTEL analysis
- 4.4. Market Entropy
- 4.5. Patent/Trademark Analysis
- 5. Global Power Market Analysis, Insights and Forecast, 2019-2031
- 5.1. Market Analysis, Insights and Forecast - by Power Generation - Source
- 5.1.1. Thermal
- 5.1.2. Hydroelectric
- 5.1.3. Nuclear
- 5.1.4. Renewables
- 5.2. Market Analysis, Insights and Forecast - by Power Transmission and Distribution (T&D)
- 5.3. Market Analysis, Insights and Forecast - by Region
- 5.3.1. North America
- 5.3.2. Asia Pacific
- 5.3.3. Europe
- 5.3.4. South America
- 5.3.5. Middle East and Africa
- 5.1. Market Analysis, Insights and Forecast - by Power Generation - Source
- 6. North America Power Market Analysis, Insights and Forecast, 2019-2031
- 6.1. Market Analysis, Insights and Forecast - by Power Generation - Source
- 6.1.1. Thermal
- 6.1.2. Hydroelectric
- 6.1.3. Nuclear
- 6.1.4. Renewables
- 6.2. Market Analysis, Insights and Forecast - by Power Transmission and Distribution (T&D)
- 6.1. Market Analysis, Insights and Forecast - by Power Generation - Source
- 7. Asia Pacific Power Market Analysis, Insights and Forecast, 2019-2031
- 7.1. Market Analysis, Insights and Forecast - by Power Generation - Source
- 7.1.1. Thermal
- 7.1.2. Hydroelectric
- 7.1.3. Nuclear
- 7.1.4. Renewables
- 7.2. Market Analysis, Insights and Forecast - by Power Transmission and Distribution (T&D)
- 7.1. Market Analysis, Insights and Forecast - by Power Generation - Source
- 8. Europe Power Market Analysis, Insights and Forecast, 2019-2031
- 8.1. Market Analysis, Insights and Forecast - by Power Generation - Source
- 8.1.1. Thermal
- 8.1.2. Hydroelectric
- 8.1.3. Nuclear
- 8.1.4. Renewables
- 8.2. Market Analysis, Insights and Forecast - by Power Transmission and Distribution (T&D)
- 8.1. Market Analysis, Insights and Forecast - by Power Generation - Source
- 9. South America Power Market Analysis, Insights and Forecast, 2019-2031
- 9.1. Market Analysis, Insights and Forecast - by Power Generation - Source
- 9.1.1. Thermal
- 9.1.2. Hydroelectric
- 9.1.3. Nuclear
- 9.1.4. Renewables
- 9.2. Market Analysis, Insights and Forecast - by Power Transmission and Distribution (T&D)
- 9.1. Market Analysis, Insights and Forecast - by Power Generation - Source
- 10. Middle East and Africa Power Market Analysis, Insights and Forecast, 2019-2031
- 10.1. Market Analysis, Insights and Forecast - by Power Generation - Source
- 10.1.1. Thermal
- 10.1.2. Hydroelectric
- 10.1.3. Nuclear
- 10.1.4. Renewables
- 10.2. Market Analysis, Insights and Forecast - by Power Transmission and Distribution (T&D)
- 10.1. Market Analysis, Insights and Forecast - by Power Generation - Source
- 11. North America Power Market Analysis, Insights and Forecast, 2019-2031
- 11.1. Market Analysis, Insights and Forecast - By Country/Sub-region
- 11.1.1 United States
- 11.1.2 Canada
- 11.1.3 Mexico
- 12. Europe Power Market Analysis, Insights and Forecast, 2019-2031
- 12.1. Market Analysis, Insights and Forecast - By Country/Sub-region
- 12.1.1 Germany
- 12.1.2 United Kingdom
- 12.1.3 France
- 12.1.4 Spain
- 12.1.5 Italy
- 12.1.6 Spain
- 12.1.7 Belgium
- 12.1.8 Netherland
- 12.1.9 Nordics
- 12.1.10 Rest of Europe
- 13. Asia Pacific Power Market Analysis, Insights and Forecast, 2019-2031
- 13.1. Market Analysis, Insights and Forecast - By Country/Sub-region
- 13.1.1 China
- 13.1.2 Japan
- 13.1.3 India
- 13.1.4 South Korea
- 13.1.5 Southeast Asia
- 13.1.6 Australia
- 13.1.7 Indonesia
- 13.1.8 Phillipes
- 13.1.9 Singapore
- 13.1.10 Thailandc
- 13.1.11 Rest of Asia Pacific
- 14. South America Power Market Analysis, Insights and Forecast, 2019-2031
- 14.1. Market Analysis, Insights and Forecast - By Country/Sub-region
- 14.1.1 Brazil
- 14.1.2 Argentina
- 14.1.3 Peru
- 14.1.4 Chile
- 14.1.5 Colombia
- 14.1.6 Ecuador
- 14.1.7 Venezuela
- 14.1.8 Rest of South America
- 15. North America Power Market Analysis, Insights and Forecast, 2019-2031
- 15.1. Market Analysis, Insights and Forecast - By Country/Sub-region
- 15.1.1 United States
- 15.1.2 Canada
- 15.1.3 Mexico
- 16. MEA Power Market Analysis, Insights and Forecast, 2019-2031
- 16.1. Market Analysis, Insights and Forecast - By Country/Sub-region
- 16.1.1 United Arab Emirates
- 16.1.2 Saudi Arabia
- 16.1.3 South Africa
- 16.1.4 Rest of Middle East and Africa
- 17. Competitive Analysis
- 17.1. Global Market Share Analysis 2024
- 17.2. Company Profiles
- 17.2.1 Engie SA
- 17.2.1.1. Overview
- 17.2.1.2. Products
- 17.2.1.3. SWOT Analysis
- 17.2.1.4. Recent Developments
- 17.2.1.5. Financials (Based on Availability)
- 17.2.2 State Grid Corporation of China
- 17.2.2.1. Overview
- 17.2.2.2. Products
- 17.2.2.3. SWOT Analysis
- 17.2.2.4. Recent Developments
- 17.2.2.5. Financials (Based on Availability)
- 17.2.3 Iberdrola S A
- 17.2.3.1. Overview
- 17.2.3.2. Products
- 17.2.3.3. SWOT Analysis
- 17.2.3.4. Recent Developments
- 17.2.3.5. Financials (Based on Availability)
- 17.2.4 Tokyo Electric Power Company Holding Inc
- 17.2.4.1. Overview
- 17.2.4.2. Products
- 17.2.4.3. SWOT Analysis
- 17.2.4.4. Recent Developments
- 17.2.4.5. Financials (Based on Availability)
- 17.2.5 Electricite de France S A
- 17.2.5.1. Overview
- 17.2.5.2. Products
- 17.2.5.3. SWOT Analysis
- 17.2.5.4. Recent Developments
- 17.2.5.5. Financials (Based on Availability)
- 17.2.6 Chubu Electric Power Co Inc *List Not Exhaustive
- 17.2.6.1. Overview
- 17.2.6.2. Products
- 17.2.6.3. SWOT Analysis
- 17.2.6.4. Recent Developments
- 17.2.6.5. Financials (Based on Availability)
- 17.2.7 Korea Electric Power Corporation (KEPCO)
- 17.2.7.1. Overview
- 17.2.7.2. Products
- 17.2.7.3. SWOT Analysis
- 17.2.7.4. Recent Developments
- 17.2.7.5. Financials (Based on Availability)
- 17.2.8 NTPC Ltd
- 17.2.8.1. Overview
- 17.2.8.2. Products
- 17.2.8.3. SWOT Analysis
- 17.2.8.4. Recent Developments
- 17.2.8.5. Financials (Based on Availability)
- 17.2.9 National Thermal Power Corporation Limited
- 17.2.9.1. Overview
- 17.2.9.2. Products
- 17.2.9.3. SWOT Analysis
- 17.2.9.4. Recent Developments
- 17.2.9.5. Financials (Based on Availability)
- 17.2.10 Enel S p A
- 17.2.10.1. Overview
- 17.2.10.2. Products
- 17.2.10.3. SWOT Analysis
- 17.2.10.4. Recent Developments
- 17.2.10.5. Financials (Based on Availability)
- 17.2.1 Engie SA
List of Figures
- Figure 1: Global Power Market Revenue Breakdown (Million, %) by Region 2024 & 2032
- Figure 2: North America Power Market Revenue (Million), by Country 2024 & 2032
- Figure 3: North America Power Market Revenue Share (%), by Country 2024 & 2032
- Figure 4: Europe Power Market Revenue (Million), by Country 2024 & 2032
- Figure 5: Europe Power Market Revenue Share (%), by Country 2024 & 2032
- Figure 6: Asia Pacific Power Market Revenue (Million), by Country 2024 & 2032
- Figure 7: Asia Pacific Power Market Revenue Share (%), by Country 2024 & 2032
- Figure 8: South America Power Market Revenue (Million), by Country 2024 & 2032
- Figure 9: South America Power Market Revenue Share (%), by Country 2024 & 2032
- Figure 10: North America Power Market Revenue (Million), by Country 2024 & 2032
- Figure 11: North America Power Market Revenue Share (%), by Country 2024 & 2032
- Figure 12: MEA Power Market Revenue (Million), by Country 2024 & 2032
- Figure 13: MEA Power Market Revenue Share (%), by Country 2024 & 2032
- Figure 14: North America Power Market Revenue (Million), by Power Generation - Source 2024 & 2032
- Figure 15: North America Power Market Revenue Share (%), by Power Generation - Source 2024 & 2032
- Figure 16: North America Power Market Revenue (Million), by Power Transmission and Distribution (T&D) 2024 & 2032
- Figure 17: North America Power Market Revenue Share (%), by Power Transmission and Distribution (T&D) 2024 & 2032
- Figure 18: North America Power Market Revenue (Million), by Country 2024 & 2032
- Figure 19: North America Power Market Revenue Share (%), by Country 2024 & 2032
- Figure 20: Asia Pacific Power Market Revenue (Million), by Power Generation - Source 2024 & 2032
- Figure 21: Asia Pacific Power Market Revenue Share (%), by Power Generation - Source 2024 & 2032
- Figure 22: Asia Pacific Power Market Revenue (Million), by Power Transmission and Distribution (T&D) 2024 & 2032
- Figure 23: Asia Pacific Power Market Revenue Share (%), by Power Transmission and Distribution (T&D) 2024 & 2032
- Figure 24: Asia Pacific Power Market Revenue (Million), by Country 2024 & 2032
- Figure 25: Asia Pacific Power Market Revenue Share (%), by Country 2024 & 2032
- Figure 26: Europe Power Market Revenue (Million), by Power Generation - Source 2024 & 2032
- Figure 27: Europe Power Market Revenue Share (%), by Power Generation - Source 2024 & 2032
- Figure 28: Europe Power Market Revenue (Million), by Power Transmission and Distribution (T&D) 2024 & 2032
- Figure 29: Europe Power Market Revenue Share (%), by Power Transmission and Distribution (T&D) 2024 & 2032
- Figure 30: Europe Power Market Revenue (Million), by Country 2024 & 2032
- Figure 31: Europe Power Market Revenue Share (%), by Country 2024 & 2032
- Figure 32: South America Power Market Revenue (Million), by Power Generation - Source 2024 & 2032
- Figure 33: South America Power Market Revenue Share (%), by Power Generation - Source 2024 & 2032
- Figure 34: South America Power Market Revenue (Million), by Power Transmission and Distribution (T&D) 2024 & 2032
- Figure 35: South America Power Market Revenue Share (%), by Power Transmission and Distribution (T&D) 2024 & 2032
- Figure 36: South America Power Market Revenue (Million), by Country 2024 & 2032
- Figure 37: South America Power Market Revenue Share (%), by Country 2024 & 2032
- Figure 38: Middle East and Africa Power Market Revenue (Million), by Power Generation - Source 2024 & 2032
- Figure 39: Middle East and Africa Power Market Revenue Share (%), by Power Generation - Source 2024 & 2032
- Figure 40: Middle East and Africa Power Market Revenue (Million), by Power Transmission and Distribution (T&D) 2024 & 2032
- Figure 41: Middle East and Africa Power Market Revenue Share (%), by Power Transmission and Distribution (T&D) 2024 & 2032
- Figure 42: Middle East and Africa Power Market Revenue (Million), by Country 2024 & 2032
- Figure 43: Middle East and Africa Power Market Revenue Share (%), by Country 2024 & 2032
List of Tables
- Table 1: Global Power Market Revenue Million Forecast, by Region 2019 & 2032
- Table 2: Global Power Market Revenue Million Forecast, by Power Generation - Source 2019 & 2032
- Table 3: Global Power Market Revenue Million Forecast, by Power Transmission and Distribution (T&D) 2019 & 2032
- Table 4: Global Power Market Revenue Million Forecast, by Region 2019 & 2032
- Table 5: Global Power Market Revenue Million Forecast, by Country 2019 & 2032
- Table 6: United States Power Market Revenue (Million) Forecast, by Application 2019 & 2032
- Table 7: Canada Power Market Revenue (Million) Forecast, by Application 2019 & 2032
- Table 8: Mexico Power Market Revenue (Million) Forecast, by Application 2019 & 2032
- Table 9: Global Power Market Revenue Million Forecast, by Country 2019 & 2032
- Table 10: Germany Power Market Revenue (Million) Forecast, by Application 2019 & 2032
- Table 11: United Kingdom Power Market Revenue (Million) Forecast, by Application 2019 & 2032
- Table 12: France Power Market Revenue (Million) Forecast, by Application 2019 & 2032
- Table 13: Spain Power Market Revenue (Million) Forecast, by Application 2019 & 2032
- Table 14: Italy Power Market Revenue (Million) Forecast, by Application 2019 & 2032
- Table 15: Spain Power Market Revenue (Million) Forecast, by Application 2019 & 2032
- Table 16: Belgium Power Market Revenue (Million) Forecast, by Application 2019 & 2032
- Table 17: Netherland Power Market Revenue (Million) Forecast, by Application 2019 & 2032
- Table 18: Nordics Power Market Revenue (Million) Forecast, by Application 2019 & 2032
- Table 19: Rest of Europe Power Market Revenue (Million) Forecast, by Application 2019 & 2032
- Table 20: Global Power Market Revenue Million Forecast, by Country 2019 & 2032
- Table 21: China Power Market Revenue (Million) Forecast, by Application 2019 & 2032
- Table 22: Japan Power Market Revenue (Million) Forecast, by Application 2019 & 2032
- Table 23: India Power Market Revenue (Million) Forecast, by Application 2019 & 2032
- Table 24: South Korea Power Market Revenue (Million) Forecast, by Application 2019 & 2032
- Table 25: Southeast Asia Power Market Revenue (Million) Forecast, by Application 2019 & 2032
- Table 26: Australia Power Market Revenue (Million) Forecast, by Application 2019 & 2032
- Table 27: Indonesia Power Market Revenue (Million) Forecast, by Application 2019 & 2032
- Table 28: Phillipes Power Market Revenue (Million) Forecast, by Application 2019 & 2032
- Table 29: Singapore Power Market Revenue (Million) Forecast, by Application 2019 & 2032
- Table 30: Thailandc Power Market Revenue (Million) Forecast, by Application 2019 & 2032
- Table 31: Rest of Asia Pacific Power Market Revenue (Million) Forecast, by Application 2019 & 2032
- Table 32: Global Power Market Revenue Million Forecast, by Country 2019 & 2032
- Table 33: Brazil Power Market Revenue (Million) Forecast, by Application 2019 & 2032
- Table 34: Argentina Power Market Revenue (Million) Forecast, by Application 2019 & 2032
- Table 35: Peru Power Market Revenue (Million) Forecast, by Application 2019 & 2032
- Table 36: Chile Power Market Revenue (Million) Forecast, by Application 2019 & 2032
- Table 37: Colombia Power Market Revenue (Million) Forecast, by Application 2019 & 2032
- Table 38: Ecuador Power Market Revenue (Million) Forecast, by Application 2019 & 2032
- Table 39: Venezuela Power Market Revenue (Million) Forecast, by Application 2019 & 2032
- Table 40: Rest of South America Power Market Revenue (Million) Forecast, by Application 2019 & 2032
- Table 41: Global Power Market Revenue Million Forecast, by Country 2019 & 2032
- Table 42: United States Power Market Revenue (Million) Forecast, by Application 2019 & 2032
- Table 43: Canada Power Market Revenue (Million) Forecast, by Application 2019 & 2032
- Table 44: Mexico Power Market Revenue (Million) Forecast, by Application 2019 & 2032
- Table 45: Global Power Market Revenue Million Forecast, by Country 2019 & 2032
- Table 46: United Arab Emirates Power Market Revenue (Million) Forecast, by Application 2019 & 2032
- Table 47: Saudi Arabia Power Market Revenue (Million) Forecast, by Application 2019 & 2032
- Table 48: South Africa Power Market Revenue (Million) Forecast, by Application 2019 & 2032
- Table 49: Rest of Middle East and Africa Power Market Revenue (Million) Forecast, by Application 2019 & 2032
- Table 50: Global Power Market Revenue Million Forecast, by Power Generation - Source 2019 & 2032
- Table 51: Global Power Market Revenue Million Forecast, by Power Transmission and Distribution (T&D) 2019 & 2032
- Table 52: Global Power Market Revenue Million Forecast, by Country 2019 & 2032
- Table 53: Global Power Market Revenue Million Forecast, by Power Generation - Source 2019 & 2032
- Table 54: Global Power Market Revenue Million Forecast, by Power Transmission and Distribution (T&D) 2019 & 2032
- Table 55: Global Power Market Revenue Million Forecast, by Country 2019 & 2032
- Table 56: Global Power Market Revenue Million Forecast, by Power Generation - Source 2019 & 2032
- Table 57: Global Power Market Revenue Million Forecast, by Power Transmission and Distribution (T&D) 2019 & 2032
- Table 58: Global Power Market Revenue Million Forecast, by Country 2019 & 2032
- Table 59: Global Power Market Revenue Million Forecast, by Power Generation - Source 2019 & 2032
- Table 60: Global Power Market Revenue Million Forecast, by Power Transmission and Distribution (T&D) 2019 & 2032
- Table 61: Global Power Market Revenue Million Forecast, by Country 2019 & 2032
- Table 62: Global Power Market Revenue Million Forecast, by Power Generation - Source 2019 & 2032
- Table 63: Global Power Market Revenue Million Forecast, by Power Transmission and Distribution (T&D) 2019 & 2032
- Table 64: Global Power Market Revenue Million Forecast, by Country 2019 & 2032
Frequently Asked Questions
1. What is the projected Compound Annual Growth Rate (CAGR) of the Power Market?
The projected CAGR is approximately 4.89%.
2. Which companies are prominent players in the Power Market?
Key companies in the market include Engie SA, State Grid Corporation of China, Iberdrola S A, Tokyo Electric Power Company Holding Inc, Electricite de France S A, Chubu Electric Power Co Inc *List Not Exhaustive, Korea Electric Power Corporation (KEPCO), NTPC Ltd, National Thermal Power Corporation Limited, Enel S p A.
3. What are the main segments of the Power Market?
The market segments include Power Generation - Source, Power Transmission and Distribution (T&D) .
4. Can you provide details about the market size?
The market size is estimated to be USD XX Million as of 2022.
5. What are some drivers contributing to market growth?
4.; Growing Electricity Generation along with Energy Consumption Demand4.8.; Increasing adoption of Renewable Energy.
6. What are the notable trends driving market growth?
Thermal Source for Power Generation to be the Largest Market.
7. Are there any restraints impacting market growth?
4.; Phasing out of Coal-Based Power Plants.
8. Can you provide examples of recent developments in the market?
In April 2023, ArcelorMittal announced that the company's Brazilian entity, ArcelorMittal Brazil, formed a joint venture with the Brazilian renewable energy company Casa dos Ventos to develop the 554 MW Babilonia wind power project. The project will be developed for USD 800 million in the central region of Bahia, northeast Brazil. ArcelorMittal will hold a 55% share in the joint venture, and Casa dos Ventos will have the remaining share.
9. What pricing options are available for accessing the report?
Pricing options include single-user, multi-user, and enterprise licenses priced at USD 4750, USD 5250, and USD 8750 respectively.
10. Is the market size provided in terms of value or volume?
The market size is provided in terms of value, measured in Million.
11. Are there any specific market keywords associated with the report?
Yes, the market keyword associated with the report is "Power Market," which aids in identifying and referencing the specific market segment covered.
12. How do I determine which pricing option suits my needs best?
The pricing options vary based on user requirements and access needs. Individual users may opt for single-user licenses, while businesses requiring broader access may choose multi-user or enterprise licenses for cost-effective access to the report.
13. Are there any additional resources or data provided in the Power Market report?
While the report offers comprehensive insights, it's advisable to review the specific contents or supplementary materials provided to ascertain if additional resources or data are available.
14. How can I stay updated on further developments or reports in the Power Market?
To stay informed about further developments, trends, and reports in the Power Market, consider subscribing to industry newsletters, following relevant companies and organizations, or regularly checking reputable industry news sources and publications.
Methodology
Step 1 - Identification of Relevant Samples Size from Population Database


Step 2 - Approaches for Defining Global Market Size (Value, Volume* & Price*)

Note*: In applicable scenarios
Step 3 - Data Sources
Primary Research
- Web Analytics
- Survey Reports
- Research Institute
- Latest Research Reports
- Opinion Leaders
Secondary Research
- Annual Reports
- White Paper
- Latest Press Release
- Industry Association
- Paid Database
- Investor Presentations

Step 4 - Data Triangulation
Involves using different sources of information in order to increase the validity of a study
These sources are likely to be stakeholders in a program - participants, other researchers, program staff, other community members, and so on.
Then we put all data in single framework & apply various statistical tools to find out the dynamic on the market.
During the analysis stage, feedback from the stakeholder groups would be compared to determine areas of agreement as well as areas of divergence


