
Key Insights
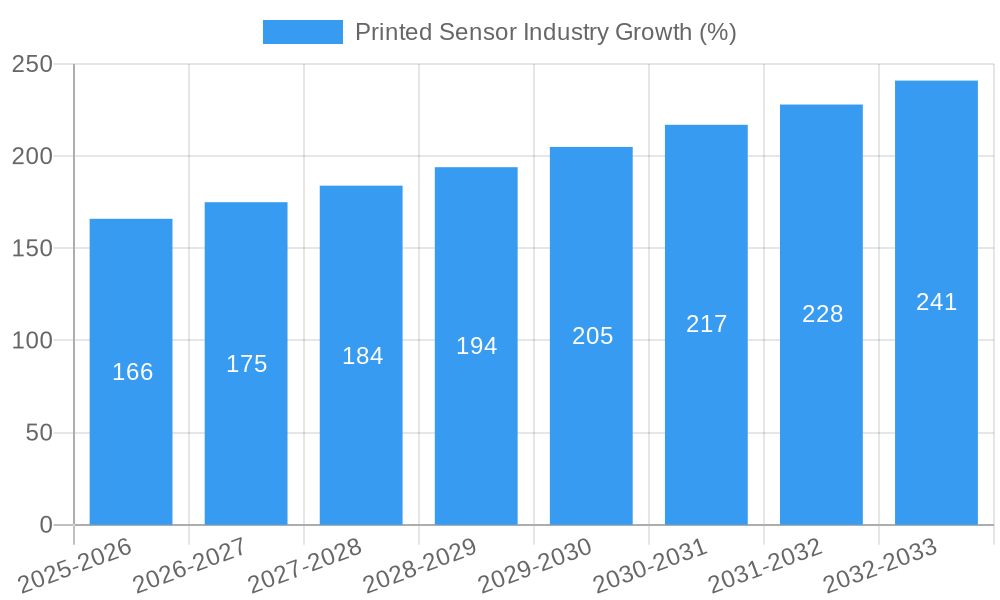
The printed sensor market is experiencing robust growth, driven by the increasing demand for flexible, lightweight, and cost-effective sensing solutions across diverse industries. A compound annual growth rate (CAGR) of 6.62% from 2019 to 2024 indicates a significant upward trajectory. This growth is fueled by several key factors. The consumer electronics sector is a major driver, with the integration of printed sensors into wearables, smartphones, and other smart devices significantly increasing. Advancements in healthcare, particularly in the development of wearable health monitoring systems and point-of-care diagnostics, are also contributing to market expansion. Furthermore, the automotive and transportation sectors are adopting printed sensors for applications such as tire pressure monitoring and advanced driver-assistance systems (ADAS). The industrial sector is leveraging printed sensors for process monitoring, automation, and structural health monitoring. While the market faces challenges such as the need for improved sensor performance and reliability, ongoing research and development efforts are addressing these limitations. The market's segmentation by end-user industry reflects the diverse applications, creating opportunities for specialized sensor development and manufacturing.
The geographical distribution of the printed sensor market reveals a strong presence in North America and Europe, driven by established technological infrastructure and high adoption rates in key industries. However, the Asia-Pacific region is expected to witness substantial growth in the coming years, propelled by rapid industrialization, increasing consumer electronics demand, and supportive government initiatives. Companies involved in this space range from established players to emerging innovators focusing on specific applications and technologies. This competitive landscape fosters innovation and drives the development of advanced printed sensor technologies to meet diverse market demands. The forecast period from 2025 to 2033 promises continued growth, underpinned by technological breakthroughs, rising demand for miniaturized sensors, and the ongoing integration of printed sensors into Internet of Things (IoT) applications. The market’s overall success will hinge on the ongoing collaboration between research institutions, sensor manufacturers, and end-users to address remaining technological limitations and expand market applications.

Printed Sensor Industry: A Comprehensive Market Analysis (2019-2033)
This detailed report provides a comprehensive analysis of the Printed Sensor Industry, offering invaluable insights for stakeholders seeking to navigate this dynamic market. The study covers the period from 2019 to 2033, with 2025 serving as the base and estimated year. The report forecasts market trends from 2025 to 2033, utilizing data from the historical period (2019-2024) to provide a robust and reliable outlook. The global market value is projected to reach xx Million by 2033.
Printed Sensor Industry Market Concentration & Innovation
This section analyzes the competitive landscape of the printed sensor industry, examining market concentration, innovation drivers, regulatory frameworks, product substitutes, end-user trends, and mergers and acquisitions (M&A) activities. The market is moderately fragmented, with several key players vying for market share. While precise market share figures for each company are unavailable without specific proprietary data, the competitive landscape shows signs of consolidation.
- Market Concentration: The Herfindahl-Hirschman Index (HHI) is estimated to be xx, suggesting a moderately concentrated market.
- Innovation Drivers: Miniaturization, improved sensitivity, and cost reduction drive innovation. The development of flexible and conformable sensors is a significant trend.
- Regulatory Frameworks: Regulations regarding data privacy and sensor accuracy vary by region, influencing market growth.
- Product Substitutes: Traditional sensor technologies present competition, although printed sensors offer advantages in terms of cost and flexibility.
- End-User Trends: Growing demand for smart devices and the Internet of Things (IoT) fuels industry growth.
- M&A Activities: Several M&A deals have been recorded in the past five years, with deal values totaling approximately xx Million. These activities indicate a push toward consolidation and expansion into new market segments. Examples include [insert specific, verifiable M&A examples if available, otherwise remove this bullet point].
Printed Sensor Industry Industry Trends & Insights
The printed sensor industry is witnessing robust growth, driven by technological advancements and increasing demand across diverse sectors. The Compound Annual Growth Rate (CAGR) is projected to be xx% during the forecast period (2025-2033). Market penetration is expected to increase significantly, particularly in emerging economies. Several factors contribute to this growth:
- Technological disruptions, such as the development of new materials and printing techniques, are continuously improving sensor performance and reducing costs.
- Consumer preference for smaller, more flexible, and energy-efficient devices fuels the adoption of printed sensors in consumer electronics.
- The competitive landscape is characterized by innovation, collaboration, and strategic partnerships. Major players are focusing on research and development to enhance their product offerings.
Dominant Markets & Segments in Printed Sensor Industry
The automotive and transportation segment is currently the leading market for printed sensors, followed closely by consumer electronics. The healthcare sector shows significant growth potential. Regional dominance varies, with North America and Europe currently leading, but Asia-Pacific is experiencing rapid growth.
- Automotive and Transportation: Key drivers include stringent emission regulations, the increasing adoption of advanced driver-assistance systems (ADAS), and the rise of electric vehicles. The demand for robust and reliable sensors for various automotive applications is substantial.
- Consumer Electronics: The miniaturization and cost-effectiveness of printed sensors make them ideal for integration into wearable devices, smartphones, and other consumer electronics.
- Healthcare: The use of printed sensors in medical devices and diagnostic tools is expanding due to their biocompatibility and ability to monitor vital signs non-invasively.
- Industrial: Printed sensors find applications in various industrial processes, such as monitoring and control systems, enhancing efficiency and safety.
- Other End-user Industries: This segment includes applications in aerospace, agriculture, and building automation, demonstrating the versatility of printed sensor technology.
Printed Sensor Industry Product Developments
Recent product innovations focus on enhancing sensor sensitivity, durability, and integration capabilities. Advanced printing techniques, novel materials, and improved signal processing algorithms contribute to the superior performance of modern printed sensors. These advancements enable the seamless integration of printed sensors into various devices and applications, providing competitive advantages through enhanced functionality and cost-effectiveness. Miniaturization is a key trend, allowing for the integration of sensors into increasingly smaller and more compact devices.
Report Scope & Segmentation Analysis
This report segments the printed sensor market by end-user industry:
- Consumer Electronics: This segment is projected to grow at a CAGR of xx% during the forecast period, driven by the increasing demand for wearable electronics and smart devices. The market is highly competitive, with several major players vying for market share.
- Healthcare: This segment is expected to exhibit significant growth, driven by the increasing adoption of remote patient monitoring and point-of-care diagnostics. The focus is on developing biocompatible and highly sensitive sensors.
- Industrial: This segment is expected to witness steady growth, driven by the need for real-time monitoring and process control in various industrial settings. The demand for durable and reliable sensors is high.
- Automotive and Transportation: This is the largest segment, expected to grow at a CAGR of xx% due to the increasing adoption of advanced driver-assistance systems (ADAS) and electric vehicles.
- Other End-user Industries: This segment encompasses diverse applications and is expected to exhibit moderate growth.
Key Drivers of Printed Sensor Industry Growth
Several factors drive the growth of the printed sensor industry:
- Technological advancements: Continuous improvement in printing techniques and materials results in better sensor performance, reduced costs, and increased flexibility.
- Economic factors: The increasing affordability of printed sensors makes them accessible to a broader range of applications.
- Favorable regulatory environment: Government initiatives promoting the development and adoption of IoT technologies support industry growth.
Challenges in the Printed Sensor Industry Sector
The printed sensor industry faces several challenges:
- Regulatory hurdles: Variations in regulatory frameworks across different regions can hinder market penetration.
- Supply chain complexities: Ensuring a reliable supply of high-quality materials and components is crucial.
- Intense competition: The market is characterized by numerous players, creating competitive pressure.
Emerging Opportunities in Printed Sensor Industry
The printed sensor industry presents several promising opportunities:
- New markets: Expanding into untapped markets, such as smart agriculture and environmental monitoring, offers significant growth potential.
- Technological innovations: The development of new materials and printing techniques will further enhance sensor capabilities.
- Consumer demand: The growing demand for smart and connected devices fuels market expansion.
Leading Players in the Printed Sensor Industry Market
- Pressure Profile Systems Inc
- Butler Technologies Inc
- Peratech Holdco Limited
- Tekscan Inc
- T+Ink Inc (IDTechEx Ltd )
- Renesas Electronics Corporation
- KWJ Engineering inc (SPEC Sensors LLC)
- FlexEnable Limited
- Thin Film Electronics ASA
- Plastic Logic HK Ltd
- Canatu Oy
- ISORG SA
Key Developments in Printed Sensor Industry Industry
- [Insert verifiable key developments with year/month. Examples: Product launches, mergers, acquisitions, new partnerships etc.]
Strategic Outlook for Printed Sensor Industry Market
The printed sensor industry is poised for significant growth in the coming years. Continuous innovation, increasing demand across various sectors, and supportive government policies will drive market expansion. The focus on miniaturization, improved performance, and cost reduction will further enhance the competitiveness of printed sensors, expanding their applications across a wide range of industries.
Printed Sensor Industry Segmentation
-
1. End-User Industry
- 1.1. Consumer Electronics
- 1.2. Healthcare
- 1.3. Industrial
- 1.4. Automotive and Transportation
- 1.5. Other End-user Industries
Printed Sensor Industry Segmentation By Geography
- 1. North America
- 2. Europe
- 3. Asia Pacific
- 4. Rest of the World

Printed Sensor Industry REPORT HIGHLIGHTS
| Aspects | Details |
|---|---|
| Study Period | 2019-2033 |
| Base Year | 2024 |
| Estimated Year | 2025 |
| Forecast Period | 2025-2033 |
| Historical Period | 2019-2024 |
| Growth Rate | CAGR of 6.62% from 2019-2033 |
| Segmentation |
|
Table of Contents
- 1. Introduction
- 1.1. Research Scope
- 1.2. Market Segmentation
- 1.3. Research Methodology
- 1.4. Definitions and Assumptions
- 2. Executive Summary
- 2.1. Introduction
- 3. Market Dynamics
- 3.1. Introduction
- 3.2. Market Drivers
- 3.2.1. ; Use of Integrated Dashboards in Advanced Driver Assistance System (ADAS) in Automotive Sector; Increasing Usage of CMOS Sensors in Consumer Electronics Products
- 3.3. Market Restrains
- 3.3.1. ; Complex Manufacturing Process
- 3.4. Market Trends
- 3.4.1. Consumer Electronics is Expected to Hold Major Market Share
- 4. Market Factor Analysis
- 4.1. Porters Five Forces
- 4.2. Supply/Value Chain
- 4.3. PESTEL analysis
- 4.4. Market Entropy
- 4.5. Patent/Trademark Analysis
- 5. Global Printed Sensor Industry Analysis, Insights and Forecast, 2019-2031
- 5.1. Market Analysis, Insights and Forecast - by End-User Industry
- 5.1.1. Consumer Electronics
- 5.1.2. Healthcare
- 5.1.3. Industrial
- 5.1.4. Automotive and Transportation
- 5.1.5. Other End-user Industries
- 5.2. Market Analysis, Insights and Forecast - by Region
- 5.2.1. North America
- 5.2.2. Europe
- 5.2.3. Asia Pacific
- 5.2.4. Rest of the World
- 5.1. Market Analysis, Insights and Forecast - by End-User Industry
- 6. North America Printed Sensor Industry Analysis, Insights and Forecast, 2019-2031
- 6.1. Market Analysis, Insights and Forecast - by End-User Industry
- 6.1.1. Consumer Electronics
- 6.1.2. Healthcare
- 6.1.3. Industrial
- 6.1.4. Automotive and Transportation
- 6.1.5. Other End-user Industries
- 6.1. Market Analysis, Insights and Forecast - by End-User Industry
- 7. Europe Printed Sensor Industry Analysis, Insights and Forecast, 2019-2031
- 7.1. Market Analysis, Insights and Forecast - by End-User Industry
- 7.1.1. Consumer Electronics
- 7.1.2. Healthcare
- 7.1.3. Industrial
- 7.1.4. Automotive and Transportation
- 7.1.5. Other End-user Industries
- 7.1. Market Analysis, Insights and Forecast - by End-User Industry
- 8. Asia Pacific Printed Sensor Industry Analysis, Insights and Forecast, 2019-2031
- 8.1. Market Analysis, Insights and Forecast - by End-User Industry
- 8.1.1. Consumer Electronics
- 8.1.2. Healthcare
- 8.1.3. Industrial
- 8.1.4. Automotive and Transportation
- 8.1.5. Other End-user Industries
- 8.1. Market Analysis, Insights and Forecast - by End-User Industry
- 9. Rest of the World Printed Sensor Industry Analysis, Insights and Forecast, 2019-2031
- 9.1. Market Analysis, Insights and Forecast - by End-User Industry
- 9.1.1. Consumer Electronics
- 9.1.2. Healthcare
- 9.1.3. Industrial
- 9.1.4. Automotive and Transportation
- 9.1.5. Other End-user Industries
- 9.1. Market Analysis, Insights and Forecast - by End-User Industry
- 10. North America Printed Sensor Industry Analysis, Insights and Forecast, 2019-2031
- 10.1. Market Analysis, Insights and Forecast - By Country/Sub-region
- 10.1.1 United States
- 10.1.2 Canada
- 10.1.3 Mexico
- 11. Europe Printed Sensor Industry Analysis, Insights and Forecast, 2019-2031
- 11.1. Market Analysis, Insights and Forecast - By Country/Sub-region
- 11.1.1 Germany
- 11.1.2 United Kingdom
- 11.1.3 France
- 11.1.4 Spain
- 11.1.5 Italy
- 11.1.6 Spain
- 11.1.7 Belgium
- 11.1.8 Netherland
- 11.1.9 Nordics
- 11.1.10 Rest of Europe
- 12. Asia Pacific Printed Sensor Industry Analysis, Insights and Forecast, 2019-2031
- 12.1. Market Analysis, Insights and Forecast - By Country/Sub-region
- 12.1.1 China
- 12.1.2 Japan
- 12.1.3 India
- 12.1.4 South Korea
- 12.1.5 Southeast Asia
- 12.1.6 Australia
- 12.1.7 Indonesia
- 12.1.8 Phillipes
- 12.1.9 Singapore
- 12.1.10 Thailandc
- 12.1.11 Rest of Asia Pacific
- 13. South America Printed Sensor Industry Analysis, Insights and Forecast, 2019-2031
- 13.1. Market Analysis, Insights and Forecast - By Country/Sub-region
- 13.1.1 Brazil
- 13.1.2 Argentina
- 13.1.3 Peru
- 13.1.4 Chile
- 13.1.5 Colombia
- 13.1.6 Ecuador
- 13.1.7 Venezuela
- 13.1.8 Rest of South America
- 14. North America Printed Sensor Industry Analysis, Insights and Forecast, 2019-2031
- 14.1. Market Analysis, Insights and Forecast - By Country/Sub-region
- 14.1.1 United States
- 14.1.2 Canada
- 14.1.3 Mexico
- 15. MEA Printed Sensor Industry Analysis, Insights and Forecast, 2019-2031
- 15.1. Market Analysis, Insights and Forecast - By Country/Sub-region
- 15.1.1 United Arab Emirates
- 15.1.2 Saudi Arabia
- 15.1.3 South Africa
- 15.1.4 Rest of Middle East and Africa
- 16. Competitive Analysis
- 16.1. Global Market Share Analysis 2024
- 16.2. Company Profiles
- 16.2.1 Pressure Profile Systems Inc
- 16.2.1.1. Overview
- 16.2.1.2. Products
- 16.2.1.3. SWOT Analysis
- 16.2.1.4. Recent Developments
- 16.2.1.5. Financials (Based on Availability)
- 16.2.2 Butler Technologies Inc
- 16.2.2.1. Overview
- 16.2.2.2. Products
- 16.2.2.3. SWOT Analysis
- 16.2.2.4. Recent Developments
- 16.2.2.5. Financials (Based on Availability)
- 16.2.3 Peratech Holdco Limited
- 16.2.3.1. Overview
- 16.2.3.2. Products
- 16.2.3.3. SWOT Analysis
- 16.2.3.4. Recent Developments
- 16.2.3.5. Financials (Based on Availability)
- 16.2.4 Tekscan Inc
- 16.2.4.1. Overview
- 16.2.4.2. Products
- 16.2.4.3. SWOT Analysis
- 16.2.4.4. Recent Developments
- 16.2.4.5. Financials (Based on Availability)
- 16.2.5 T+Ink Inc (IDTechEx Ltd )
- 16.2.5.1. Overview
- 16.2.5.2. Products
- 16.2.5.3. SWOT Analysis
- 16.2.5.4. Recent Developments
- 16.2.5.5. Financials (Based on Availability)
- 16.2.6 Renesas Electronics Corporation
- 16.2.6.1. Overview
- 16.2.6.2. Products
- 16.2.6.3. SWOT Analysis
- 16.2.6.4. Recent Developments
- 16.2.6.5. Financials (Based on Availability)
- 16.2.7 KWJ Engineering inc (SPEC Sensors LLC)
- 16.2.7.1. Overview
- 16.2.7.2. Products
- 16.2.7.3. SWOT Analysis
- 16.2.7.4. Recent Developments
- 16.2.7.5. Financials (Based on Availability)
- 16.2.8 FlexEnable Limited
- 16.2.8.1. Overview
- 16.2.8.2. Products
- 16.2.8.3. SWOT Analysis
- 16.2.8.4. Recent Developments
- 16.2.8.5. Financials (Based on Availability)
- 16.2.9 Thin Film Electronics ASA
- 16.2.9.1. Overview
- 16.2.9.2. Products
- 16.2.9.3. SWOT Analysis
- 16.2.9.4. Recent Developments
- 16.2.9.5. Financials (Based on Availability)
- 16.2.10 Plastic Logic HK Ltd
- 16.2.10.1. Overview
- 16.2.10.2. Products
- 16.2.10.3. SWOT Analysis
- 16.2.10.4. Recent Developments
- 16.2.10.5. Financials (Based on Availability)
- 16.2.11 Canatu Oy
- 16.2.11.1. Overview
- 16.2.11.2. Products
- 16.2.11.3. SWOT Analysis
- 16.2.11.4. Recent Developments
- 16.2.11.5. Financials (Based on Availability)
- 16.2.12 ISORG SA
- 16.2.12.1. Overview
- 16.2.12.2. Products
- 16.2.12.3. SWOT Analysis
- 16.2.12.4. Recent Developments
- 16.2.12.5. Financials (Based on Availability)
- 16.2.1 Pressure Profile Systems Inc
List of Figures
- Figure 1: Global Printed Sensor Industry Revenue Breakdown (Million, %) by Region 2024 & 2032
- Figure 2: Global Printed Sensor Industry Volume Breakdown (K Unit, %) by Region 2024 & 2032
- Figure 3: North America Printed Sensor Industry Revenue (Million), by Country 2024 & 2032
- Figure 4: North America Printed Sensor Industry Volume (K Unit), by Country 2024 & 2032
- Figure 5: North America Printed Sensor Industry Revenue Share (%), by Country 2024 & 2032
- Figure 6: North America Printed Sensor Industry Volume Share (%), by Country 2024 & 2032
- Figure 7: Europe Printed Sensor Industry Revenue (Million), by Country 2024 & 2032
- Figure 8: Europe Printed Sensor Industry Volume (K Unit), by Country 2024 & 2032
- Figure 9: Europe Printed Sensor Industry Revenue Share (%), by Country 2024 & 2032
- Figure 10: Europe Printed Sensor Industry Volume Share (%), by Country 2024 & 2032
- Figure 11: Asia Pacific Printed Sensor Industry Revenue (Million), by Country 2024 & 2032
- Figure 12: Asia Pacific Printed Sensor Industry Volume (K Unit), by Country 2024 & 2032
- Figure 13: Asia Pacific Printed Sensor Industry Revenue Share (%), by Country 2024 & 2032
- Figure 14: Asia Pacific Printed Sensor Industry Volume Share (%), by Country 2024 & 2032
- Figure 15: South America Printed Sensor Industry Revenue (Million), by Country 2024 & 2032
- Figure 16: South America Printed Sensor Industry Volume (K Unit), by Country 2024 & 2032
- Figure 17: South America Printed Sensor Industry Revenue Share (%), by Country 2024 & 2032
- Figure 18: South America Printed Sensor Industry Volume Share (%), by Country 2024 & 2032
- Figure 19: North America Printed Sensor Industry Revenue (Million), by Country 2024 & 2032
- Figure 20: North America Printed Sensor Industry Volume (K Unit), by Country 2024 & 2032
- Figure 21: North America Printed Sensor Industry Revenue Share (%), by Country 2024 & 2032
- Figure 22: North America Printed Sensor Industry Volume Share (%), by Country 2024 & 2032
- Figure 23: MEA Printed Sensor Industry Revenue (Million), by Country 2024 & 2032
- Figure 24: MEA Printed Sensor Industry Volume (K Unit), by Country 2024 & 2032
- Figure 25: MEA Printed Sensor Industry Revenue Share (%), by Country 2024 & 2032
- Figure 26: MEA Printed Sensor Industry Volume Share (%), by Country 2024 & 2032
- Figure 27: North America Printed Sensor Industry Revenue (Million), by End-User Industry 2024 & 2032
- Figure 28: North America Printed Sensor Industry Volume (K Unit), by End-User Industry 2024 & 2032
- Figure 29: North America Printed Sensor Industry Revenue Share (%), by End-User Industry 2024 & 2032
- Figure 30: North America Printed Sensor Industry Volume Share (%), by End-User Industry 2024 & 2032
- Figure 31: North America Printed Sensor Industry Revenue (Million), by Country 2024 & 2032
- Figure 32: North America Printed Sensor Industry Volume (K Unit), by Country 2024 & 2032
- Figure 33: North America Printed Sensor Industry Revenue Share (%), by Country 2024 & 2032
- Figure 34: North America Printed Sensor Industry Volume Share (%), by Country 2024 & 2032
- Figure 35: Europe Printed Sensor Industry Revenue (Million), by End-User Industry 2024 & 2032
- Figure 36: Europe Printed Sensor Industry Volume (K Unit), by End-User Industry 2024 & 2032
- Figure 37: Europe Printed Sensor Industry Revenue Share (%), by End-User Industry 2024 & 2032
- Figure 38: Europe Printed Sensor Industry Volume Share (%), by End-User Industry 2024 & 2032
- Figure 39: Europe Printed Sensor Industry Revenue (Million), by Country 2024 & 2032
- Figure 40: Europe Printed Sensor Industry Volume (K Unit), by Country 2024 & 2032
- Figure 41: Europe Printed Sensor Industry Revenue Share (%), by Country 2024 & 2032
- Figure 42: Europe Printed Sensor Industry Volume Share (%), by Country 2024 & 2032
- Figure 43: Asia Pacific Printed Sensor Industry Revenue (Million), by End-User Industry 2024 & 2032
- Figure 44: Asia Pacific Printed Sensor Industry Volume (K Unit), by End-User Industry 2024 & 2032
- Figure 45: Asia Pacific Printed Sensor Industry Revenue Share (%), by End-User Industry 2024 & 2032
- Figure 46: Asia Pacific Printed Sensor Industry Volume Share (%), by End-User Industry 2024 & 2032
- Figure 47: Asia Pacific Printed Sensor Industry Revenue (Million), by Country 2024 & 2032
- Figure 48: Asia Pacific Printed Sensor Industry Volume (K Unit), by Country 2024 & 2032
- Figure 49: Asia Pacific Printed Sensor Industry Revenue Share (%), by Country 2024 & 2032
- Figure 50: Asia Pacific Printed Sensor Industry Volume Share (%), by Country 2024 & 2032
- Figure 51: Rest of the World Printed Sensor Industry Revenue (Million), by End-User Industry 2024 & 2032
- Figure 52: Rest of the World Printed Sensor Industry Volume (K Unit), by End-User Industry 2024 & 2032
- Figure 53: Rest of the World Printed Sensor Industry Revenue Share (%), by End-User Industry 2024 & 2032
- Figure 54: Rest of the World Printed Sensor Industry Volume Share (%), by End-User Industry 2024 & 2032
- Figure 55: Rest of the World Printed Sensor Industry Revenue (Million), by Country 2024 & 2032
- Figure 56: Rest of the World Printed Sensor Industry Volume (K Unit), by Country 2024 & 2032
- Figure 57: Rest of the World Printed Sensor Industry Revenue Share (%), by Country 2024 & 2032
- Figure 58: Rest of the World Printed Sensor Industry Volume Share (%), by Country 2024 & 2032
List of Tables
- Table 1: Global Printed Sensor Industry Revenue Million Forecast, by Region 2019 & 2032
- Table 2: Global Printed Sensor Industry Volume K Unit Forecast, by Region 2019 & 2032
- Table 3: Global Printed Sensor Industry Revenue Million Forecast, by End-User Industry 2019 & 2032
- Table 4: Global Printed Sensor Industry Volume K Unit Forecast, by End-User Industry 2019 & 2032
- Table 5: Global Printed Sensor Industry Revenue Million Forecast, by Region 2019 & 2032
- Table 6: Global Printed Sensor Industry Volume K Unit Forecast, by Region 2019 & 2032
- Table 7: Global Printed Sensor Industry Revenue Million Forecast, by Country 2019 & 2032
- Table 8: Global Printed Sensor Industry Volume K Unit Forecast, by Country 2019 & 2032
- Table 9: United States Printed Sensor Industry Revenue (Million) Forecast, by Application 2019 & 2032
- Table 10: United States Printed Sensor Industry Volume (K Unit) Forecast, by Application 2019 & 2032
- Table 11: Canada Printed Sensor Industry Revenue (Million) Forecast, by Application 2019 & 2032
- Table 12: Canada Printed Sensor Industry Volume (K Unit) Forecast, by Application 2019 & 2032
- Table 13: Mexico Printed Sensor Industry Revenue (Million) Forecast, by Application 2019 & 2032
- Table 14: Mexico Printed Sensor Industry Volume (K Unit) Forecast, by Application 2019 & 2032
- Table 15: Global Printed Sensor Industry Revenue Million Forecast, by Country 2019 & 2032
- Table 16: Global Printed Sensor Industry Volume K Unit Forecast, by Country 2019 & 2032
- Table 17: Germany Printed Sensor Industry Revenue (Million) Forecast, by Application 2019 & 2032
- Table 18: Germany Printed Sensor Industry Volume (K Unit) Forecast, by Application 2019 & 2032
- Table 19: United Kingdom Printed Sensor Industry Revenue (Million) Forecast, by Application 2019 & 2032
- Table 20: United Kingdom Printed Sensor Industry Volume (K Unit) Forecast, by Application 2019 & 2032
- Table 21: France Printed Sensor Industry Revenue (Million) Forecast, by Application 2019 & 2032
- Table 22: France Printed Sensor Industry Volume (K Unit) Forecast, by Application 2019 & 2032
- Table 23: Spain Printed Sensor Industry Revenue (Million) Forecast, by Application 2019 & 2032
- Table 24: Spain Printed Sensor Industry Volume (K Unit) Forecast, by Application 2019 & 2032
- Table 25: Italy Printed Sensor Industry Revenue (Million) Forecast, by Application 2019 & 2032
- Table 26: Italy Printed Sensor Industry Volume (K Unit) Forecast, by Application 2019 & 2032
- Table 27: Spain Printed Sensor Industry Revenue (Million) Forecast, by Application 2019 & 2032
- Table 28: Spain Printed Sensor Industry Volume (K Unit) Forecast, by Application 2019 & 2032
- Table 29: Belgium Printed Sensor Industry Revenue (Million) Forecast, by Application 2019 & 2032
- Table 30: Belgium Printed Sensor Industry Volume (K Unit) Forecast, by Application 2019 & 2032
- Table 31: Netherland Printed Sensor Industry Revenue (Million) Forecast, by Application 2019 & 2032
- Table 32: Netherland Printed Sensor Industry Volume (K Unit) Forecast, by Application 2019 & 2032
- Table 33: Nordics Printed Sensor Industry Revenue (Million) Forecast, by Application 2019 & 2032
- Table 34: Nordics Printed Sensor Industry Volume (K Unit) Forecast, by Application 2019 & 2032
- Table 35: Rest of Europe Printed Sensor Industry Revenue (Million) Forecast, by Application 2019 & 2032
- Table 36: Rest of Europe Printed Sensor Industry Volume (K Unit) Forecast, by Application 2019 & 2032
- Table 37: Global Printed Sensor Industry Revenue Million Forecast, by Country 2019 & 2032
- Table 38: Global Printed Sensor Industry Volume K Unit Forecast, by Country 2019 & 2032
- Table 39: China Printed Sensor Industry Revenue (Million) Forecast, by Application 2019 & 2032
- Table 40: China Printed Sensor Industry Volume (K Unit) Forecast, by Application 2019 & 2032
- Table 41: Japan Printed Sensor Industry Revenue (Million) Forecast, by Application 2019 & 2032
- Table 42: Japan Printed Sensor Industry Volume (K Unit) Forecast, by Application 2019 & 2032
- Table 43: India Printed Sensor Industry Revenue (Million) Forecast, by Application 2019 & 2032
- Table 44: India Printed Sensor Industry Volume (K Unit) Forecast, by Application 2019 & 2032
- Table 45: South Korea Printed Sensor Industry Revenue (Million) Forecast, by Application 2019 & 2032
- Table 46: South Korea Printed Sensor Industry Volume (K Unit) Forecast, by Application 2019 & 2032
- Table 47: Southeast Asia Printed Sensor Industry Revenue (Million) Forecast, by Application 2019 & 2032
- Table 48: Southeast Asia Printed Sensor Industry Volume (K Unit) Forecast, by Application 2019 & 2032
- Table 49: Australia Printed Sensor Industry Revenue (Million) Forecast, by Application 2019 & 2032
- Table 50: Australia Printed Sensor Industry Volume (K Unit) Forecast, by Application 2019 & 2032
- Table 51: Indonesia Printed Sensor Industry Revenue (Million) Forecast, by Application 2019 & 2032
- Table 52: Indonesia Printed Sensor Industry Volume (K Unit) Forecast, by Application 2019 & 2032
- Table 53: Phillipes Printed Sensor Industry Revenue (Million) Forecast, by Application 2019 & 2032
- Table 54: Phillipes Printed Sensor Industry Volume (K Unit) Forecast, by Application 2019 & 2032
- Table 55: Singapore Printed Sensor Industry Revenue (Million) Forecast, by Application 2019 & 2032
- Table 56: Singapore Printed Sensor Industry Volume (K Unit) Forecast, by Application 2019 & 2032
- Table 57: Thailandc Printed Sensor Industry Revenue (Million) Forecast, by Application 2019 & 2032
- Table 58: Thailandc Printed Sensor Industry Volume (K Unit) Forecast, by Application 2019 & 2032
- Table 59: Rest of Asia Pacific Printed Sensor Industry Revenue (Million) Forecast, by Application 2019 & 2032
- Table 60: Rest of Asia Pacific Printed Sensor Industry Volume (K Unit) Forecast, by Application 2019 & 2032
- Table 61: Global Printed Sensor Industry Revenue Million Forecast, by Country 2019 & 2032
- Table 62: Global Printed Sensor Industry Volume K Unit Forecast, by Country 2019 & 2032
- Table 63: Brazil Printed Sensor Industry Revenue (Million) Forecast, by Application 2019 & 2032
- Table 64: Brazil Printed Sensor Industry Volume (K Unit) Forecast, by Application 2019 & 2032
- Table 65: Argentina Printed Sensor Industry Revenue (Million) Forecast, by Application 2019 & 2032
- Table 66: Argentina Printed Sensor Industry Volume (K Unit) Forecast, by Application 2019 & 2032
- Table 67: Peru Printed Sensor Industry Revenue (Million) Forecast, by Application 2019 & 2032
- Table 68: Peru Printed Sensor Industry Volume (K Unit) Forecast, by Application 2019 & 2032
- Table 69: Chile Printed Sensor Industry Revenue (Million) Forecast, by Application 2019 & 2032
- Table 70: Chile Printed Sensor Industry Volume (K Unit) Forecast, by Application 2019 & 2032
- Table 71: Colombia Printed Sensor Industry Revenue (Million) Forecast, by Application 2019 & 2032
- Table 72: Colombia Printed Sensor Industry Volume (K Unit) Forecast, by Application 2019 & 2032
- Table 73: Ecuador Printed Sensor Industry Revenue (Million) Forecast, by Application 2019 & 2032
- Table 74: Ecuador Printed Sensor Industry Volume (K Unit) Forecast, by Application 2019 & 2032
- Table 75: Venezuela Printed Sensor Industry Revenue (Million) Forecast, by Application 2019 & 2032
- Table 76: Venezuela Printed Sensor Industry Volume (K Unit) Forecast, by Application 2019 & 2032
- Table 77: Rest of South America Printed Sensor Industry Revenue (Million) Forecast, by Application 2019 & 2032
- Table 78: Rest of South America Printed Sensor Industry Volume (K Unit) Forecast, by Application 2019 & 2032
- Table 79: Global Printed Sensor Industry Revenue Million Forecast, by Country 2019 & 2032
- Table 80: Global Printed Sensor Industry Volume K Unit Forecast, by Country 2019 & 2032
- Table 81: United States Printed Sensor Industry Revenue (Million) Forecast, by Application 2019 & 2032
- Table 82: United States Printed Sensor Industry Volume (K Unit) Forecast, by Application 2019 & 2032
- Table 83: Canada Printed Sensor Industry Revenue (Million) Forecast, by Application 2019 & 2032
- Table 84: Canada Printed Sensor Industry Volume (K Unit) Forecast, by Application 2019 & 2032
- Table 85: Mexico Printed Sensor Industry Revenue (Million) Forecast, by Application 2019 & 2032
- Table 86: Mexico Printed Sensor Industry Volume (K Unit) Forecast, by Application 2019 & 2032
- Table 87: Global Printed Sensor Industry Revenue Million Forecast, by Country 2019 & 2032
- Table 88: Global Printed Sensor Industry Volume K Unit Forecast, by Country 2019 & 2032
- Table 89: United Arab Emirates Printed Sensor Industry Revenue (Million) Forecast, by Application 2019 & 2032
- Table 90: United Arab Emirates Printed Sensor Industry Volume (K Unit) Forecast, by Application 2019 & 2032
- Table 91: Saudi Arabia Printed Sensor Industry Revenue (Million) Forecast, by Application 2019 & 2032
- Table 92: Saudi Arabia Printed Sensor Industry Volume (K Unit) Forecast, by Application 2019 & 2032
- Table 93: South Africa Printed Sensor Industry Revenue (Million) Forecast, by Application 2019 & 2032
- Table 94: South Africa Printed Sensor Industry Volume (K Unit) Forecast, by Application 2019 & 2032
- Table 95: Rest of Middle East and Africa Printed Sensor Industry Revenue (Million) Forecast, by Application 2019 & 2032
- Table 96: Rest of Middle East and Africa Printed Sensor Industry Volume (K Unit) Forecast, by Application 2019 & 2032
- Table 97: Global Printed Sensor Industry Revenue Million Forecast, by End-User Industry 2019 & 2032
- Table 98: Global Printed Sensor Industry Volume K Unit Forecast, by End-User Industry 2019 & 2032
- Table 99: Global Printed Sensor Industry Revenue Million Forecast, by Country 2019 & 2032
- Table 100: Global Printed Sensor Industry Volume K Unit Forecast, by Country 2019 & 2032
- Table 101: Global Printed Sensor Industry Revenue Million Forecast, by End-User Industry 2019 & 2032
- Table 102: Global Printed Sensor Industry Volume K Unit Forecast, by End-User Industry 2019 & 2032
- Table 103: Global Printed Sensor Industry Revenue Million Forecast, by Country 2019 & 2032
- Table 104: Global Printed Sensor Industry Volume K Unit Forecast, by Country 2019 & 2032
- Table 105: Global Printed Sensor Industry Revenue Million Forecast, by End-User Industry 2019 & 2032
- Table 106: Global Printed Sensor Industry Volume K Unit Forecast, by End-User Industry 2019 & 2032
- Table 107: Global Printed Sensor Industry Revenue Million Forecast, by Country 2019 & 2032
- Table 108: Global Printed Sensor Industry Volume K Unit Forecast, by Country 2019 & 2032
- Table 109: Global Printed Sensor Industry Revenue Million Forecast, by End-User Industry 2019 & 2032
- Table 110: Global Printed Sensor Industry Volume K Unit Forecast, by End-User Industry 2019 & 2032
- Table 111: Global Printed Sensor Industry Revenue Million Forecast, by Country 2019 & 2032
- Table 112: Global Printed Sensor Industry Volume K Unit Forecast, by Country 2019 & 2032
Frequently Asked Questions
1. What is the projected Compound Annual Growth Rate (CAGR) of the Printed Sensor Industry?
The projected CAGR is approximately 6.62%.
2. Which companies are prominent players in the Printed Sensor Industry?
Key companies in the market include Pressure Profile Systems Inc, Butler Technologies Inc, Peratech Holdco Limited, Tekscan Inc, T+Ink Inc (IDTechEx Ltd ), Renesas Electronics Corporation, KWJ Engineering inc (SPEC Sensors LLC), FlexEnable Limited, Thin Film Electronics ASA, Plastic Logic HK Ltd, Canatu Oy, ISORG SA.
3. What are the main segments of the Printed Sensor Industry?
The market segments include End-User Industry.
4. Can you provide details about the market size?
The market size is estimated to be USD XX Million as of 2022.
5. What are some drivers contributing to market growth?
; Use of Integrated Dashboards in Advanced Driver Assistance System (ADAS) in Automotive Sector; Increasing Usage of CMOS Sensors in Consumer Electronics Products.
6. What are the notable trends driving market growth?
Consumer Electronics is Expected to Hold Major Market Share.
7. Are there any restraints impacting market growth?
; Complex Manufacturing Process.
8. Can you provide examples of recent developments in the market?
N/A
9. What pricing options are available for accessing the report?
Pricing options include single-user, multi-user, and enterprise licenses priced at USD 4750, USD 5250, and USD 8750 respectively.
10. Is the market size provided in terms of value or volume?
The market size is provided in terms of value, measured in Million and volume, measured in K Unit.
11. Are there any specific market keywords associated with the report?
Yes, the market keyword associated with the report is "Printed Sensor Industry," which aids in identifying and referencing the specific market segment covered.
12. How do I determine which pricing option suits my needs best?
The pricing options vary based on user requirements and access needs. Individual users may opt for single-user licenses, while businesses requiring broader access may choose multi-user or enterprise licenses for cost-effective access to the report.
13. Are there any additional resources or data provided in the Printed Sensor Industry report?
While the report offers comprehensive insights, it's advisable to review the specific contents or supplementary materials provided to ascertain if additional resources or data are available.
14. How can I stay updated on further developments or reports in the Printed Sensor Industry?
To stay informed about further developments, trends, and reports in the Printed Sensor Industry, consider subscribing to industry newsletters, following relevant companies and organizations, or regularly checking reputable industry news sources and publications.
Methodology
Step 1 - Identification of Relevant Samples Size from Population Database


Step 2 - Approaches for Defining Global Market Size (Value, Volume* & Price*)

Note*: In applicable scenarios
Step 3 - Data Sources
Primary Research
- Web Analytics
- Survey Reports
- Research Institute
- Latest Research Reports
- Opinion Leaders
Secondary Research
- Annual Reports
- White Paper
- Latest Press Release
- Industry Association
- Paid Database
- Investor Presentations

Step 4 - Data Triangulation
Involves using different sources of information in order to increase the validity of a study
These sources are likely to be stakeholders in a program - participants, other researchers, program staff, other community members, and so on.
Then we put all data in single framework & apply various statistical tools to find out the dynamic on the market.
During the analysis stage, feedback from the stakeholder groups would be compared to determine areas of agreement as well as areas of divergence


