
Key Insights
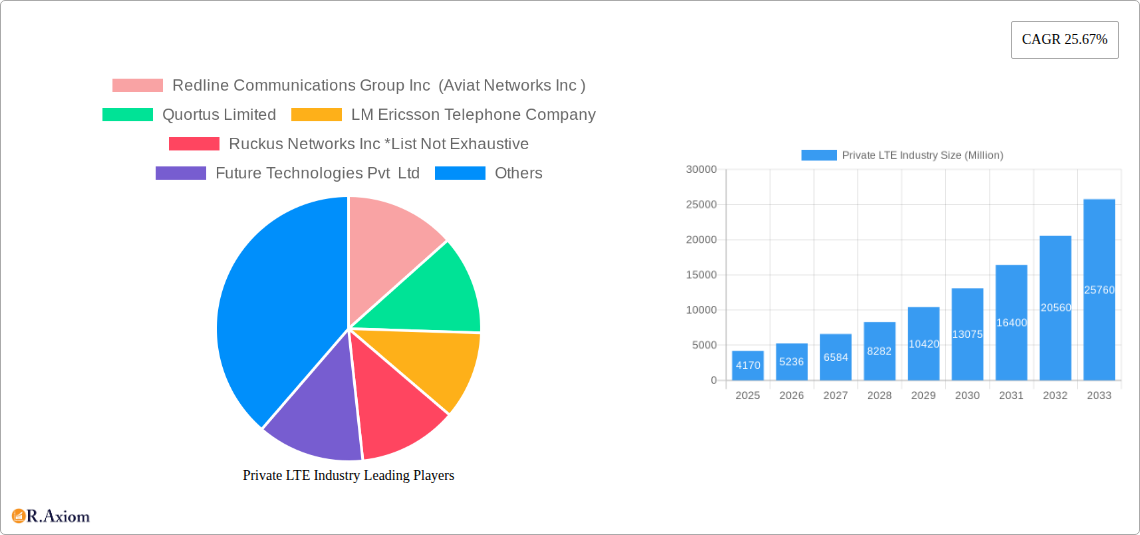
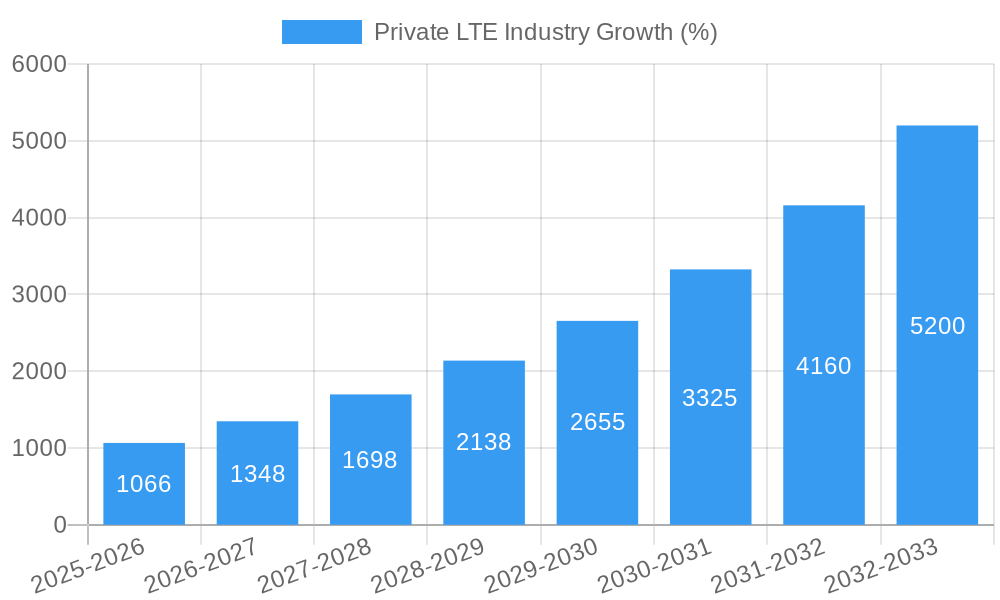
The Private LTE market is experiencing robust growth, projected to reach $4.17 billion in 2025 and exhibiting a remarkable Compound Annual Growth Rate (CAGR) of 25.67% from 2025 to 2033. This expansion is fueled by several key drivers. The increasing demand for reliable, high-bandwidth, and secure communication networks across diverse sectors like industrial automation (particularly in public safety, supply chain management, utilities, and manufacturing), healthcare, and enterprises is a primary catalyst. Furthermore, the rising adoption of Industry 4.0 initiatives and the need for improved operational efficiency are pushing organizations towards private LTE solutions. The availability of both licensed and unlicensed spectrum, along with advancements in technologies like Frequency-Division Duplexing (FDD) and Time-Division Duplex (TDD), further contribute to market expansion. Different deployment models, including centralized and distributed networks, cater to varied operational needs and infrastructure capabilities, enhancing the market's adaptability.
Despite the positive trajectory, certain challenges persist. High initial infrastructure investment costs can act as a restraint, particularly for smaller enterprises. The complexity of integrating private LTE networks with existing communication systems also poses a hurdle. However, the long-term benefits in terms of enhanced security, improved productivity, and reduced operational costs outweigh these initial challenges. The market is expected to see further segmentation based on evolving technological advancements and specific industry requirements, with significant growth expected in regions like Asia-Pacific, driven by rapid industrialization and digital transformation efforts. Key players like Ericsson, Nokia, and Huawei are strategically positioning themselves to capitalize on this expanding market, fostering innovation and competition.
Private LTE Industry Market Report: 2019-2033
This comprehensive report provides an in-depth analysis of the Private LTE industry, offering crucial insights for stakeholders seeking to navigate this rapidly evolving market. With a study period spanning 2019-2033, a base year of 2025, and a forecast period of 2025-2033, this report delivers actionable intelligence based on rigorous data analysis and expert insights. The global Private LTE market is projected to reach xx Million by 2033, exhibiting a robust Compound Annual Growth Rate (CAGR) of xx% during the forecast period.
Private LTE Industry Market Concentration & Innovation
The Private LTE market exhibits a moderately concentrated landscape, with key players such as Ericsson, Nokia, Huawei, and Qualcomm holding significant market share. However, the emergence of numerous smaller, specialized vendors is increasing competition and fostering innovation. Market share estimations for 2025 suggest Ericsson holds approximately xx% of the market, followed by Nokia at xx%, Huawei at xx%, and Qualcomm at xx%. The remaining share is distributed among other players, reflecting a dynamic and competitive environment.
Several factors drive innovation within the industry:
- Technological advancements: Continuous improvements in LTE technology, including advancements in spectrum efficiency and device capabilities, are key drivers.
- Regulatory landscape: Government initiatives promoting the adoption of private LTE networks, especially in critical infrastructure sectors, are boosting innovation.
- Demand for secure connectivity: The need for secure, reliable communication in various industries fuels the development of enhanced security features and solutions.
- Mergers and Acquisitions (M&A): Strategic acquisitions, such as the Vocus acquisition of Challenge Networks in February 2023 (USD 1 Billion), demonstrate industry consolidation and the integration of complementary technologies. The total value of M&A deals in the Private LTE sector during the historical period (2019-2024) reached an estimated xx Million.
The increasing adoption of private LTE networks across diverse industries, coupled with technological advancements, drives significant innovation in the sector.
Private LTE Industry Industry Trends & Insights
The Private LTE market is experiencing substantial growth, fueled by several key trends:
- Increasing demand from various sectors: Industries like manufacturing, healthcare, and public safety are increasingly adopting private LTE networks for enhanced connectivity and operational efficiency. Market penetration in the manufacturing sector is projected to reach xx% by 2033.
- Technological advancements in 5G: The convergence of LTE and 5G technologies offers enhanced capabilities, including higher bandwidths and lower latency, pushing market expansion.
- Growing preference for secure and reliable communication: Businesses prioritize secure and reliable communication to protect sensitive data and maintain operational continuity, thereby fueling private LTE adoption.
- Intense competition: The presence of numerous vendors intensifies competitive pressure, driving innovation and price optimization. The market is expected to grow at a CAGR of xx% from 2025 to 2033.
The evolution of private LTE networks from niche solutions to mainstream technology, combined with increased awareness of their benefits across diverse industries, underpins the market's substantial growth trajectory.
Dominant Markets & Segments in Private LTE Industry
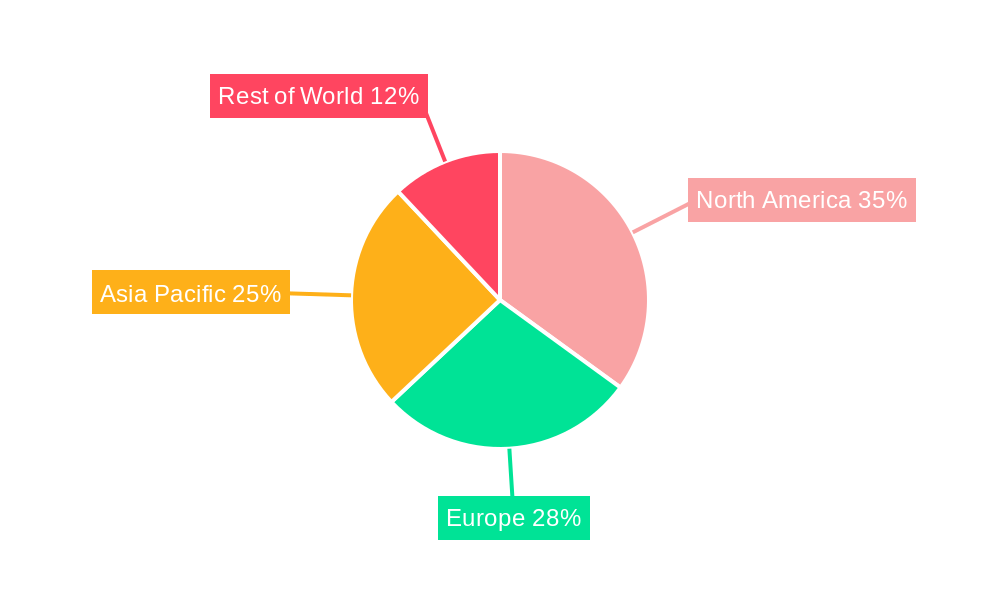
The Private LTE market is geographically diverse, with significant growth observed across multiple regions. However, North America currently holds the dominant market position, driven by robust technological infrastructure, increased investments, and early adoption. Within the segments:
- By End-user Industry: The Industrial sector (Public Safety, Supply Chain Management, Utilities, Manufacturing) is currently the largest, with the manufacturing sub-segment demonstrating the highest growth. Healthcare and Enterprise segments also contribute significantly.
- By Component: The Infrastructure segment commands a larger share due to the capital expenditure needed for network deployments. However, the Services segment is experiencing higher growth due to the increasing demand for managed services.
- By Technology: FDD and TDD technologies are witnessing similar growth, with the choice influenced by specific deployment requirements.
- By Deployment: Centralized deployments are currently more prevalent, but distributed deployments are rapidly gaining traction, particularly for large-scale applications.
- By Frequency Band: Licensed bands currently dominate, but the adoption of unlicensed and shared spectrum is expected to increase, driven by cost efficiency and increased availability.
Key drivers influencing dominance include robust government support in North America, substantial investment in infrastructure, and a highly developed technological landscape.
Private LTE Industry Product Developments
Recent product developments focus on enhancing network security, improving spectrum efficiency, and integrating functionalities with other technologies, such as IoT devices. Integration of AI and machine learning for network optimization and predictive maintenance is emerging as a major area of innovation. The market is witnessing a shift towards software-defined networks and cloud-based management platforms, facilitating scalable and cost-effective deployments. These developments cater to the growing demand for reliable, secure, and easily manageable private LTE networks across diverse industries.
Report Scope & Segmentation Analysis
This report segments the Private LTE market comprehensively across various parameters:
- By End-user Industry: Industrial (Public Safety, Supply Chain Management, Utilities, Manufacturing), Healthcare, Enterprise, Other. Each segment presents unique growth projections and competitive dynamics.
- By Component: Infrastructure (hardware, software) and Services (installation, maintenance, support). Infrastructure dominates the market size, but Services exhibit higher growth.
- By Technology: Frequency-Division Duplexing (FDD) and Time Division Duplex (TDD). Both technologies are expected to witness considerable growth.
- By Deployment: Centralized and Distributed. Distributed deployment is gaining traction, driving market growth.
- By Frequency Band: Licensed, Unlicensed, and Shared Spectrum. Licensed bands currently dominate, but the use of unlicensed and shared spectrum is rapidly expanding.
Each segment's growth trajectory reflects specific market trends, technological advancements, and competitive landscapes.
Key Drivers of Private LTE Industry Growth
Several factors propel the growth of the Private LTE industry:
- Increased demand for secure and reliable communication: Industries require highly reliable and secure communication networks, which are effectively provided by Private LTE.
- Technological advancements: Ongoing advancements in LTE and 5G technologies offer improved bandwidth, lower latency, and enhanced capabilities.
- Government support and regulatory frameworks: Policies supporting the adoption of Private LTE networks in key sectors (e.g., public safety) drive market expansion.
- Cost-effectiveness: Private LTE networks can provide cost savings compared to traditional communication solutions, particularly for large-scale deployments.
These factors combine to accelerate the adoption of Private LTE across multiple sectors.
Challenges in the Private LTE Industry Sector
The Private LTE sector faces several challenges:
- High initial investment costs: Setting up a Private LTE network demands considerable upfront investment, especially for infrastructure development.
- Spectrum availability and licensing: The availability and cost of appropriate spectrum licenses can be a hurdle.
- Competition from other technologies: Alternative communication technologies compete for market share, creating competitive pressure.
- Integration complexities: Integrating private LTE networks with existing IT infrastructure can present complexity.
These challenges must be addressed for sustained market growth.
Emerging Opportunities in Private LTE Industry
The Private LTE market presents several exciting opportunities:
- Expansion into new industries: Private LTE adoption is expanding across various sectors, creating new market avenues.
- Integration with IoT devices: Linking Private LTE networks with IoT devices offers opportunities for various applications.
- Development of advanced network management tools: Advanced tools and platforms enhance network efficiency and performance.
- Growth of the service segment: The demand for managed services is increasing, providing growth potential for service providers.
These opportunities are key drivers for market growth and expansion.
Leading Players in the Private LTE Industry Market
- Redline Communications Group Inc (Aviat Networks Inc)
- Quortus Limited
- LM Ericsson Telephone Company
- Ruckus Networks Inc
- Future Technologies Pvt Ltd
- Qualcomm Technologies Inc
- NEC Corporation
- Huawei Technologies Co Ltd
- Nokia Corporation
- Sierra Wireless Inc
- Luminate Wireless Inc
Key Developments in Private LTE Industry Industry
- February 2023: Vocus' acquisition of Challenge Networks expands its services to include wireless capabilities, signifying a significant investment (USD 1 Billion) in the Australian telecommunications market and highlighting the strategic importance of integrating wireless technologies with existing fiber infrastructure.
- May 2022: The partnership between NTT Ltd. and Albemarle Corporation demonstrates the growing adoption of Private LTE/5G networks in the mining sector for enhanced remote operations and collaboration. This underscores the need for reliable and secure connectivity in remote and geographically dispersed environments.
Strategic Outlook for Private LTE Industry Market
The Private LTE industry is poised for continued growth, driven by technological advancements, expanding industry adoption, and increased government support. The focus on enhancing security, expanding into new applications like IoT integration, and the development of efficient management tools will shape future market dynamics. The market presents significant opportunities for both established players and new entrants, creating a dynamic and competitive landscape with promising growth potential.
Private LTE Industry Segmentation
-
1. Component
- 1.1. Infrastructure
- 1.2. Services
-
2. Technology
- 2.1. Frequency-Division Duplexing (FDD)
- 2.2. Time Division Duplex (TDD)
-
3. Deployment
- 3.1. Centralized
- 3.2. Distributed
-
4. Frequency Band
- 4.1. Licensed
- 4.2. Unlicensed
- 4.3. Shared Spectrum
-
5. End-user Industry
- 5.1. Industri
- 5.2. Healthcare
- 5.3. Enterprise
- 5.4. Other End-user Industries
Private LTE Industry Segmentation By Geography
-
1. North America
- 1.1. United States
- 1.2. Canada
-
2. Europe
- 2.1. Germany
- 2.2. United Kingdom
- 2.3. France
- 2.4. Rest of Europe
-
3. Asia Pacific
- 3.1. China
- 3.2. Japan
- 3.3. India
- 3.4. Rest of Asia Pacific
- 4. Rest of the world
Private LTE Industry REPORT HIGHLIGHTS
| Aspects | Details |
|---|---|
| Study Period | 2019-2033 |
| Base Year | 2024 |
| Estimated Year | 2025 |
| Forecast Period | 2025-2033 |
| Historical Period | 2019-2024 |
| Growth Rate | CAGR of 25.67% from 2019-2033 |
| Segmentation |
|
Table of Contents
- 1. Introduction
- 1.1. Research Scope
- 1.2. Market Segmentation
- 1.3. Research Methodology
- 1.4. Definitions and Assumptions
- 2. Executive Summary
- 2.1. Introduction
- 3. Market Dynamics
- 3.1. Introduction
- 3.2. Market Drivers
- 3.2.1. Increasing Adoption of Isolated Systems; Growing Adoption of Smartphones
- 3.3. Market Restrains
- 3.3.1. Dearth of Skillful Workforce to Add New Solutions in Existing Network
- 3.4. Market Trends
- 3.4.1. Growing Adoption of Smartphones may Drive the Market Growth
- 4. Market Factor Analysis
- 4.1. Porters Five Forces
- 4.2. Supply/Value Chain
- 4.3. PESTEL analysis
- 4.4. Market Entropy
- 4.5. Patent/Trademark Analysis
- 5. Global Private LTE Industry Analysis, Insights and Forecast, 2019-2031
- 5.1. Market Analysis, Insights and Forecast - by Component
- 5.1.1. Infrastructure
- 5.1.2. Services
- 5.2. Market Analysis, Insights and Forecast - by Technology
- 5.2.1. Frequency-Division Duplexing (FDD)
- 5.2.2. Time Division Duplex (TDD)
- 5.3. Market Analysis, Insights and Forecast - by Deployment
- 5.3.1. Centralized
- 5.3.2. Distributed
- 5.4. Market Analysis, Insights and Forecast - by Frequency Band
- 5.4.1. Licensed
- 5.4.2. Unlicensed
- 5.4.3. Shared Spectrum
- 5.5. Market Analysis, Insights and Forecast - by End-user Industry
- 5.5.1. Industri
- 5.5.2. Healthcare
- 5.5.3. Enterprise
- 5.5.4. Other End-user Industries
- 5.6. Market Analysis, Insights and Forecast - by Region
- 5.6.1. North America
- 5.6.2. Europe
- 5.6.3. Asia Pacific
- 5.6.4. Rest of the world
- 5.1. Market Analysis, Insights and Forecast - by Component
- 6. North America Private LTE Industry Analysis, Insights and Forecast, 2019-2031
- 6.1. Market Analysis, Insights and Forecast - by Component
- 6.1.1. Infrastructure
- 6.1.2. Services
- 6.2. Market Analysis, Insights and Forecast - by Technology
- 6.2.1. Frequency-Division Duplexing (FDD)
- 6.2.2. Time Division Duplex (TDD)
- 6.3. Market Analysis, Insights and Forecast - by Deployment
- 6.3.1. Centralized
- 6.3.2. Distributed
- 6.4. Market Analysis, Insights and Forecast - by Frequency Band
- 6.4.1. Licensed
- 6.4.2. Unlicensed
- 6.4.3. Shared Spectrum
- 6.5. Market Analysis, Insights and Forecast - by End-user Industry
- 6.5.1. Industri
- 6.5.2. Healthcare
- 6.5.3. Enterprise
- 6.5.4. Other End-user Industries
- 6.1. Market Analysis, Insights and Forecast - by Component
- 7. Europe Private LTE Industry Analysis, Insights and Forecast, 2019-2031
- 7.1. Market Analysis, Insights and Forecast - by Component
- 7.1.1. Infrastructure
- 7.1.2. Services
- 7.2. Market Analysis, Insights and Forecast - by Technology
- 7.2.1. Frequency-Division Duplexing (FDD)
- 7.2.2. Time Division Duplex (TDD)
- 7.3. Market Analysis, Insights and Forecast - by Deployment
- 7.3.1. Centralized
- 7.3.2. Distributed
- 7.4. Market Analysis, Insights and Forecast - by Frequency Band
- 7.4.1. Licensed
- 7.4.2. Unlicensed
- 7.4.3. Shared Spectrum
- 7.5. Market Analysis, Insights and Forecast - by End-user Industry
- 7.5.1. Industri
- 7.5.2. Healthcare
- 7.5.3. Enterprise
- 7.5.4. Other End-user Industries
- 7.1. Market Analysis, Insights and Forecast - by Component
- 8. Asia Pacific Private LTE Industry Analysis, Insights and Forecast, 2019-2031
- 8.1. Market Analysis, Insights and Forecast - by Component
- 8.1.1. Infrastructure
- 8.1.2. Services
- 8.2. Market Analysis, Insights and Forecast - by Technology
- 8.2.1. Frequency-Division Duplexing (FDD)
- 8.2.2. Time Division Duplex (TDD)
- 8.3. Market Analysis, Insights and Forecast - by Deployment
- 8.3.1. Centralized
- 8.3.2. Distributed
- 8.4. Market Analysis, Insights and Forecast - by Frequency Band
- 8.4.1. Licensed
- 8.4.2. Unlicensed
- 8.4.3. Shared Spectrum
- 8.5. Market Analysis, Insights and Forecast - by End-user Industry
- 8.5.1. Industri
- 8.5.2. Healthcare
- 8.5.3. Enterprise
- 8.5.4. Other End-user Industries
- 8.1. Market Analysis, Insights and Forecast - by Component
- 9. Rest of the world Private LTE Industry Analysis, Insights and Forecast, 2019-2031
- 9.1. Market Analysis, Insights and Forecast - by Component
- 9.1.1. Infrastructure
- 9.1.2. Services
- 9.2. Market Analysis, Insights and Forecast - by Technology
- 9.2.1. Frequency-Division Duplexing (FDD)
- 9.2.2. Time Division Duplex (TDD)
- 9.3. Market Analysis, Insights and Forecast - by Deployment
- 9.3.1. Centralized
- 9.3.2. Distributed
- 9.4. Market Analysis, Insights and Forecast - by Frequency Band
- 9.4.1. Licensed
- 9.4.2. Unlicensed
- 9.4.3. Shared Spectrum
- 9.5. Market Analysis, Insights and Forecast - by End-user Industry
- 9.5.1. Industri
- 9.5.2. Healthcare
- 9.5.3. Enterprise
- 9.5.4. Other End-user Industries
- 9.1. Market Analysis, Insights and Forecast - by Component
- 10. North America Private LTE Industry Analysis, Insights and Forecast, 2019-2031
- 10.1. Market Analysis, Insights and Forecast - By Country/Sub-region
- 10.1.1 United States
- 10.1.2 Canada
- 11. Europe Private LTE Industry Analysis, Insights and Forecast, 2019-2031
- 11.1. Market Analysis, Insights and Forecast - By Country/Sub-region
- 11.1.1 Germany
- 11.1.2 United Kingdom
- 11.1.3 France
- 11.1.4 Rest of Europe
- 12. Asia Pacific Private LTE Industry Analysis, Insights and Forecast, 2019-2031
- 12.1. Market Analysis, Insights and Forecast - By Country/Sub-region
- 12.1.1 China
- 12.1.2 Japan
- 12.1.3 India
- 12.1.4 Rest of Asia Pacific
- 13. Rest of the world Private LTE Industry Analysis, Insights and Forecast, 2019-2031
- 13.1. Market Analysis, Insights and Forecast - By Country/Sub-region
- 13.1.1.
- 14. Competitive Analysis
- 14.1. Global Market Share Analysis 2024
- 14.2. Company Profiles
- 14.2.1 Redline Communications Group Inc (Aviat Networks Inc )
- 14.2.1.1. Overview
- 14.2.1.2. Products
- 14.2.1.3. SWOT Analysis
- 14.2.1.4. Recent Developments
- 14.2.1.5. Financials (Based on Availability)
- 14.2.2 Quortus Limited
- 14.2.2.1. Overview
- 14.2.2.2. Products
- 14.2.2.3. SWOT Analysis
- 14.2.2.4. Recent Developments
- 14.2.2.5. Financials (Based on Availability)
- 14.2.3 LM Ericsson Telephone Company
- 14.2.3.1. Overview
- 14.2.3.2. Products
- 14.2.3.3. SWOT Analysis
- 14.2.3.4. Recent Developments
- 14.2.3.5. Financials (Based on Availability)
- 14.2.4 Ruckus Networks Inc *List Not Exhaustive
- 14.2.4.1. Overview
- 14.2.4.2. Products
- 14.2.4.3. SWOT Analysis
- 14.2.4.4. Recent Developments
- 14.2.4.5. Financials (Based on Availability)
- 14.2.5 Future Technologies Pvt Ltd
- 14.2.5.1. Overview
- 14.2.5.2. Products
- 14.2.5.3. SWOT Analysis
- 14.2.5.4. Recent Developments
- 14.2.5.5. Financials (Based on Availability)
- 14.2.6 Qualcomm Technologies Inc
- 14.2.6.1. Overview
- 14.2.6.2. Products
- 14.2.6.3. SWOT Analysis
- 14.2.6.4. Recent Developments
- 14.2.6.5. Financials (Based on Availability)
- 14.2.7 NEC Corporation
- 14.2.7.1. Overview
- 14.2.7.2. Products
- 14.2.7.3. SWOT Analysis
- 14.2.7.4. Recent Developments
- 14.2.7.5. Financials (Based on Availability)
- 14.2.8 Huawei Technologies Co Ltd
- 14.2.8.1. Overview
- 14.2.8.2. Products
- 14.2.8.3. SWOT Analysis
- 14.2.8.4. Recent Developments
- 14.2.8.5. Financials (Based on Availability)
- 14.2.9 Nokia Corporation
- 14.2.9.1. Overview
- 14.2.9.2. Products
- 14.2.9.3. SWOT Analysis
- 14.2.9.4. Recent Developments
- 14.2.9.5. Financials (Based on Availability)
- 14.2.10 Sierra Wireless Inc
- 14.2.10.1. Overview
- 14.2.10.2. Products
- 14.2.10.3. SWOT Analysis
- 14.2.10.4. Recent Developments
- 14.2.10.5. Financials (Based on Availability)
- 14.2.11 Luminate Wireless Inc
- 14.2.11.1. Overview
- 14.2.11.2. Products
- 14.2.11.3. SWOT Analysis
- 14.2.11.4. Recent Developments
- 14.2.11.5. Financials (Based on Availability)
- 14.2.1 Redline Communications Group Inc (Aviat Networks Inc )
List of Figures
- Figure 1: Global Private LTE Industry Revenue Breakdown (Million, %) by Region 2024 & 2032
- Figure 2: North America Private LTE Industry Revenue (Million), by Country 2024 & 2032
- Figure 3: North America Private LTE Industry Revenue Share (%), by Country 2024 & 2032
- Figure 4: Europe Private LTE Industry Revenue (Million), by Country 2024 & 2032
- Figure 5: Europe Private LTE Industry Revenue Share (%), by Country 2024 & 2032
- Figure 6: Asia Pacific Private LTE Industry Revenue (Million), by Country 2024 & 2032
- Figure 7: Asia Pacific Private LTE Industry Revenue Share (%), by Country 2024 & 2032
- Figure 8: Rest of the world Private LTE Industry Revenue (Million), by Country 2024 & 2032
- Figure 9: Rest of the world Private LTE Industry Revenue Share (%), by Country 2024 & 2032
- Figure 10: North America Private LTE Industry Revenue (Million), by Component 2024 & 2032
- Figure 11: North America Private LTE Industry Revenue Share (%), by Component 2024 & 2032
- Figure 12: North America Private LTE Industry Revenue (Million), by Technology 2024 & 2032
- Figure 13: North America Private LTE Industry Revenue Share (%), by Technology 2024 & 2032
- Figure 14: North America Private LTE Industry Revenue (Million), by Deployment 2024 & 2032
- Figure 15: North America Private LTE Industry Revenue Share (%), by Deployment 2024 & 2032
- Figure 16: North America Private LTE Industry Revenue (Million), by Frequency Band 2024 & 2032
- Figure 17: North America Private LTE Industry Revenue Share (%), by Frequency Band 2024 & 2032
- Figure 18: North America Private LTE Industry Revenue (Million), by End-user Industry 2024 & 2032
- Figure 19: North America Private LTE Industry Revenue Share (%), by End-user Industry 2024 & 2032
- Figure 20: North America Private LTE Industry Revenue (Million), by Country 2024 & 2032
- Figure 21: North America Private LTE Industry Revenue Share (%), by Country 2024 & 2032
- Figure 22: Europe Private LTE Industry Revenue (Million), by Component 2024 & 2032
- Figure 23: Europe Private LTE Industry Revenue Share (%), by Component 2024 & 2032
- Figure 24: Europe Private LTE Industry Revenue (Million), by Technology 2024 & 2032
- Figure 25: Europe Private LTE Industry Revenue Share (%), by Technology 2024 & 2032
- Figure 26: Europe Private LTE Industry Revenue (Million), by Deployment 2024 & 2032
- Figure 27: Europe Private LTE Industry Revenue Share (%), by Deployment 2024 & 2032
- Figure 28: Europe Private LTE Industry Revenue (Million), by Frequency Band 2024 & 2032
- Figure 29: Europe Private LTE Industry Revenue Share (%), by Frequency Band 2024 & 2032
- Figure 30: Europe Private LTE Industry Revenue (Million), by End-user Industry 2024 & 2032
- Figure 31: Europe Private LTE Industry Revenue Share (%), by End-user Industry 2024 & 2032
- Figure 32: Europe Private LTE Industry Revenue (Million), by Country 2024 & 2032
- Figure 33: Europe Private LTE Industry Revenue Share (%), by Country 2024 & 2032
- Figure 34: Asia Pacific Private LTE Industry Revenue (Million), by Component 2024 & 2032
- Figure 35: Asia Pacific Private LTE Industry Revenue Share (%), by Component 2024 & 2032
- Figure 36: Asia Pacific Private LTE Industry Revenue (Million), by Technology 2024 & 2032
- Figure 37: Asia Pacific Private LTE Industry Revenue Share (%), by Technology 2024 & 2032
- Figure 38: Asia Pacific Private LTE Industry Revenue (Million), by Deployment 2024 & 2032
- Figure 39: Asia Pacific Private LTE Industry Revenue Share (%), by Deployment 2024 & 2032
- Figure 40: Asia Pacific Private LTE Industry Revenue (Million), by Frequency Band 2024 & 2032
- Figure 41: Asia Pacific Private LTE Industry Revenue Share (%), by Frequency Band 2024 & 2032
- Figure 42: Asia Pacific Private LTE Industry Revenue (Million), by End-user Industry 2024 & 2032
- Figure 43: Asia Pacific Private LTE Industry Revenue Share (%), by End-user Industry 2024 & 2032
- Figure 44: Asia Pacific Private LTE Industry Revenue (Million), by Country 2024 & 2032
- Figure 45: Asia Pacific Private LTE Industry Revenue Share (%), by Country 2024 & 2032
- Figure 46: Rest of the world Private LTE Industry Revenue (Million), by Component 2024 & 2032
- Figure 47: Rest of the world Private LTE Industry Revenue Share (%), by Component 2024 & 2032
- Figure 48: Rest of the world Private LTE Industry Revenue (Million), by Technology 2024 & 2032
- Figure 49: Rest of the world Private LTE Industry Revenue Share (%), by Technology 2024 & 2032
- Figure 50: Rest of the world Private LTE Industry Revenue (Million), by Deployment 2024 & 2032
- Figure 51: Rest of the world Private LTE Industry Revenue Share (%), by Deployment 2024 & 2032
- Figure 52: Rest of the world Private LTE Industry Revenue (Million), by Frequency Band 2024 & 2032
- Figure 53: Rest of the world Private LTE Industry Revenue Share (%), by Frequency Band 2024 & 2032
- Figure 54: Rest of the world Private LTE Industry Revenue (Million), by End-user Industry 2024 & 2032
- Figure 55: Rest of the world Private LTE Industry Revenue Share (%), by End-user Industry 2024 & 2032
- Figure 56: Rest of the world Private LTE Industry Revenue (Million), by Country 2024 & 2032
- Figure 57: Rest of the world Private LTE Industry Revenue Share (%), by Country 2024 & 2032
List of Tables
- Table 1: Global Private LTE Industry Revenue Million Forecast, by Region 2019 & 2032
- Table 2: Global Private LTE Industry Revenue Million Forecast, by Component 2019 & 2032
- Table 3: Global Private LTE Industry Revenue Million Forecast, by Technology 2019 & 2032
- Table 4: Global Private LTE Industry Revenue Million Forecast, by Deployment 2019 & 2032
- Table 5: Global Private LTE Industry Revenue Million Forecast, by Frequency Band 2019 & 2032
- Table 6: Global Private LTE Industry Revenue Million Forecast, by End-user Industry 2019 & 2032
- Table 7: Global Private LTE Industry Revenue Million Forecast, by Region 2019 & 2032
- Table 8: Global Private LTE Industry Revenue Million Forecast, by Country 2019 & 2032
- Table 9: United States Private LTE Industry Revenue (Million) Forecast, by Application 2019 & 2032
- Table 10: Canada Private LTE Industry Revenue (Million) Forecast, by Application 2019 & 2032
- Table 11: Global Private LTE Industry Revenue Million Forecast, by Country 2019 & 2032
- Table 12: Germany Private LTE Industry Revenue (Million) Forecast, by Application 2019 & 2032
- Table 13: United Kingdom Private LTE Industry Revenue (Million) Forecast, by Application 2019 & 2032
- Table 14: France Private LTE Industry Revenue (Million) Forecast, by Application 2019 & 2032
- Table 15: Rest of Europe Private LTE Industry Revenue (Million) Forecast, by Application 2019 & 2032
- Table 16: Global Private LTE Industry Revenue Million Forecast, by Country 2019 & 2032
- Table 17: China Private LTE Industry Revenue (Million) Forecast, by Application 2019 & 2032
- Table 18: Japan Private LTE Industry Revenue (Million) Forecast, by Application 2019 & 2032
- Table 19: India Private LTE Industry Revenue (Million) Forecast, by Application 2019 & 2032
- Table 20: Rest of Asia Pacific Private LTE Industry Revenue (Million) Forecast, by Application 2019 & 2032
- Table 21: Global Private LTE Industry Revenue Million Forecast, by Country 2019 & 2032
- Table 22: Private LTE Industry Revenue (Million) Forecast, by Application 2019 & 2032
- Table 23: Global Private LTE Industry Revenue Million Forecast, by Component 2019 & 2032
- Table 24: Global Private LTE Industry Revenue Million Forecast, by Technology 2019 & 2032
- Table 25: Global Private LTE Industry Revenue Million Forecast, by Deployment 2019 & 2032
- Table 26: Global Private LTE Industry Revenue Million Forecast, by Frequency Band 2019 & 2032
- Table 27: Global Private LTE Industry Revenue Million Forecast, by End-user Industry 2019 & 2032
- Table 28: Global Private LTE Industry Revenue Million Forecast, by Country 2019 & 2032
- Table 29: United States Private LTE Industry Revenue (Million) Forecast, by Application 2019 & 2032
- Table 30: Canada Private LTE Industry Revenue (Million) Forecast, by Application 2019 & 2032
- Table 31: Global Private LTE Industry Revenue Million Forecast, by Component 2019 & 2032
- Table 32: Global Private LTE Industry Revenue Million Forecast, by Technology 2019 & 2032
- Table 33: Global Private LTE Industry Revenue Million Forecast, by Deployment 2019 & 2032
- Table 34: Global Private LTE Industry Revenue Million Forecast, by Frequency Band 2019 & 2032
- Table 35: Global Private LTE Industry Revenue Million Forecast, by End-user Industry 2019 & 2032
- Table 36: Global Private LTE Industry Revenue Million Forecast, by Country 2019 & 2032
- Table 37: Germany Private LTE Industry Revenue (Million) Forecast, by Application 2019 & 2032
- Table 38: United Kingdom Private LTE Industry Revenue (Million) Forecast, by Application 2019 & 2032
- Table 39: France Private LTE Industry Revenue (Million) Forecast, by Application 2019 & 2032
- Table 40: Rest of Europe Private LTE Industry Revenue (Million) Forecast, by Application 2019 & 2032
- Table 41: Global Private LTE Industry Revenue Million Forecast, by Component 2019 & 2032
- Table 42: Global Private LTE Industry Revenue Million Forecast, by Technology 2019 & 2032
- Table 43: Global Private LTE Industry Revenue Million Forecast, by Deployment 2019 & 2032
- Table 44: Global Private LTE Industry Revenue Million Forecast, by Frequency Band 2019 & 2032
- Table 45: Global Private LTE Industry Revenue Million Forecast, by End-user Industry 2019 & 2032
- Table 46: Global Private LTE Industry Revenue Million Forecast, by Country 2019 & 2032
- Table 47: China Private LTE Industry Revenue (Million) Forecast, by Application 2019 & 2032
- Table 48: Japan Private LTE Industry Revenue (Million) Forecast, by Application 2019 & 2032
- Table 49: India Private LTE Industry Revenue (Million) Forecast, by Application 2019 & 2032
- Table 50: Rest of Asia Pacific Private LTE Industry Revenue (Million) Forecast, by Application 2019 & 2032
- Table 51: Global Private LTE Industry Revenue Million Forecast, by Component 2019 & 2032
- Table 52: Global Private LTE Industry Revenue Million Forecast, by Technology 2019 & 2032
- Table 53: Global Private LTE Industry Revenue Million Forecast, by Deployment 2019 & 2032
- Table 54: Global Private LTE Industry Revenue Million Forecast, by Frequency Band 2019 & 2032
- Table 55: Global Private LTE Industry Revenue Million Forecast, by End-user Industry 2019 & 2032
- Table 56: Global Private LTE Industry Revenue Million Forecast, by Country 2019 & 2032
Frequently Asked Questions
1. What is the projected Compound Annual Growth Rate (CAGR) of the Private LTE Industry?
The projected CAGR is approximately 25.67%.
2. Which companies are prominent players in the Private LTE Industry?
Key companies in the market include Redline Communications Group Inc (Aviat Networks Inc ), Quortus Limited, LM Ericsson Telephone Company, Ruckus Networks Inc *List Not Exhaustive, Future Technologies Pvt Ltd, Qualcomm Technologies Inc, NEC Corporation, Huawei Technologies Co Ltd, Nokia Corporation, Sierra Wireless Inc, Luminate Wireless Inc.
3. What are the main segments of the Private LTE Industry?
The market segments include Component, Technology, Deployment, Frequency Band, End-user Industry.
4. Can you provide details about the market size?
The market size is estimated to be USD 4.17 Million as of 2022.
5. What are some drivers contributing to market growth?
Increasing Adoption of Isolated Systems; Growing Adoption of Smartphones.
6. What are the notable trends driving market growth?
Growing Adoption of Smartphones may Drive the Market Growth.
7. Are there any restraints impacting market growth?
Dearth of Skillful Workforce to Add New Solutions in Existing Network.
8. Can you provide examples of recent developments in the market?
February 2023: Vocus, a fiber and network solutions provider, signed to acquire Challenge Networks, an Australian provider of telecommunications services. The addition of wireless network capability completes Vocus' USD 1 billion investment strategy, which also includes the deployment of significant new fiber infrastructure, including the Horizon and Highclere projects in the northwest of Australia, as well as capacity upgrades to the company's current network.
9. What pricing options are available for accessing the report?
Pricing options include single-user, multi-user, and enterprise licenses priced at USD 4750, USD 5250, and USD 8750 respectively.
10. Is the market size provided in terms of value or volume?
The market size is provided in terms of value, measured in Million.
11. Are there any specific market keywords associated with the report?
Yes, the market keyword associated with the report is "Private LTE Industry," which aids in identifying and referencing the specific market segment covered.
12. How do I determine which pricing option suits my needs best?
The pricing options vary based on user requirements and access needs. Individual users may opt for single-user licenses, while businesses requiring broader access may choose multi-user or enterprise licenses for cost-effective access to the report.
13. Are there any additional resources or data provided in the Private LTE Industry report?
While the report offers comprehensive insights, it's advisable to review the specific contents or supplementary materials provided to ascertain if additional resources or data are available.
14. How can I stay updated on further developments or reports in the Private LTE Industry?
To stay informed about further developments, trends, and reports in the Private LTE Industry, consider subscribing to industry newsletters, following relevant companies and organizations, or regularly checking reputable industry news sources and publications.
Methodology
Step 1 - Identification of Relevant Samples Size from Population Database


Step 2 - Approaches for Defining Global Market Size (Value, Volume* & Price*)

Note*: In applicable scenarios
Step 3 - Data Sources
Primary Research
- Web Analytics
- Survey Reports
- Research Institute
- Latest Research Reports
- Opinion Leaders
Secondary Research
- Annual Reports
- White Paper
- Latest Press Release
- Industry Association
- Paid Database
- Investor Presentations

Step 4 - Data Triangulation
Involves using different sources of information in order to increase the validity of a study
These sources are likely to be stakeholders in a program - participants, other researchers, program staff, other community members, and so on.
Then we put all data in single framework & apply various statistical tools to find out the dynamic on the market.
During the analysis stage, feedback from the stakeholder groups would be compared to determine areas of agreement as well as areas of divergence


