
Key Insights
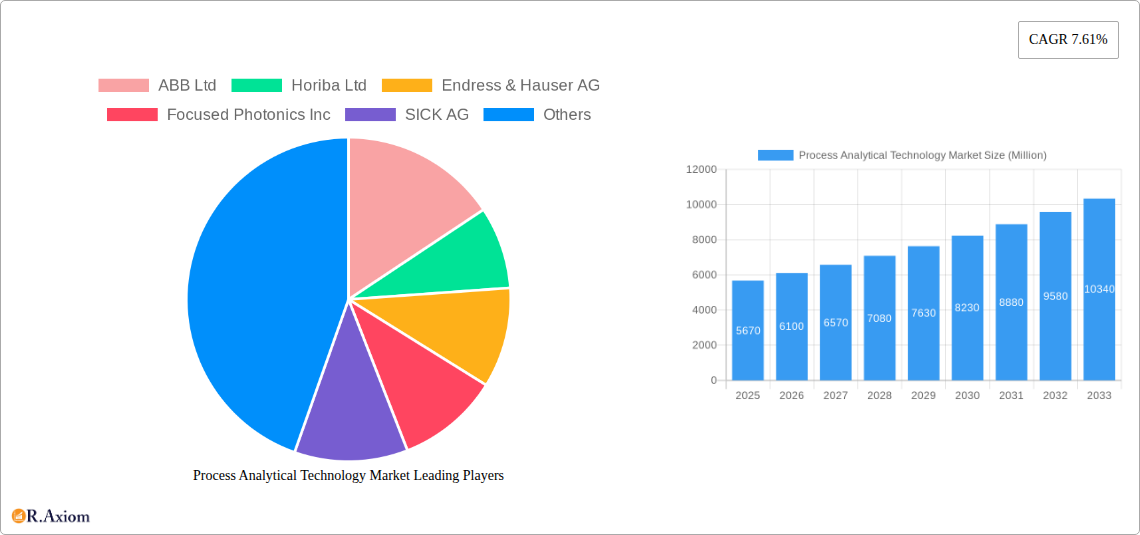
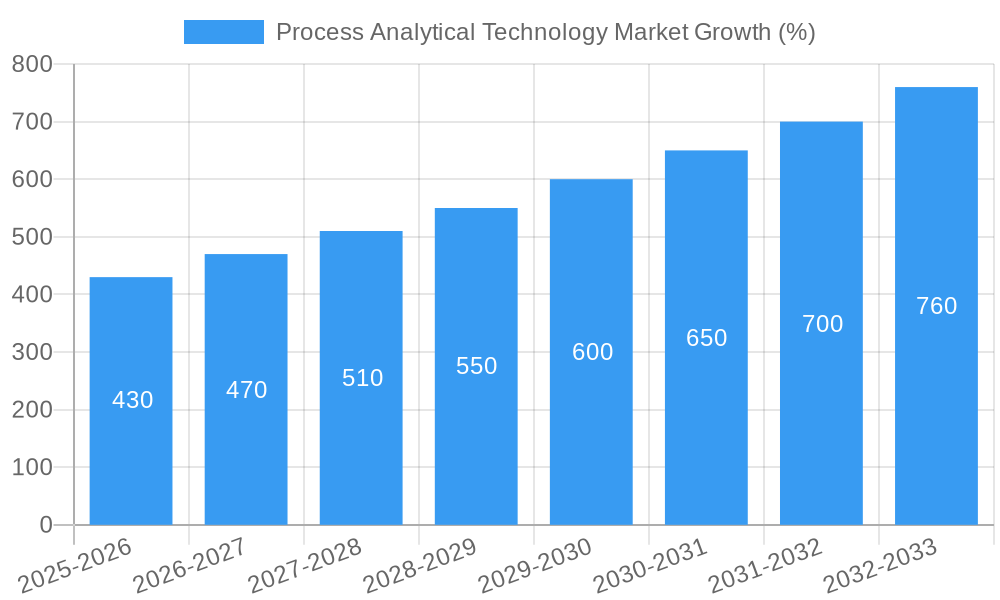
The Process Analytical Technology (PAT) market is experiencing robust growth, projected to reach a value of $5.67 billion in 2025 and maintain a Compound Annual Growth Rate (CAGR) of 7.61% from 2025 to 2033. This expansion is driven by several key factors. Increasing automation across various industries, particularly in oil & gas, chemicals & petrochemicals, and pharmaceuticals, necessitates sophisticated analytical tools for process optimization and quality control. Stringent regulatory requirements for product quality and safety further fuel demand for advanced PAT solutions. Furthermore, the rising adoption of Industry 4.0 principles, emphasizing data-driven decision-making and predictive maintenance, is a significant driver. Technological advancements, such as the development of miniaturized sensors, portable analyzers, and improved data analytics capabilities, are enhancing the efficiency and effectiveness of PAT systems, further driving market growth. The diverse range of analytical instruments, including gas chromatographs, gas analyzers, liquid analyzers, and spectrometers, caters to a wide spectrum of applications across various end-user industries.
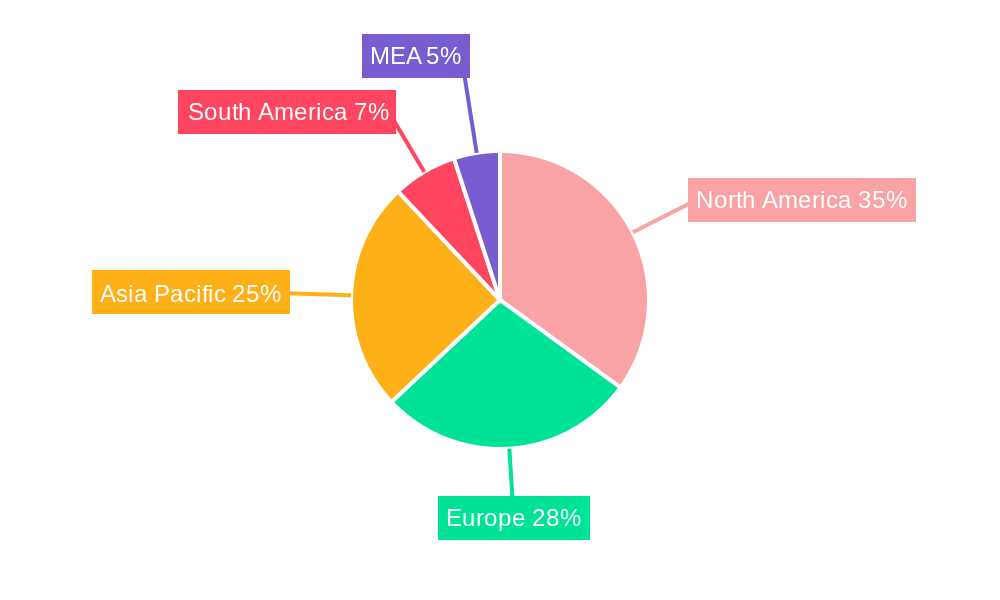
Geographical distribution of the market shows significant presence across North America, Europe, and the Asia-Pacific region. North America currently holds a substantial market share due to the early adoption of advanced technologies and the presence of major industry players. However, the Asia-Pacific region is anticipated to exhibit the fastest growth rate during the forecast period, fueled by rapid industrialization and increasing investments in infrastructure. While the market faces some restraints like high initial investment costs for advanced equipment and the need for skilled personnel, the overall growth trajectory remains positive, driven by continuous technological improvements and the evolving needs of diverse industries seeking enhanced process control and quality assurance. The competitive landscape includes prominent players such as ABB Ltd, Horiba Ltd, and Endress+Hauser AG, alongside numerous specialized companies, indicating a dynamic and innovative market.
Process Analytical Technology Market: A Comprehensive Report (2019-2033)
This in-depth report provides a comprehensive analysis of the Process Analytical Technology (PAT) market, offering actionable insights for stakeholders across the value chain. The study period spans 2019-2033, with 2025 as the base and estimated year, and a forecast period of 2025-2033. The historical period covered is 2019-2024. The report segments the market by type (Gas Chromatographs, Gas Analyzers, Liquid Analyzers, Spectrometers) and end-user industry (Oil and Gas, Chemicals & Petrochemicals, Pharmaceutical & Biotechnology, Metal & Mining, Water & Wastewater, Other End-user Industries). Key players analyzed include ABB Ltd, Horiba Ltd, Endress & Hauser AG, Focused Photonics Inc, SICK AG, Emerson Electric Co, Siemens AG, Schneider Electric SE, MKS Instruments Inc, Mettler Toledo, Hach Company, Neo Monitors AS, Bruker Corporation, Servomex Group Limited, and Extrel CMS LLC. The report's value is xx Million.
Process Analytical Technology Market Concentration & Innovation
The PAT market exhibits a moderately concentrated landscape, with a few large players holding significant market share. Market concentration is influenced by factors such as technological advancements, regulatory compliance requirements, and the strategic acquisitions and mergers witnessed in recent years. Innovation is a key driver, with companies constantly striving to develop more precise, efficient, and cost-effective analytical instruments.
Key aspects driving market concentration and innovation:
- High Barriers to Entry: Substantial R&D investment and expertise are required to develop and commercialize sophisticated PAT instruments.
- Regulatory Compliance: Stringent regulations in industries like pharmaceuticals and food processing drive the adoption of advanced PAT solutions.
- Technological Advancements: Continuous innovation in areas like spectroscopy, chromatography, and sensor technologies fuels market expansion.
- Mergers and Acquisitions (M&A): Significant M&A activities have reshaped the market landscape, consolidating market share and expanding product portfolios (e.g., the June 2022 acquisition of Schneider Electric's Process Analyzers business by Process Insights). The total value of M&A deals in the PAT market from 2019-2024 is estimated at xx Million. Market share data for key players is available in the full report.
- Product Substitutes: While limited, alternative technologies are emerging, potentially impacting the market share of established players.
- End-user Trends: Growing demand for real-time process monitoring and control across diverse industries is driving market growth.
Process Analytical Technology Market Industry Trends & Insights
The PAT market is experiencing robust growth, driven by the increasing need for real-time process monitoring and control across various industries. This demand is fueled by the need to enhance product quality, improve efficiency, reduce operational costs, and ensure regulatory compliance. The market is witnessing significant technological advancements, such as the integration of artificial intelligence (AI) and machine learning (ML) algorithms for data analysis and process optimization.
The CAGR for the PAT market during the forecast period (2025-2033) is projected to be xx%, with market penetration increasing across various end-user industries. Consumer preferences are shifting towards integrated, automated solutions that offer comprehensive data analysis capabilities. Competitive dynamics are characterized by intense rivalry among established players and the emergence of innovative start-ups.
Dominant Markets & Segments in Process Analytical Technology Market
The Pharmaceutical & Biotechnology sector is currently the dominant end-user industry for PAT, driven by stringent regulatory requirements and the growing complexity of biopharmaceutical manufacturing processes. Geographically, North America and Europe hold significant market share due to their advanced technological infrastructure and robust regulatory frameworks.
Key Drivers for Dominant Segments:
- Pharmaceutical & Biotechnology: Stringent regulatory compliance, increasing demand for complex biopharmaceuticals, and a focus on improving manufacturing efficiency.
- Chemicals & Petrochemicals: Need for improved process control, optimization of production yields, and enhanced safety measures.
- Oil & Gas: Demand for real-time monitoring of critical parameters in refineries and processing plants.
Dominance Analysis:
North America's dominance is attributed to strong R&D investments, the early adoption of advanced PAT technologies, and the presence of major market players. Europe follows closely, driven by similar factors and strong regulatory frameworks. The Asia-Pacific region is expected to witness rapid growth in the coming years, driven by increasing industrialization and investment in advanced manufacturing facilities. The detailed breakdown of market share by region and segment is available within the complete report.
Process Analytical Technology Market Product Developments
Recent product innovations include the introduction of miniaturized analyzers, portable devices, and integrated systems that combine multiple analytical techniques. These advancements enable real-time monitoring and in-situ analysis, improving process efficiency and reducing operational costs. Furthermore, developments such as AI-driven analytics enhance data interpretation and predictive capabilities. The enhanced user interface of the Minispec Droplet Size Analyzer 2.0 exemplifies the focus on user-friendliness and streamlined workflows. The competitive advantage lies in offering innovative solutions that address specific end-user needs and improve the overall efficiency and effectiveness of manufacturing processes.
Report Scope & Segmentation Analysis
Type:
- Gas Chromatographs: This segment is expected to witness steady growth driven by its widespread applications in various industries. Market size is xx Million in 2025, expected to reach xx Million by 2033. Competitive dynamics are characterized by a mix of established players and emerging competitors.
- Gas Analyzers: This segment demonstrates strong growth potential, particularly with the rise of hydrogen-based technologies. Market size is xx Million in 2025, expected to reach xx Million by 2033.
- Liquid Analyzers: This is a large and established segment with steady growth driven by routine analysis requirements across various industries. Market size is xx Million in 2025, expected to reach xx Million by 2033.
- Spectrometers: This segment is growing rapidly, driven by advancements in spectroscopic techniques and their applications in various fields. Market size is xx Million in 2025, expected to reach xx Million by 2033.
End-User Industry:
Each end-user industry segment exhibits unique growth trajectories based on specific regulatory requirements, technological needs, and industry growth rates. The detailed analysis of each segment, including market size and competitive landscape, is provided in the complete report.
Key Drivers of Process Analytical Technology Market Growth
Several factors fuel the growth of the PAT market. Technological advancements, like the development of miniaturized and portable analyzers, enable in-situ measurements, improving process efficiency. The increasing demand for real-time process monitoring across various industries, especially in pharmaceutical manufacturing where regulatory compliance is paramount, significantly drives adoption. Moreover, stringent regulatory requirements in sectors like pharmaceuticals necessitate the implementation of PAT solutions to maintain product quality and ensure compliance. Government initiatives and supportive policies further promote market growth.
Challenges in the Process Analytical Technology Market Sector
The PAT market faces challenges such as high initial investment costs associated with implementing PAT systems, which can hinder adoption among smaller enterprises. Furthermore, the complexity of PAT technologies and the need for skilled personnel to operate and maintain the equipment can present hurdles. The competitive landscape, with established players and emerging competitors, creates intense competition and pressure on pricing. Finally, supply chain disruptions may impact the availability and cost of components, affecting overall market growth.
Emerging Opportunities in Process Analytical Technology Market
The PAT market presents significant opportunities in emerging economies, particularly in Asia-Pacific, driven by increasing industrialization and growing demand for advanced manufacturing technologies. The integration of AI and ML in PAT systems offers opportunities for enhanced data analytics and process optimization. Moreover, the development of new analytical techniques and sensors further presents avenues for growth, creating opportunities for innovation and market expansion.
Leading Players in the Process Analytical Technology Market Market
- ABB Ltd
- Horiba Ltd
- Endress & Hauser AG
- Focused Photonics Inc
- SICK AG
- Emerson Electric Co
- Siemens AG
- Schneider Electric SE
- MKS Instruments Inc
- Mettler Toledo
- Hach Company
- Neo Monitors AS
- Bruker Corporation
- Servomex Group Limited
- Extrel CMS LLC
Key Developments in Process Analytical Technology Market Industry
- August 2023: Rentschler Biopharma, Refeyn, and Cell and Gene Therapy Catapult collaborate to leverage PAT for enhanced AAV gene therapy manufacturing.
- March 2023: Cell and Gene Therapy Catapult opens a state-of-the-art PAT lab in Stevenage to support advanced therapy manufacturing.
- June 2022: Process Insights acquires Schneider Electric's Process Analyzers business, expanding its product portfolio.
- May 2022: Bruker Corporation launches the Minispec Droplet Size Analyzer 2.0, enhancing texture and stability studies.
- March 2022: Horiba Ltd launches HyEVO, a high-precision hydrogen gas analyzer.
Strategic Outlook for Process Analytical Technology Market Market
The PAT market is poised for sustained growth, driven by technological innovation, increasing demand for real-time process monitoring, and stringent regulatory requirements across various industries. Emerging technologies like AI and ML will further enhance the capabilities of PAT systems, leading to improved process efficiency, reduced costs, and enhanced product quality. The market's future potential lies in expanding applications across diverse industries and integrating PAT into smart manufacturing initiatives.
Process Analytical Technology Market Segmentation
-
1. Type
- 1.1. Gas Chromatographs
- 1.2. Gas Analyzers
- 1.3. Liquid Analyzers
- 1.4. Spectrometers
-
2. End-user Industry
- 2.1. Oil and Gas
- 2.2. Chemicals & Petrochemicals
- 2.3. Pharmaceutical & Biotechnology
- 2.4. Metal & Mining
- 2.5. Water & Wastewater
- 2.6. Other End-user Industries
Process Analytical Technology Market Segmentation By Geography
- 1. North America
- 2. Europe
- 3. Asia Pacific
- 4. Rest of the World
Process Analytical Technology Market REPORT HIGHLIGHTS
| Aspects | Details |
|---|---|
| Study Period | 2019-2033 |
| Base Year | 2024 |
| Estimated Year | 2025 |
| Forecast Period | 2025-2033 |
| Historical Period | 2019-2024 |
| Growth Rate | CAGR of 7.61% from 2019-2033 |
| Segmentation |
|
Table of Contents
- 1. Introduction
- 1.1. Research Scope
- 1.2. Market Segmentation
- 1.3. Research Methodology
- 1.4. Definitions and Assumptions
- 2. Executive Summary
- 2.1. Introduction
- 3. Market Dynamics
- 3.1. Introduction
- 3.2. Market Drivers
- 3.2.1. Introduction of High-efficient Motors; Increasing Adoption of Power Management and Predictive Maintenance Solutions
- 3.3. Market Restrains
- 3.3.1. ; High Initial Infrastructure Expenditure
- 3.4. Market Trends
- 3.4.1. Pharmaceutical and Biotechnology is Observing a Significant Growth
- 4. Market Factor Analysis
- 4.1. Porters Five Forces
- 4.2. Supply/Value Chain
- 4.3. PESTEL analysis
- 4.4. Market Entropy
- 4.5. Patent/Trademark Analysis
- 5. Global Process Analytical Technology Market Analysis, Insights and Forecast, 2019-2031
- 5.1. Market Analysis, Insights and Forecast - by Type
- 5.1.1. Gas Chromatographs
- 5.1.2. Gas Analyzers
- 5.1.3. Liquid Analyzers
- 5.1.4. Spectrometers
- 5.2. Market Analysis, Insights and Forecast - by End-user Industry
- 5.2.1. Oil and Gas
- 5.2.2. Chemicals & Petrochemicals
- 5.2.3. Pharmaceutical & Biotechnology
- 5.2.4. Metal & Mining
- 5.2.5. Water & Wastewater
- 5.2.6. Other End-user Industries
- 5.3. Market Analysis, Insights and Forecast - by Region
- 5.3.1. North America
- 5.3.2. Europe
- 5.3.3. Asia Pacific
- 5.3.4. Rest of the World
- 5.1. Market Analysis, Insights and Forecast - by Type
- 6. North America Process Analytical Technology Market Analysis, Insights and Forecast, 2019-2031
- 6.1. Market Analysis, Insights and Forecast - by Type
- 6.1.1. Gas Chromatographs
- 6.1.2. Gas Analyzers
- 6.1.3. Liquid Analyzers
- 6.1.4. Spectrometers
- 6.2. Market Analysis, Insights and Forecast - by End-user Industry
- 6.2.1. Oil and Gas
- 6.2.2. Chemicals & Petrochemicals
- 6.2.3. Pharmaceutical & Biotechnology
- 6.2.4. Metal & Mining
- 6.2.5. Water & Wastewater
- 6.2.6. Other End-user Industries
- 6.1. Market Analysis, Insights and Forecast - by Type
- 7. Europe Process Analytical Technology Market Analysis, Insights and Forecast, 2019-2031
- 7.1. Market Analysis, Insights and Forecast - by Type
- 7.1.1. Gas Chromatographs
- 7.1.2. Gas Analyzers
- 7.1.3. Liquid Analyzers
- 7.1.4. Spectrometers
- 7.2. Market Analysis, Insights and Forecast - by End-user Industry
- 7.2.1. Oil and Gas
- 7.2.2. Chemicals & Petrochemicals
- 7.2.3. Pharmaceutical & Biotechnology
- 7.2.4. Metal & Mining
- 7.2.5. Water & Wastewater
- 7.2.6. Other End-user Industries
- 7.1. Market Analysis, Insights and Forecast - by Type
- 8. Asia Pacific Process Analytical Technology Market Analysis, Insights and Forecast, 2019-2031
- 8.1. Market Analysis, Insights and Forecast - by Type
- 8.1.1. Gas Chromatographs
- 8.1.2. Gas Analyzers
- 8.1.3. Liquid Analyzers
- 8.1.4. Spectrometers
- 8.2. Market Analysis, Insights and Forecast - by End-user Industry
- 8.2.1. Oil and Gas
- 8.2.2. Chemicals & Petrochemicals
- 8.2.3. Pharmaceutical & Biotechnology
- 8.2.4. Metal & Mining
- 8.2.5. Water & Wastewater
- 8.2.6. Other End-user Industries
- 8.1. Market Analysis, Insights and Forecast - by Type
- 9. Rest of the World Process Analytical Technology Market Analysis, Insights and Forecast, 2019-2031
- 9.1. Market Analysis, Insights and Forecast - by Type
- 9.1.1. Gas Chromatographs
- 9.1.2. Gas Analyzers
- 9.1.3. Liquid Analyzers
- 9.1.4. Spectrometers
- 9.2. Market Analysis, Insights and Forecast - by End-user Industry
- 9.2.1. Oil and Gas
- 9.2.2. Chemicals & Petrochemicals
- 9.2.3. Pharmaceutical & Biotechnology
- 9.2.4. Metal & Mining
- 9.2.5. Water & Wastewater
- 9.2.6. Other End-user Industries
- 9.1. Market Analysis, Insights and Forecast - by Type
- 10. North America Process Analytical Technology Market Analysis, Insights and Forecast, 2019-2031
- 10.1. Market Analysis, Insights and Forecast - By Country/Sub-region
- 10.1.1. undefined
- 11. Europe Process Analytical Technology Market Analysis, Insights and Forecast, 2019-2031
- 11.1. Market Analysis, Insights and Forecast - By Country/Sub-region
- 11.1.1. undefined
- 12. Asia Pacific Process Analytical Technology Market Analysis, Insights and Forecast, 2019-2031
- 12.1. Market Analysis, Insights and Forecast - By Country/Sub-region
- 12.1.1. undefined
- 13. South America Process Analytical Technology Market Analysis, Insights and Forecast, 2019-2031
- 13.1. Market Analysis, Insights and Forecast - By Country/Sub-region
- 13.1.1. undefined
- 14. North America Process Analytical Technology Market Analysis, Insights and Forecast, 2019-2031
- 14.1. Market Analysis, Insights and Forecast - By Country/Sub-region
- 14.1.1. undefined
- 15. MEA Process Analytical Technology Market Analysis, Insights and Forecast, 2019-2031
- 15.1. Market Analysis, Insights and Forecast - By Country/Sub-region
- 15.1.1. undefined
- 16. Competitive Analysis
- 16.1. Global Market Share Analysis 2024
- 16.2. Company Profiles
- 16.2.1 ABB Ltd
- 16.2.1.1. Overview
- 16.2.1.2. Products
- 16.2.1.3. SWOT Analysis
- 16.2.1.4. Recent Developments
- 16.2.1.5. Financials (Based on Availability)
- 16.2.2 Horiba Ltd
- 16.2.2.1. Overview
- 16.2.2.2. Products
- 16.2.2.3. SWOT Analysis
- 16.2.2.4. Recent Developments
- 16.2.2.5. Financials (Based on Availability)
- 16.2.3 Endress & Hauser AG
- 16.2.3.1. Overview
- 16.2.3.2. Products
- 16.2.3.3. SWOT Analysis
- 16.2.3.4. Recent Developments
- 16.2.3.5. Financials (Based on Availability)
- 16.2.4 Focused Photonics Inc
- 16.2.4.1. Overview
- 16.2.4.2. Products
- 16.2.4.3. SWOT Analysis
- 16.2.4.4. Recent Developments
- 16.2.4.5. Financials (Based on Availability)
- 16.2.5 SICK AG
- 16.2.5.1. Overview
- 16.2.5.2. Products
- 16.2.5.3. SWOT Analysis
- 16.2.5.4. Recent Developments
- 16.2.5.5. Financials (Based on Availability)
- 16.2.6 Emerson Electric Co
- 16.2.6.1. Overview
- 16.2.6.2. Products
- 16.2.6.3. SWOT Analysis
- 16.2.6.4. Recent Developments
- 16.2.6.5. Financials (Based on Availability)
- 16.2.7 Siemens AG
- 16.2.7.1. Overview
- 16.2.7.2. Products
- 16.2.7.3. SWOT Analysis
- 16.2.7.4. Recent Developments
- 16.2.7.5. Financials (Based on Availability)
- 16.2.8 Schneider Electric SE
- 16.2.8.1. Overview
- 16.2.8.2. Products
- 16.2.8.3. SWOT Analysis
- 16.2.8.4. Recent Developments
- 16.2.8.5. Financials (Based on Availability)
- 16.2.9 MKS Instruments Inc
- 16.2.9.1. Overview
- 16.2.9.2. Products
- 16.2.9.3. SWOT Analysis
- 16.2.9.4. Recent Developments
- 16.2.9.5. Financials (Based on Availability)
- 16.2.10 Mettler Toledo
- 16.2.10.1. Overview
- 16.2.10.2. Products
- 16.2.10.3. SWOT Analysis
- 16.2.10.4. Recent Developments
- 16.2.10.5. Financials (Based on Availability)
- 16.2.11 Hach Company
- 16.2.11.1. Overview
- 16.2.11.2. Products
- 16.2.11.3. SWOT Analysis
- 16.2.11.4. Recent Developments
- 16.2.11.5. Financials (Based on Availability)
- 16.2.12 Neo Monitors AS
- 16.2.12.1. Overview
- 16.2.12.2. Products
- 16.2.12.3. SWOT Analysis
- 16.2.12.4. Recent Developments
- 16.2.12.5. Financials (Based on Availability)
- 16.2.13 Bruker Corporation
- 16.2.13.1. Overview
- 16.2.13.2. Products
- 16.2.13.3. SWOT Analysis
- 16.2.13.4. Recent Developments
- 16.2.13.5. Financials (Based on Availability)
- 16.2.14 ServomexGroup Limited
- 16.2.14.1. Overview
- 16.2.14.2. Products
- 16.2.14.3. SWOT Analysis
- 16.2.14.4. Recent Developments
- 16.2.14.5. Financials (Based on Availability)
- 16.2.15 Extrel CMS LLC
- 16.2.15.1. Overview
- 16.2.15.2. Products
- 16.2.15.3. SWOT Analysis
- 16.2.15.4. Recent Developments
- 16.2.15.5. Financials (Based on Availability)
- 16.2.1 ABB Ltd
List of Figures
- Figure 1: Global Process Analytical Technology Market Revenue Breakdown (Million, %) by Region 2024 & 2032
- Figure 2: Global Process Analytical Technology Market Volume Breakdown (K Unit, %) by Region 2024 & 2032
- Figure 3: North America Process Analytical Technology Market Revenue (Million), by Country 2024 & 2032
- Figure 4: North America Process Analytical Technology Market Volume (K Unit), by Country 2024 & 2032
- Figure 5: North America Process Analytical Technology Market Revenue Share (%), by Country 2024 & 2032
- Figure 6: North America Process Analytical Technology Market Volume Share (%), by Country 2024 & 2032
- Figure 7: Europe Process Analytical Technology Market Revenue (Million), by Country 2024 & 2032
- Figure 8: Europe Process Analytical Technology Market Volume (K Unit), by Country 2024 & 2032
- Figure 9: Europe Process Analytical Technology Market Revenue Share (%), by Country 2024 & 2032
- Figure 10: Europe Process Analytical Technology Market Volume Share (%), by Country 2024 & 2032
- Figure 11: Asia Pacific Process Analytical Technology Market Revenue (Million), by Country 2024 & 2032
- Figure 12: Asia Pacific Process Analytical Technology Market Volume (K Unit), by Country 2024 & 2032
- Figure 13: Asia Pacific Process Analytical Technology Market Revenue Share (%), by Country 2024 & 2032
- Figure 14: Asia Pacific Process Analytical Technology Market Volume Share (%), by Country 2024 & 2032
- Figure 15: South America Process Analytical Technology Market Revenue (Million), by Country 2024 & 2032
- Figure 16: South America Process Analytical Technology Market Volume (K Unit), by Country 2024 & 2032
- Figure 17: South America Process Analytical Technology Market Revenue Share (%), by Country 2024 & 2032
- Figure 18: South America Process Analytical Technology Market Volume Share (%), by Country 2024 & 2032
- Figure 19: North America Process Analytical Technology Market Revenue (Million), by Country 2024 & 2032
- Figure 20: North America Process Analytical Technology Market Volume (K Unit), by Country 2024 & 2032
- Figure 21: North America Process Analytical Technology Market Revenue Share (%), by Country 2024 & 2032
- Figure 22: North America Process Analytical Technology Market Volume Share (%), by Country 2024 & 2032
- Figure 23: MEA Process Analytical Technology Market Revenue (Million), by Country 2024 & 2032
- Figure 24: MEA Process Analytical Technology Market Volume (K Unit), by Country 2024 & 2032
- Figure 25: MEA Process Analytical Technology Market Revenue Share (%), by Country 2024 & 2032
- Figure 26: MEA Process Analytical Technology Market Volume Share (%), by Country 2024 & 2032
- Figure 27: North America Process Analytical Technology Market Revenue (Million), by Type 2024 & 2032
- Figure 28: North America Process Analytical Technology Market Volume (K Unit), by Type 2024 & 2032
- Figure 29: North America Process Analytical Technology Market Revenue Share (%), by Type 2024 & 2032
- Figure 30: North America Process Analytical Technology Market Volume Share (%), by Type 2024 & 2032
- Figure 31: North America Process Analytical Technology Market Revenue (Million), by End-user Industry 2024 & 2032
- Figure 32: North America Process Analytical Technology Market Volume (K Unit), by End-user Industry 2024 & 2032
- Figure 33: North America Process Analytical Technology Market Revenue Share (%), by End-user Industry 2024 & 2032
- Figure 34: North America Process Analytical Technology Market Volume Share (%), by End-user Industry 2024 & 2032
- Figure 35: North America Process Analytical Technology Market Revenue (Million), by Country 2024 & 2032
- Figure 36: North America Process Analytical Technology Market Volume (K Unit), by Country 2024 & 2032
- Figure 37: North America Process Analytical Technology Market Revenue Share (%), by Country 2024 & 2032
- Figure 38: North America Process Analytical Technology Market Volume Share (%), by Country 2024 & 2032
- Figure 39: Europe Process Analytical Technology Market Revenue (Million), by Type 2024 & 2032
- Figure 40: Europe Process Analytical Technology Market Volume (K Unit), by Type 2024 & 2032
- Figure 41: Europe Process Analytical Technology Market Revenue Share (%), by Type 2024 & 2032
- Figure 42: Europe Process Analytical Technology Market Volume Share (%), by Type 2024 & 2032
- Figure 43: Europe Process Analytical Technology Market Revenue (Million), by End-user Industry 2024 & 2032
- Figure 44: Europe Process Analytical Technology Market Volume (K Unit), by End-user Industry 2024 & 2032
- Figure 45: Europe Process Analytical Technology Market Revenue Share (%), by End-user Industry 2024 & 2032
- Figure 46: Europe Process Analytical Technology Market Volume Share (%), by End-user Industry 2024 & 2032
- Figure 47: Europe Process Analytical Technology Market Revenue (Million), by Country 2024 & 2032
- Figure 48: Europe Process Analytical Technology Market Volume (K Unit), by Country 2024 & 2032
- Figure 49: Europe Process Analytical Technology Market Revenue Share (%), by Country 2024 & 2032
- Figure 50: Europe Process Analytical Technology Market Volume Share (%), by Country 2024 & 2032
- Figure 51: Asia Pacific Process Analytical Technology Market Revenue (Million), by Type 2024 & 2032
- Figure 52: Asia Pacific Process Analytical Technology Market Volume (K Unit), by Type 2024 & 2032
- Figure 53: Asia Pacific Process Analytical Technology Market Revenue Share (%), by Type 2024 & 2032
- Figure 54: Asia Pacific Process Analytical Technology Market Volume Share (%), by Type 2024 & 2032
- Figure 55: Asia Pacific Process Analytical Technology Market Revenue (Million), by End-user Industry 2024 & 2032
- Figure 56: Asia Pacific Process Analytical Technology Market Volume (K Unit), by End-user Industry 2024 & 2032
- Figure 57: Asia Pacific Process Analytical Technology Market Revenue Share (%), by End-user Industry 2024 & 2032
- Figure 58: Asia Pacific Process Analytical Technology Market Volume Share (%), by End-user Industry 2024 & 2032
- Figure 59: Asia Pacific Process Analytical Technology Market Revenue (Million), by Country 2024 & 2032
- Figure 60: Asia Pacific Process Analytical Technology Market Volume (K Unit), by Country 2024 & 2032
- Figure 61: Asia Pacific Process Analytical Technology Market Revenue Share (%), by Country 2024 & 2032
- Figure 62: Asia Pacific Process Analytical Technology Market Volume Share (%), by Country 2024 & 2032
- Figure 63: Rest of the World Process Analytical Technology Market Revenue (Million), by Type 2024 & 2032
- Figure 64: Rest of the World Process Analytical Technology Market Volume (K Unit), by Type 2024 & 2032
- Figure 65: Rest of the World Process Analytical Technology Market Revenue Share (%), by Type 2024 & 2032
- Figure 66: Rest of the World Process Analytical Technology Market Volume Share (%), by Type 2024 & 2032
- Figure 67: Rest of the World Process Analytical Technology Market Revenue (Million), by End-user Industry 2024 & 2032
- Figure 68: Rest of the World Process Analytical Technology Market Volume (K Unit), by End-user Industry 2024 & 2032
- Figure 69: Rest of the World Process Analytical Technology Market Revenue Share (%), by End-user Industry 2024 & 2032
- Figure 70: Rest of the World Process Analytical Technology Market Volume Share (%), by End-user Industry 2024 & 2032
- Figure 71: Rest of the World Process Analytical Technology Market Revenue (Million), by Country 2024 & 2032
- Figure 72: Rest of the World Process Analytical Technology Market Volume (K Unit), by Country 2024 & 2032
- Figure 73: Rest of the World Process Analytical Technology Market Revenue Share (%), by Country 2024 & 2032
- Figure 74: Rest of the World Process Analytical Technology Market Volume Share (%), by Country 2024 & 2032
List of Tables
- Table 1: Global Process Analytical Technology Market Revenue Million Forecast, by Region 2019 & 2032
- Table 2: Global Process Analytical Technology Market Volume K Unit Forecast, by Region 2019 & 2032
- Table 3: Global Process Analytical Technology Market Revenue Million Forecast, by Type 2019 & 2032
- Table 4: Global Process Analytical Technology Market Volume K Unit Forecast, by Type 2019 & 2032
- Table 5: Global Process Analytical Technology Market Revenue Million Forecast, by End-user Industry 2019 & 2032
- Table 6: Global Process Analytical Technology Market Volume K Unit Forecast, by End-user Industry 2019 & 2032
- Table 7: Global Process Analytical Technology Market Revenue Million Forecast, by Region 2019 & 2032
- Table 8: Global Process Analytical Technology Market Volume K Unit Forecast, by Region 2019 & 2032
- Table 9: Global Process Analytical Technology Market Revenue Million Forecast, by Country 2019 & 2032
- Table 10: Global Process Analytical Technology Market Volume K Unit Forecast, by Country 2019 & 2032
- Table 11: Global Process Analytical Technology Market Revenue Million Forecast, by Country 2019 & 2032
- Table 12: Global Process Analytical Technology Market Volume K Unit Forecast, by Country 2019 & 2032
- Table 13: Global Process Analytical Technology Market Revenue Million Forecast, by Country 2019 & 2032
- Table 14: Global Process Analytical Technology Market Volume K Unit Forecast, by Country 2019 & 2032
- Table 15: Global Process Analytical Technology Market Revenue Million Forecast, by Country 2019 & 2032
- Table 16: Global Process Analytical Technology Market Volume K Unit Forecast, by Country 2019 & 2032
- Table 17: Global Process Analytical Technology Market Revenue Million Forecast, by Country 2019 & 2032
- Table 18: Global Process Analytical Technology Market Volume K Unit Forecast, by Country 2019 & 2032
- Table 19: Global Process Analytical Technology Market Revenue Million Forecast, by Country 2019 & 2032
- Table 20: Global Process Analytical Technology Market Volume K Unit Forecast, by Country 2019 & 2032
- Table 21: Global Process Analytical Technology Market Revenue Million Forecast, by Type 2019 & 2032
- Table 22: Global Process Analytical Technology Market Volume K Unit Forecast, by Type 2019 & 2032
- Table 23: Global Process Analytical Technology Market Revenue Million Forecast, by End-user Industry 2019 & 2032
- Table 24: Global Process Analytical Technology Market Volume K Unit Forecast, by End-user Industry 2019 & 2032
- Table 25: Global Process Analytical Technology Market Revenue Million Forecast, by Country 2019 & 2032
- Table 26: Global Process Analytical Technology Market Volume K Unit Forecast, by Country 2019 & 2032
- Table 27: Global Process Analytical Technology Market Revenue Million Forecast, by Type 2019 & 2032
- Table 28: Global Process Analytical Technology Market Volume K Unit Forecast, by Type 2019 & 2032
- Table 29: Global Process Analytical Technology Market Revenue Million Forecast, by End-user Industry 2019 & 2032
- Table 30: Global Process Analytical Technology Market Volume K Unit Forecast, by End-user Industry 2019 & 2032
- Table 31: Global Process Analytical Technology Market Revenue Million Forecast, by Country 2019 & 2032
- Table 32: Global Process Analytical Technology Market Volume K Unit Forecast, by Country 2019 & 2032
- Table 33: Global Process Analytical Technology Market Revenue Million Forecast, by Type 2019 & 2032
- Table 34: Global Process Analytical Technology Market Volume K Unit Forecast, by Type 2019 & 2032
- Table 35: Global Process Analytical Technology Market Revenue Million Forecast, by End-user Industry 2019 & 2032
- Table 36: Global Process Analytical Technology Market Volume K Unit Forecast, by End-user Industry 2019 & 2032
- Table 37: Global Process Analytical Technology Market Revenue Million Forecast, by Country 2019 & 2032
- Table 38: Global Process Analytical Technology Market Volume K Unit Forecast, by Country 2019 & 2032
- Table 39: Global Process Analytical Technology Market Revenue Million Forecast, by Type 2019 & 2032
- Table 40: Global Process Analytical Technology Market Volume K Unit Forecast, by Type 2019 & 2032
- Table 41: Global Process Analytical Technology Market Revenue Million Forecast, by End-user Industry 2019 & 2032
- Table 42: Global Process Analytical Technology Market Volume K Unit Forecast, by End-user Industry 2019 & 2032
- Table 43: Global Process Analytical Technology Market Revenue Million Forecast, by Country 2019 & 2032
- Table 44: Global Process Analytical Technology Market Volume K Unit Forecast, by Country 2019 & 2032
Frequently Asked Questions
1. What is the projected Compound Annual Growth Rate (CAGR) of the Process Analytical Technology Market?
The projected CAGR is approximately 7.61%.
2. Which companies are prominent players in the Process Analytical Technology Market?
Key companies in the market include ABB Ltd, Horiba Ltd, Endress & Hauser AG, Focused Photonics Inc, SICK AG, Emerson Electric Co, Siemens AG, Schneider Electric SE, MKS Instruments Inc, Mettler Toledo, Hach Company, Neo Monitors AS, Bruker Corporation, ServomexGroup Limited, Extrel CMS LLC.
3. What are the main segments of the Process Analytical Technology Market?
The market segments include Type, End-user Industry.
4. Can you provide details about the market size?
The market size is estimated to be USD 5.67 Million as of 2022.
5. What are some drivers contributing to market growth?
Introduction of High-efficient Motors; Increasing Adoption of Power Management and Predictive Maintenance Solutions.
6. What are the notable trends driving market growth?
Pharmaceutical and Biotechnology is Observing a Significant Growth.
7. Are there any restraints impacting market growth?
; High Initial Infrastructure Expenditure.
8. Can you provide examples of recent developments in the market?
August 2023: Rentschler Biopharma announced a collaboration with Refeyn and Cell and Gene Therapy Catapult (CGT Catapult). This collaboration aims to leverage cutting-edge process analytical technologies (PAT) to enhance the manufacturing efficiency of adeno-associated viruses (AAVs) in gene therapy production. The partners aim to create a digitized and automated AAV gene therapy manufacturing platform. The companies will use their collective expertise in manufacturing, process analytics, and PAT to design automated monitoring and control systems tailored for integration into Rentschler Biopharma's current AAV manufacturing workflow.
9. What pricing options are available for accessing the report?
Pricing options include single-user, multi-user, and enterprise licenses priced at USD 4750, USD 5250, and USD 8750 respectively.
10. Is the market size provided in terms of value or volume?
The market size is provided in terms of value, measured in Million and volume, measured in K Unit.
11. Are there any specific market keywords associated with the report?
Yes, the market keyword associated with the report is "Process Analytical Technology Market," which aids in identifying and referencing the specific market segment covered.
12. How do I determine which pricing option suits my needs best?
The pricing options vary based on user requirements and access needs. Individual users may opt for single-user licenses, while businesses requiring broader access may choose multi-user or enterprise licenses for cost-effective access to the report.
13. Are there any additional resources or data provided in the Process Analytical Technology Market report?
While the report offers comprehensive insights, it's advisable to review the specific contents or supplementary materials provided to ascertain if additional resources or data are available.
14. How can I stay updated on further developments or reports in the Process Analytical Technology Market?
To stay informed about further developments, trends, and reports in the Process Analytical Technology Market, consider subscribing to industry newsletters, following relevant companies and organizations, or regularly checking reputable industry news sources and publications.
Methodology
Step 1 - Identification of Relevant Samples Size from Population Database


Step 2 - Approaches for Defining Global Market Size (Value, Volume* & Price*)

Note*: In applicable scenarios
Step 3 - Data Sources
Primary Research
- Web Analytics
- Survey Reports
- Research Institute
- Latest Research Reports
- Opinion Leaders
Secondary Research
- Annual Reports
- White Paper
- Latest Press Release
- Industry Association
- Paid Database
- Investor Presentations

Step 4 - Data Triangulation
Involves using different sources of information in order to increase the validity of a study
These sources are likely to be stakeholders in a program - participants, other researchers, program staff, other community members, and so on.
Then we put all data in single framework & apply various statistical tools to find out the dynamic on the market.
During the analysis stage, feedback from the stakeholder groups would be compared to determine areas of agreement as well as areas of divergence


