
Key Insights
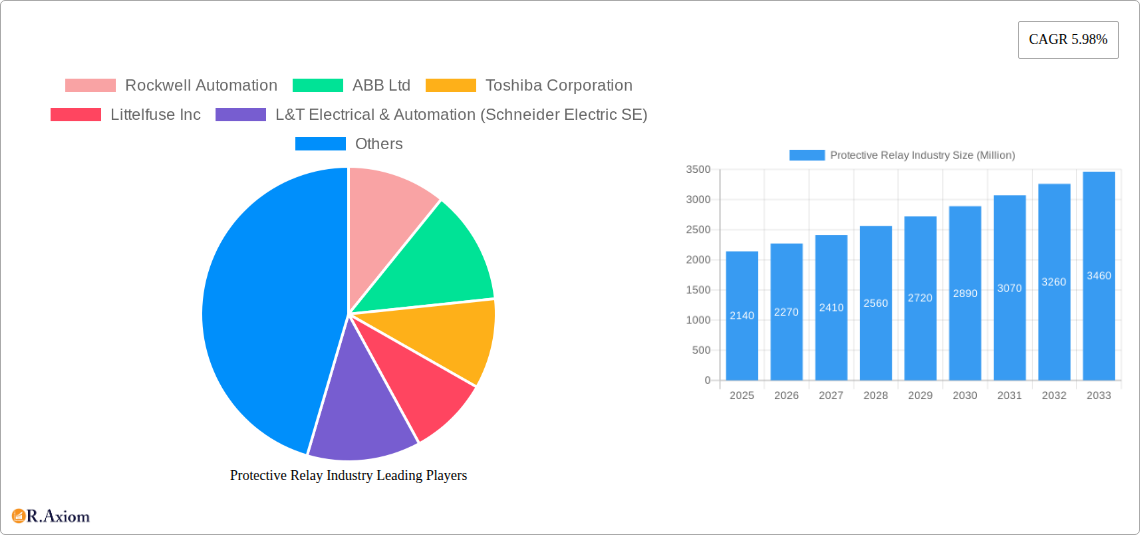
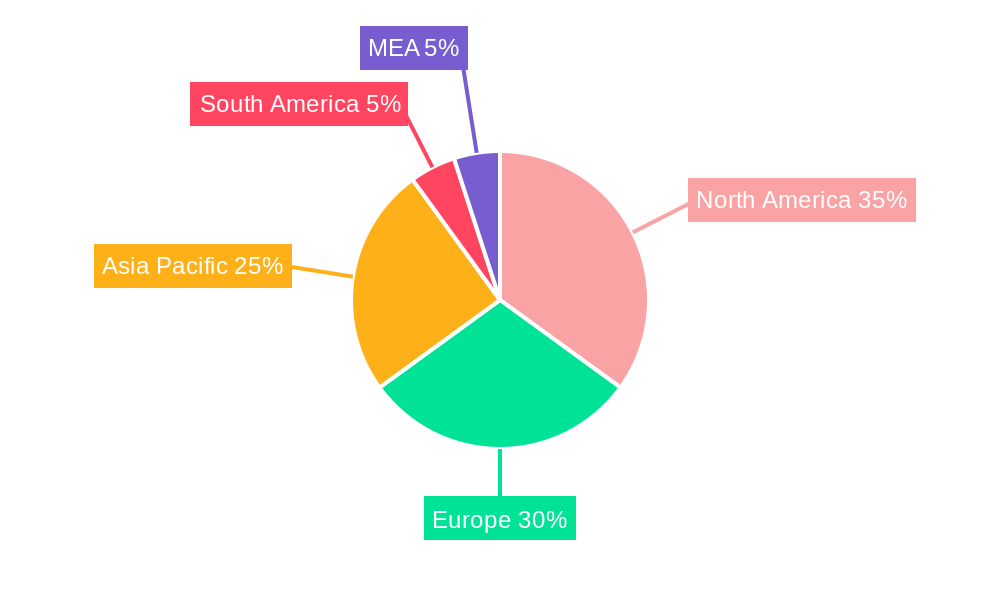
The global protective relay market, valued at $2.14 billion in 2025, is projected to experience robust growth, driven by the increasing demand for reliable and efficient power grids, coupled with the expanding industrial automation sector. The market's Compound Annual Growth Rate (CAGR) of 5.98% from 2019-2024 indicates a consistent upward trajectory, expected to continue through 2033. Key growth drivers include the rising adoption of smart grids, which necessitate advanced protection and control systems, and the growing integration of renewable energy sources, requiring sophisticated relays to manage intermittent power supply. Furthermore, stringent grid reliability standards and regulations globally mandate the deployment of advanced protective relay systems, fueling market expansion. The market is segmented by voltage range (low, medium, and high voltage) and end-user (utilities and industrial), with utilities representing a larger market share due to their extensive power grid infrastructure. Significant regional variations exist, with North America and Europe currently dominating the market, but the Asia-Pacific region is expected to witness the fastest growth due to rapid industrialization and infrastructure development. Market restraints include high initial investment costs for advanced relay systems and the need for skilled professionals for installation and maintenance. However, technological advancements, such as the integration of digital technologies and improved communication protocols, are mitigating these constraints.
Competitive landscape analysis reveals the presence of established players like Rockwell Automation, ABB Ltd, Siemens AG, and Schneider Electric SE, along with several other prominent companies actively contributing to innovations in protective relay technology. These companies are focusing on developing advanced functionalities like improved fault detection, faster response times, and enhanced cybersecurity features. The ongoing trend towards digitalization within the power sector is creating further opportunities for the market. The integration of IoT and AI in protective relays is expected to boost efficiency, enhance monitoring capabilities, and contribute to improved grid stability. The increasing emphasis on predictive maintenance, facilitated by advanced analytics and data analysis capabilities within the relays themselves, is also a major driver for market growth. The market is likely to see increased consolidation and strategic partnerships in the coming years as companies strive to expand their product portfolios and global reach.
Protective Relay Industry Market Report: 2019-2033
This comprehensive report provides an in-depth analysis of the Protective Relay Industry, covering market size, segmentation, key players, growth drivers, challenges, and future outlook. The study period spans 2019-2033, with 2025 serving as the base and estimated year. The report offers actionable insights for industry stakeholders, investors, and businesses seeking to navigate this dynamic market. The global market value in 2025 is estimated at $XX Million.
Protective Relay Industry Market Concentration & Innovation
The Protective Relay Industry is characterized by a moderately concentrated market structure, with several multinational corporations holding significant market share. Key players such as Rockwell Automation, ABB Ltd, Siemens AG, and Schneider Electric SE account for a combined xx% of the global market in 2025. Market share fluctuations are influenced by factors such as M&A activity, technological advancements, and regional variations in demand.
- Innovation Drivers: Stringent safety regulations, increasing demand for grid modernization, and the adoption of smart grids are driving innovation in protective relay technology. This includes advancements in digital protection relays, communication protocols (like IEC 61850), and the integration of artificial intelligence (AI) and machine learning (ML) for predictive maintenance.
- Regulatory Frameworks: Government regulations mandating enhanced grid reliability and safety standards are significantly impacting the market. Compliance with these standards requires investments in advanced protective relay systems.
- Product Substitutes: While there are no direct substitutes for protective relays, advancements in alternative technologies like power electronic devices could indirectly impact market growth.
- End-User Trends: The increasing adoption of renewable energy sources and the growth of distributed generation are leading to changes in protective relay requirements, demanding more sophisticated and adaptable systems.
- M&A Activities: The industry has witnessed several mergers and acquisitions in recent years, with deal values exceeding $XX Million in the past five years. These activities aim to expand market reach, enhance technological capabilities, and improve competitiveness. For example, the acquisition of [Company A] by [Company B] in [Year] significantly altered market dynamics.
Protective Relay Industry Industry Trends & Insights
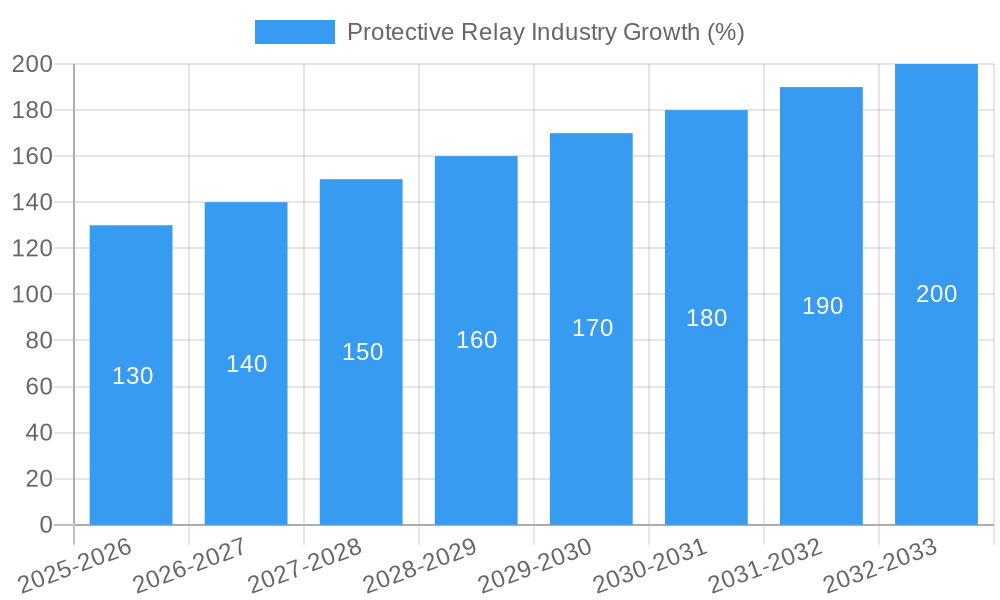
The Protective Relay Industry is experiencing robust growth, driven by factors such as the expanding global electricity grid, rising demand for reliable power distribution, and the need for improved grid stability. The market is projected to achieve a CAGR of xx% during the forecast period (2025-2033), reaching an estimated value of $XX Million by 2033.
Market penetration of advanced digital protection relays is steadily increasing, surpassing xx% in key markets. Technological disruptions are shaping the industry, with a shift towards digital protection relays, improved communication protocols, and the integration of AI and ML for advanced diagnostics and predictive maintenance. Consumer preferences are moving towards solutions that offer enhanced safety, improved reliability, and reduced maintenance costs. Competitive dynamics are intense, with companies investing heavily in R&D to develop innovative products and expand their market share.
Dominant Markets & Segments in Protective Relay Industry
The high-voltage segment dominates the protective relay market, driven by the extensive power transmission infrastructure in developed regions. The utility sector is the largest end-user, accounting for approximately xx% of the market value.
Dominant Regions/Countries:
- North America: Stringent safety regulations, ongoing grid modernization initiatives, and substantial investments in renewable energy infrastructure are key growth drivers.
- Europe: Emphasis on grid modernization, smart grid deployments, and the integration of renewable energy sources fuel market expansion.
- Asia-Pacific: Rapid economic growth, increasing industrialization, and expanding power infrastructure contribute to significant market potential.
Key Drivers for Dominant Segments:
- High-Voltage Segment: Significant investments in transmission infrastructure, stringent reliability requirements, and the need for advanced protection solutions drive this segment.
- Utilities Sector: The imperative to ensure reliable power supply, improve grid stability, and enhance safety measures fuel demand from this segment.
Protective Relay Industry Product Developments
Recent product innovations focus on improving reliability, safety, and communication capabilities. Digital protective relays are gaining prominence, offering enhanced functionalities, advanced diagnostics, and seamless integration with smart grid technologies. The integration of AI and ML enables predictive maintenance, optimizing operational efficiency and reducing downtime. These advancements translate to competitive advantages by offering superior performance, reduced maintenance costs, and improved grid resilience.
Report Scope & Segmentation Analysis
This report segments the Protective Relay Industry by voltage range (low-voltage, medium-voltage, high-voltage) and end-user (utilities, industrial).
By Voltage Range:
- Low-Voltage: This segment is characterized by smaller scale applications, with growth driven by increased industrial automation and the adoption of smart building technologies. The market size is estimated at $XX Million in 2025.
- Medium-Voltage: This segment exhibits steady growth, driven by industrial automation, distribution grid enhancements, and investments in renewable energy. The market size is projected to reach $XX Million by 2033.
- High-Voltage: This segment dominates the market due to its crucial role in long-distance power transmission. This segment is expected to maintain its market leadership, with substantial growth potential.
By End-User:
- Utilities: This sector remains the largest end-user, with consistent demand driven by grid stability requirements, safety regulations, and the integration of renewable energy sources. The market size for utilities is estimated at $XX Million in 2025.
- Industrial: Growth in this sector is fuelled by industrial automation, increasing energy consumption, and the need for enhanced safety and reliability in manufacturing processes. The market size for the industrial segment is projected to reach $XX Million by 2033.
Key Drivers of Protective Relay Industry Growth
Several factors fuel the growth of the Protective Relay Industry:
- Technological Advancements: The development of digital protection relays, improved communication protocols (like IEC 61850), and the integration of AI and ML for predictive maintenance are driving market growth.
- Economic Growth: Expanding electricity grids in developing economies create significant demand for protective relay systems.
- Stringent Safety Regulations: Government regulations emphasizing grid reliability and safety enhance the adoption of advanced protective relay technologies.
Challenges in the Protective Relay Industry Sector
The Protective Relay Industry faces several challenges:
- High Initial Investment Costs: The cost of advanced protective relay systems can be substantial, posing a barrier to adoption, particularly for smaller utilities and industries.
- Supply Chain Disruptions: Global supply chain uncertainties can impact the availability of components and affect the timely delivery of projects.
- Intense Competition: The market is highly competitive, with established players and emerging companies vying for market share.
Emerging Opportunities in Protective Relay Industry
Emerging opportunities exist in:
- Smart Grid Integration: The increasing adoption of smart grid technologies creates opportunities for advanced protective relay systems with enhanced communication and data analytics capabilities.
- Renewable Energy Integration: The rise of renewable energy sources necessitates the development of protective relays compatible with diverse energy sources.
- Cybersecurity: Enhanced cybersecurity solutions for protective relays are crucial to mitigate potential risks associated with grid vulnerabilities.
Leading Players in the Protective Relay Industry Market
- Rockwell Automation
- ABB Ltd
- Toshiba Corporation
- Littelfuse Inc
- L&T Electrical & Automation (Schneider Electric SE)
- Mitsubishi Electric Corporation
- Siemens AG
- Schneider Electric SE
- Eaton Corporation PLC
- Bender GmbH & Co KG
- NR Electric Co Lt
- Schweitzer Engineering Laboratories
- General Electric Company
- Fanox Electronics
Key Developments in Protective Relay Industry Industry
- August 2023: Rockwell Automation developed ArcShield technology for CENTERLINE motor control centers (MCCs) to enhance workforce safety and mitigate arc flash damage, expanding its reach to Canadian manufacturers in high-amp applications.
- January 2024: Fanox Electronics launched the SIR-C Overhead Control and Feeder Protection system, an advanced high-protection relay solution integrating primary and secondary distribution current, voltage, and frequency functions.
Strategic Outlook for Protective Relay Industry Market
The Protective Relay Industry is poised for continued growth, driven by technological advancements, increasing demand for reliable power distribution, and the imperative to enhance grid resilience. The integration of AI and ML, the expansion of smart grid technologies, and the growth of renewable energy sources present significant opportunities for market expansion and innovation. Companies focusing on developing advanced, reliable, and cost-effective solutions will be best positioned to capitalize on this dynamic market.
Protective Relay Industry Segmentation
-
1. Voltage Range
- 1.1. Low-voltage
- 1.2. Medium-voltage
- 1.3. High-voltage
-
2. End User
- 2.1. Utilities
- 2.2. Industrial
Protective Relay Industry Segmentation By Geography
-
1. North America
- 1.1. United States
- 1.2. Canada
-
2. Europe
- 2.1. United Kingdom
- 2.2. Germany
- 2.3. France
-
3. Asia
- 3.1. China
- 3.2. Japan
- 3.3. India
- 4. Australia and New Zealand
- 5. Latin America
- 6. Middle East and Africa
Protective Relay Industry REPORT HIGHLIGHTS
| Aspects | Details |
|---|---|
| Study Period | 2019-2033 |
| Base Year | 2024 |
| Estimated Year | 2025 |
| Forecast Period | 2025-2033 |
| Historical Period | 2019-2024 |
| Growth Rate | CAGR of 5.98% from 2019-2033 |
| Segmentation |
|
Table of Contents
- 1. Introduction
- 1.1. Research Scope
- 1.2. Market Segmentation
- 1.3. Research Methodology
- 1.4. Definitions and Assumptions
- 2. Executive Summary
- 2.1. Introduction
- 3. Market Dynamics
- 3.1. Introduction
- 3.2. Market Drivers
- 3.2.1. Growth in Electricity Consumption; Increasing Use of Renewable Energy Sources
- 3.3. Market Restrains
- 3.3.1. Higher Cost and Increasing Competition from Unorganized Sector
- 3.4. Market Trends
- 3.4.1. Utilities Segment to Hold Significant Market Share
- 4. Market Factor Analysis
- 4.1. Porters Five Forces
- 4.2. Supply/Value Chain
- 4.3. PESTEL analysis
- 4.4. Market Entropy
- 4.5. Patent/Trademark Analysis
- 5. Global Protective Relay Industry Analysis, Insights and Forecast, 2019-2031
- 5.1. Market Analysis, Insights and Forecast - by Voltage Range
- 5.1.1. Low-voltage
- 5.1.2. Medium-voltage
- 5.1.3. High-voltage
- 5.2. Market Analysis, Insights and Forecast - by End User
- 5.2.1. Utilities
- 5.2.2. Industrial
- 5.3. Market Analysis, Insights and Forecast - by Region
- 5.3.1. North America
- 5.3.2. Europe
- 5.3.3. Asia
- 5.3.4. Australia and New Zealand
- 5.3.5. Latin America
- 5.3.6. Middle East and Africa
- 5.1. Market Analysis, Insights and Forecast - by Voltage Range
- 6. North America Protective Relay Industry Analysis, Insights and Forecast, 2019-2031
- 6.1. Market Analysis, Insights and Forecast - by Voltage Range
- 6.1.1. Low-voltage
- 6.1.2. Medium-voltage
- 6.1.3. High-voltage
- 6.2. Market Analysis, Insights and Forecast - by End User
- 6.2.1. Utilities
- 6.2.2. Industrial
- 6.1. Market Analysis, Insights and Forecast - by Voltage Range
- 7. Europe Protective Relay Industry Analysis, Insights and Forecast, 2019-2031
- 7.1. Market Analysis, Insights and Forecast - by Voltage Range
- 7.1.1. Low-voltage
- 7.1.2. Medium-voltage
- 7.1.3. High-voltage
- 7.2. Market Analysis, Insights and Forecast - by End User
- 7.2.1. Utilities
- 7.2.2. Industrial
- 7.1. Market Analysis, Insights and Forecast - by Voltage Range
- 8. Asia Protective Relay Industry Analysis, Insights and Forecast, 2019-2031
- 8.1. Market Analysis, Insights and Forecast - by Voltage Range
- 8.1.1. Low-voltage
- 8.1.2. Medium-voltage
- 8.1.3. High-voltage
- 8.2. Market Analysis, Insights and Forecast - by End User
- 8.2.1. Utilities
- 8.2.2. Industrial
- 8.1. Market Analysis, Insights and Forecast - by Voltage Range
- 9. Australia and New Zealand Protective Relay Industry Analysis, Insights and Forecast, 2019-2031
- 9.1. Market Analysis, Insights and Forecast - by Voltage Range
- 9.1.1. Low-voltage
- 9.1.2. Medium-voltage
- 9.1.3. High-voltage
- 9.2. Market Analysis, Insights and Forecast - by End User
- 9.2.1. Utilities
- 9.2.2. Industrial
- 9.1. Market Analysis, Insights and Forecast - by Voltage Range
- 10. Latin America Protective Relay Industry Analysis, Insights and Forecast, 2019-2031
- 10.1. Market Analysis, Insights and Forecast - by Voltage Range
- 10.1.1. Low-voltage
- 10.1.2. Medium-voltage
- 10.1.3. High-voltage
- 10.2. Market Analysis, Insights and Forecast - by End User
- 10.2.1. Utilities
- 10.2.2. Industrial
- 10.1. Market Analysis, Insights and Forecast - by Voltage Range
- 11. Middle East and Africa Protective Relay Industry Analysis, Insights and Forecast, 2019-2031
- 11.1. Market Analysis, Insights and Forecast - by Voltage Range
- 11.1.1. Low-voltage
- 11.1.2. Medium-voltage
- 11.1.3. High-voltage
- 11.2. Market Analysis, Insights and Forecast - by End User
- 11.2.1. Utilities
- 11.2.2. Industrial
- 11.1. Market Analysis, Insights and Forecast - by Voltage Range
- 12. North America Protective Relay Industry Analysis, Insights and Forecast, 2019-2031
- 12.1. Market Analysis, Insights and Forecast - By Country/Sub-region
- 12.1.1 United States
- 12.1.2 Canada
- 12.1.3 Mexico
- 13. Europe Protective Relay Industry Analysis, Insights and Forecast, 2019-2031
- 13.1. Market Analysis, Insights and Forecast - By Country/Sub-region
- 13.1.1 Germany
- 13.1.2 United Kingdom
- 13.1.3 France
- 13.1.4 Spain
- 13.1.5 Italy
- 13.1.6 Spain
- 13.1.7 Belgium
- 13.1.8 Netherland
- 13.1.9 Nordics
- 13.1.10 Rest of Europe
- 14. Asia Pacific Protective Relay Industry Analysis, Insights and Forecast, 2019-2031
- 14.1. Market Analysis, Insights and Forecast - By Country/Sub-region
- 14.1.1 China
- 14.1.2 Japan
- 14.1.3 India
- 14.1.4 South Korea
- 14.1.5 Southeast Asia
- 14.1.6 Australia
- 14.1.7 Indonesia
- 14.1.8 Phillipes
- 14.1.9 Singapore
- 14.1.10 Thailandc
- 14.1.11 Rest of Asia Pacific
- 15. South America Protective Relay Industry Analysis, Insights and Forecast, 2019-2031
- 15.1. Market Analysis, Insights and Forecast - By Country/Sub-region
- 15.1.1 Brazil
- 15.1.2 Argentina
- 15.1.3 Peru
- 15.1.4 Chile
- 15.1.5 Colombia
- 15.1.6 Ecuador
- 15.1.7 Venezuela
- 15.1.8 Rest of South America
- 16. North America Protective Relay Industry Analysis, Insights and Forecast, 2019-2031
- 16.1. Market Analysis, Insights and Forecast - By Country/Sub-region
- 16.1.1 United States
- 16.1.2 Canada
- 16.1.3 Mexico
- 17. MEA Protective Relay Industry Analysis, Insights and Forecast, 2019-2031
- 17.1. Market Analysis, Insights and Forecast - By Country/Sub-region
- 17.1.1 United Arab Emirates
- 17.1.2 Saudi Arabia
- 17.1.3 South Africa
- 17.1.4 Rest of Middle East and Africa
- 18. Competitive Analysis
- 18.1. Global Market Share Analysis 2024
- 18.2. Company Profiles
- 18.2.1 Rockwell Automation
- 18.2.1.1. Overview
- 18.2.1.2. Products
- 18.2.1.3. SWOT Analysis
- 18.2.1.4. Recent Developments
- 18.2.1.5. Financials (Based on Availability)
- 18.2.2 ABB Ltd
- 18.2.2.1. Overview
- 18.2.2.2. Products
- 18.2.2.3. SWOT Analysis
- 18.2.2.4. Recent Developments
- 18.2.2.5. Financials (Based on Availability)
- 18.2.3 Toshiba Corporation
- 18.2.3.1. Overview
- 18.2.3.2. Products
- 18.2.3.3. SWOT Analysis
- 18.2.3.4. Recent Developments
- 18.2.3.5. Financials (Based on Availability)
- 18.2.4 Littelfuse Inc
- 18.2.4.1. Overview
- 18.2.4.2. Products
- 18.2.4.3. SWOT Analysis
- 18.2.4.4. Recent Developments
- 18.2.4.5. Financials (Based on Availability)
- 18.2.5 L&T Electrical & Automation (Schneider Electric SE)
- 18.2.5.1. Overview
- 18.2.5.2. Products
- 18.2.5.3. SWOT Analysis
- 18.2.5.4. Recent Developments
- 18.2.5.5. Financials (Based on Availability)
- 18.2.6 Mitsubishi Electric Corporation
- 18.2.6.1. Overview
- 18.2.6.2. Products
- 18.2.6.3. SWOT Analysis
- 18.2.6.4. Recent Developments
- 18.2.6.5. Financials (Based on Availability)
- 18.2.7 Siemens AG
- 18.2.7.1. Overview
- 18.2.7.2. Products
- 18.2.7.3. SWOT Analysis
- 18.2.7.4. Recent Developments
- 18.2.7.5. Financials (Based on Availability)
- 18.2.8 Schneider Electric SE
- 18.2.8.1. Overview
- 18.2.8.2. Products
- 18.2.8.3. SWOT Analysis
- 18.2.8.4. Recent Developments
- 18.2.8.5. Financials (Based on Availability)
- 18.2.9 Eaton Corporation PLC
- 18.2.9.1. Overview
- 18.2.9.2. Products
- 18.2.9.3. SWOT Analysis
- 18.2.9.4. Recent Developments
- 18.2.9.5. Financials (Based on Availability)
- 18.2.10 Bender GmbH & Co KG
- 18.2.10.1. Overview
- 18.2.10.2. Products
- 18.2.10.3. SWOT Analysis
- 18.2.10.4. Recent Developments
- 18.2.10.5. Financials (Based on Availability)
- 18.2.11 NR Electric Co Lt
- 18.2.11.1. Overview
- 18.2.11.2. Products
- 18.2.11.3. SWOT Analysis
- 18.2.11.4. Recent Developments
- 18.2.11.5. Financials (Based on Availability)
- 18.2.12 Schweitzer Engineering Laboratories
- 18.2.12.1. Overview
- 18.2.12.2. Products
- 18.2.12.3. SWOT Analysis
- 18.2.12.4. Recent Developments
- 18.2.12.5. Financials (Based on Availability)
- 18.2.13 General Electric Company
- 18.2.13.1. Overview
- 18.2.13.2. Products
- 18.2.13.3. SWOT Analysis
- 18.2.13.4. Recent Developments
- 18.2.13.5. Financials (Based on Availability)
- 18.2.14 Fanox Electronics
- 18.2.14.1. Overview
- 18.2.14.2. Products
- 18.2.14.3. SWOT Analysis
- 18.2.14.4. Recent Developments
- 18.2.14.5. Financials (Based on Availability)
- 18.2.1 Rockwell Automation
List of Figures
- Figure 1: Global Protective Relay Industry Revenue Breakdown (Million, %) by Region 2024 & 2032
- Figure 2: North America Protective Relay Industry Revenue (Million), by Country 2024 & 2032
- Figure 3: North America Protective Relay Industry Revenue Share (%), by Country 2024 & 2032
- Figure 4: Europe Protective Relay Industry Revenue (Million), by Country 2024 & 2032
- Figure 5: Europe Protective Relay Industry Revenue Share (%), by Country 2024 & 2032
- Figure 6: Asia Pacific Protective Relay Industry Revenue (Million), by Country 2024 & 2032
- Figure 7: Asia Pacific Protective Relay Industry Revenue Share (%), by Country 2024 & 2032
- Figure 8: South America Protective Relay Industry Revenue (Million), by Country 2024 & 2032
- Figure 9: South America Protective Relay Industry Revenue Share (%), by Country 2024 & 2032
- Figure 10: North America Protective Relay Industry Revenue (Million), by Country 2024 & 2032
- Figure 11: North America Protective Relay Industry Revenue Share (%), by Country 2024 & 2032
- Figure 12: MEA Protective Relay Industry Revenue (Million), by Country 2024 & 2032
- Figure 13: MEA Protective Relay Industry Revenue Share (%), by Country 2024 & 2032
- Figure 14: North America Protective Relay Industry Revenue (Million), by Voltage Range 2024 & 2032
- Figure 15: North America Protective Relay Industry Revenue Share (%), by Voltage Range 2024 & 2032
- Figure 16: North America Protective Relay Industry Revenue (Million), by End User 2024 & 2032
- Figure 17: North America Protective Relay Industry Revenue Share (%), by End User 2024 & 2032
- Figure 18: North America Protective Relay Industry Revenue (Million), by Country 2024 & 2032
- Figure 19: North America Protective Relay Industry Revenue Share (%), by Country 2024 & 2032
- Figure 20: Europe Protective Relay Industry Revenue (Million), by Voltage Range 2024 & 2032
- Figure 21: Europe Protective Relay Industry Revenue Share (%), by Voltage Range 2024 & 2032
- Figure 22: Europe Protective Relay Industry Revenue (Million), by End User 2024 & 2032
- Figure 23: Europe Protective Relay Industry Revenue Share (%), by End User 2024 & 2032
- Figure 24: Europe Protective Relay Industry Revenue (Million), by Country 2024 & 2032
- Figure 25: Europe Protective Relay Industry Revenue Share (%), by Country 2024 & 2032
- Figure 26: Asia Protective Relay Industry Revenue (Million), by Voltage Range 2024 & 2032
- Figure 27: Asia Protective Relay Industry Revenue Share (%), by Voltage Range 2024 & 2032
- Figure 28: Asia Protective Relay Industry Revenue (Million), by End User 2024 & 2032
- Figure 29: Asia Protective Relay Industry Revenue Share (%), by End User 2024 & 2032
- Figure 30: Asia Protective Relay Industry Revenue (Million), by Country 2024 & 2032
- Figure 31: Asia Protective Relay Industry Revenue Share (%), by Country 2024 & 2032
- Figure 32: Australia and New Zealand Protective Relay Industry Revenue (Million), by Voltage Range 2024 & 2032
- Figure 33: Australia and New Zealand Protective Relay Industry Revenue Share (%), by Voltage Range 2024 & 2032
- Figure 34: Australia and New Zealand Protective Relay Industry Revenue (Million), by End User 2024 & 2032
- Figure 35: Australia and New Zealand Protective Relay Industry Revenue Share (%), by End User 2024 & 2032
- Figure 36: Australia and New Zealand Protective Relay Industry Revenue (Million), by Country 2024 & 2032
- Figure 37: Australia and New Zealand Protective Relay Industry Revenue Share (%), by Country 2024 & 2032
- Figure 38: Latin America Protective Relay Industry Revenue (Million), by Voltage Range 2024 & 2032
- Figure 39: Latin America Protective Relay Industry Revenue Share (%), by Voltage Range 2024 & 2032
- Figure 40: Latin America Protective Relay Industry Revenue (Million), by End User 2024 & 2032
- Figure 41: Latin America Protective Relay Industry Revenue Share (%), by End User 2024 & 2032
- Figure 42: Latin America Protective Relay Industry Revenue (Million), by Country 2024 & 2032
- Figure 43: Latin America Protective Relay Industry Revenue Share (%), by Country 2024 & 2032
- Figure 44: Middle East and Africa Protective Relay Industry Revenue (Million), by Voltage Range 2024 & 2032
- Figure 45: Middle East and Africa Protective Relay Industry Revenue Share (%), by Voltage Range 2024 & 2032
- Figure 46: Middle East and Africa Protective Relay Industry Revenue (Million), by End User 2024 & 2032
- Figure 47: Middle East and Africa Protective Relay Industry Revenue Share (%), by End User 2024 & 2032
- Figure 48: Middle East and Africa Protective Relay Industry Revenue (Million), by Country 2024 & 2032
- Figure 49: Middle East and Africa Protective Relay Industry Revenue Share (%), by Country 2024 & 2032
List of Tables
- Table 1: Global Protective Relay Industry Revenue Million Forecast, by Region 2019 & 2032
- Table 2: Global Protective Relay Industry Revenue Million Forecast, by Voltage Range 2019 & 2032
- Table 3: Global Protective Relay Industry Revenue Million Forecast, by End User 2019 & 2032
- Table 4: Global Protective Relay Industry Revenue Million Forecast, by Region 2019 & 2032
- Table 5: Global Protective Relay Industry Revenue Million Forecast, by Country 2019 & 2032
- Table 6: United States Protective Relay Industry Revenue (Million) Forecast, by Application 2019 & 2032
- Table 7: Canada Protective Relay Industry Revenue (Million) Forecast, by Application 2019 & 2032
- Table 8: Mexico Protective Relay Industry Revenue (Million) Forecast, by Application 2019 & 2032
- Table 9: Global Protective Relay Industry Revenue Million Forecast, by Country 2019 & 2032
- Table 10: Germany Protective Relay Industry Revenue (Million) Forecast, by Application 2019 & 2032
- Table 11: United Kingdom Protective Relay Industry Revenue (Million) Forecast, by Application 2019 & 2032
- Table 12: France Protective Relay Industry Revenue (Million) Forecast, by Application 2019 & 2032
- Table 13: Spain Protective Relay Industry Revenue (Million) Forecast, by Application 2019 & 2032
- Table 14: Italy Protective Relay Industry Revenue (Million) Forecast, by Application 2019 & 2032
- Table 15: Spain Protective Relay Industry Revenue (Million) Forecast, by Application 2019 & 2032
- Table 16: Belgium Protective Relay Industry Revenue (Million) Forecast, by Application 2019 & 2032
- Table 17: Netherland Protective Relay Industry Revenue (Million) Forecast, by Application 2019 & 2032
- Table 18: Nordics Protective Relay Industry Revenue (Million) Forecast, by Application 2019 & 2032
- Table 19: Rest of Europe Protective Relay Industry Revenue (Million) Forecast, by Application 2019 & 2032
- Table 20: Global Protective Relay Industry Revenue Million Forecast, by Country 2019 & 2032
- Table 21: China Protective Relay Industry Revenue (Million) Forecast, by Application 2019 & 2032
- Table 22: Japan Protective Relay Industry Revenue (Million) Forecast, by Application 2019 & 2032
- Table 23: India Protective Relay Industry Revenue (Million) Forecast, by Application 2019 & 2032
- Table 24: South Korea Protective Relay Industry Revenue (Million) Forecast, by Application 2019 & 2032
- Table 25: Southeast Asia Protective Relay Industry Revenue (Million) Forecast, by Application 2019 & 2032
- Table 26: Australia Protective Relay Industry Revenue (Million) Forecast, by Application 2019 & 2032
- Table 27: Indonesia Protective Relay Industry Revenue (Million) Forecast, by Application 2019 & 2032
- Table 28: Phillipes Protective Relay Industry Revenue (Million) Forecast, by Application 2019 & 2032
- Table 29: Singapore Protective Relay Industry Revenue (Million) Forecast, by Application 2019 & 2032
- Table 30: Thailandc Protective Relay Industry Revenue (Million) Forecast, by Application 2019 & 2032
- Table 31: Rest of Asia Pacific Protective Relay Industry Revenue (Million) Forecast, by Application 2019 & 2032
- Table 32: Global Protective Relay Industry Revenue Million Forecast, by Country 2019 & 2032
- Table 33: Brazil Protective Relay Industry Revenue (Million) Forecast, by Application 2019 & 2032
- Table 34: Argentina Protective Relay Industry Revenue (Million) Forecast, by Application 2019 & 2032
- Table 35: Peru Protective Relay Industry Revenue (Million) Forecast, by Application 2019 & 2032
- Table 36: Chile Protective Relay Industry Revenue (Million) Forecast, by Application 2019 & 2032
- Table 37: Colombia Protective Relay Industry Revenue (Million) Forecast, by Application 2019 & 2032
- Table 38: Ecuador Protective Relay Industry Revenue (Million) Forecast, by Application 2019 & 2032
- Table 39: Venezuela Protective Relay Industry Revenue (Million) Forecast, by Application 2019 & 2032
- Table 40: Rest of South America Protective Relay Industry Revenue (Million) Forecast, by Application 2019 & 2032
- Table 41: Global Protective Relay Industry Revenue Million Forecast, by Country 2019 & 2032
- Table 42: United States Protective Relay Industry Revenue (Million) Forecast, by Application 2019 & 2032
- Table 43: Canada Protective Relay Industry Revenue (Million) Forecast, by Application 2019 & 2032
- Table 44: Mexico Protective Relay Industry Revenue (Million) Forecast, by Application 2019 & 2032
- Table 45: Global Protective Relay Industry Revenue Million Forecast, by Country 2019 & 2032
- Table 46: United Arab Emirates Protective Relay Industry Revenue (Million) Forecast, by Application 2019 & 2032
- Table 47: Saudi Arabia Protective Relay Industry Revenue (Million) Forecast, by Application 2019 & 2032
- Table 48: South Africa Protective Relay Industry Revenue (Million) Forecast, by Application 2019 & 2032
- Table 49: Rest of Middle East and Africa Protective Relay Industry Revenue (Million) Forecast, by Application 2019 & 2032
- Table 50: Global Protective Relay Industry Revenue Million Forecast, by Voltage Range 2019 & 2032
- Table 51: Global Protective Relay Industry Revenue Million Forecast, by End User 2019 & 2032
- Table 52: Global Protective Relay Industry Revenue Million Forecast, by Country 2019 & 2032
- Table 53: United States Protective Relay Industry Revenue (Million) Forecast, by Application 2019 & 2032
- Table 54: Canada Protective Relay Industry Revenue (Million) Forecast, by Application 2019 & 2032
- Table 55: Global Protective Relay Industry Revenue Million Forecast, by Voltage Range 2019 & 2032
- Table 56: Global Protective Relay Industry Revenue Million Forecast, by End User 2019 & 2032
- Table 57: Global Protective Relay Industry Revenue Million Forecast, by Country 2019 & 2032
- Table 58: United Kingdom Protective Relay Industry Revenue (Million) Forecast, by Application 2019 & 2032
- Table 59: Germany Protective Relay Industry Revenue (Million) Forecast, by Application 2019 & 2032
- Table 60: France Protective Relay Industry Revenue (Million) Forecast, by Application 2019 & 2032
- Table 61: Global Protective Relay Industry Revenue Million Forecast, by Voltage Range 2019 & 2032
- Table 62: Global Protective Relay Industry Revenue Million Forecast, by End User 2019 & 2032
- Table 63: Global Protective Relay Industry Revenue Million Forecast, by Country 2019 & 2032
- Table 64: China Protective Relay Industry Revenue (Million) Forecast, by Application 2019 & 2032
- Table 65: Japan Protective Relay Industry Revenue (Million) Forecast, by Application 2019 & 2032
- Table 66: India Protective Relay Industry Revenue (Million) Forecast, by Application 2019 & 2032
- Table 67: Global Protective Relay Industry Revenue Million Forecast, by Voltage Range 2019 & 2032
- Table 68: Global Protective Relay Industry Revenue Million Forecast, by End User 2019 & 2032
- Table 69: Global Protective Relay Industry Revenue Million Forecast, by Country 2019 & 2032
- Table 70: Global Protective Relay Industry Revenue Million Forecast, by Voltage Range 2019 & 2032
- Table 71: Global Protective Relay Industry Revenue Million Forecast, by End User 2019 & 2032
- Table 72: Global Protective Relay Industry Revenue Million Forecast, by Country 2019 & 2032
- Table 73: Global Protective Relay Industry Revenue Million Forecast, by Voltage Range 2019 & 2032
- Table 74: Global Protective Relay Industry Revenue Million Forecast, by End User 2019 & 2032
- Table 75: Global Protective Relay Industry Revenue Million Forecast, by Country 2019 & 2032
Frequently Asked Questions
1. What is the projected Compound Annual Growth Rate (CAGR) of the Protective Relay Industry?
The projected CAGR is approximately 5.98%.
2. Which companies are prominent players in the Protective Relay Industry?
Key companies in the market include Rockwell Automation, ABB Ltd, Toshiba Corporation, Littelfuse Inc, L&T Electrical & Automation (Schneider Electric SE), Mitsubishi Electric Corporation, Siemens AG, Schneider Electric SE, Eaton Corporation PLC, Bender GmbH & Co KG, NR Electric Co Lt, Schweitzer Engineering Laboratories, General Electric Company, Fanox Electronics.
3. What are the main segments of the Protective Relay Industry?
The market segments include Voltage Range, End User.
4. Can you provide details about the market size?
The market size is estimated to be USD 2.14 Million as of 2022.
5. What are some drivers contributing to market growth?
Growth in Electricity Consumption; Increasing Use of Renewable Energy Sources.
6. What are the notable trends driving market growth?
Utilities Segment to Hold Significant Market Share.
7. Are there any restraints impacting market growth?
Higher Cost and Increasing Competition from Unorganized Sector.
8. Can you provide examples of recent developments in the market?
January 2024 - Fanox Electronics succeeded in delivering advanced high-protection relay solutions for diverse applications. Specifically, it presents the SIR-C OverheadControl and FeederProtection system. The SIR-C functions as an overhead control / RTU and feeder protection relay. It incorporates primary and secondary distribution current, voltage, and frequency functions. The relay has an auxiliary power supply of 24 to 230 Vdc/ac, ensuring robust and reliable performance.
9. What pricing options are available for accessing the report?
Pricing options include single-user, multi-user, and enterprise licenses priced at USD 4750, USD 5250, and USD 8750 respectively.
10. Is the market size provided in terms of value or volume?
The market size is provided in terms of value, measured in Million.
11. Are there any specific market keywords associated with the report?
Yes, the market keyword associated with the report is "Protective Relay Industry," which aids in identifying and referencing the specific market segment covered.
12. How do I determine which pricing option suits my needs best?
The pricing options vary based on user requirements and access needs. Individual users may opt for single-user licenses, while businesses requiring broader access may choose multi-user or enterprise licenses for cost-effective access to the report.
13. Are there any additional resources or data provided in the Protective Relay Industry report?
While the report offers comprehensive insights, it's advisable to review the specific contents or supplementary materials provided to ascertain if additional resources or data are available.
14. How can I stay updated on further developments or reports in the Protective Relay Industry?
To stay informed about further developments, trends, and reports in the Protective Relay Industry, consider subscribing to industry newsletters, following relevant companies and organizations, or regularly checking reputable industry news sources and publications.
Methodology
Step 1 - Identification of Relevant Samples Size from Population Database


Step 2 - Approaches for Defining Global Market Size (Value, Volume* & Price*)

Note*: In applicable scenarios
Step 3 - Data Sources
Primary Research
- Web Analytics
- Survey Reports
- Research Institute
- Latest Research Reports
- Opinion Leaders
Secondary Research
- Annual Reports
- White Paper
- Latest Press Release
- Industry Association
- Paid Database
- Investor Presentations

Step 4 - Data Triangulation
Involves using different sources of information in order to increase the validity of a study
These sources are likely to be stakeholders in a program - participants, other researchers, program staff, other community members, and so on.
Then we put all data in single framework & apply various statistical tools to find out the dynamic on the market.
During the analysis stage, feedback from the stakeholder groups would be compared to determine areas of agreement as well as areas of divergence


